


Abstract
Although it is accepted that the metabolic fate of 1-11C-acetate is different in tumors than in myocardial tissue because of different clearance patterns, the exact pathway has not been fully elucidated. For decades, fatty acid synthesis has been quantified in vitro by the incubation of cells with 14C-acetate. Fatty acid synthase (FAS) has been found to be overexpressed in prostate carcinomas, as well as other cancers, and it is possible that imaging with 1-11C-acetate could be a marker for its expression. Methods: In vitro and in vivo uptake experiments in prostate tumor models with 1-11C-acetate were performed both with and without blocking of fatty acid synthesis with either C75, an inhibitor of FAS, or 5-(tetradecyloxy)-2-furoic acid (TOFA), an inhibitor of acetyl-CoA carboxylase (ACC). FAS levels were measured by Western blot and immunohistochemical techniques for comparison. Results: In vitro studies in 3 different prostate tumor models (PC-3, LNCaP, and 22Rv1) demonstrated blocking of 1-11C-acetate accumulation after treatment with both C75 and TOFA. This was further shown in vivo in PC-3 and LNCaP tumor-bearing mice after a single treatment with C75. A positive correlation between 1-11C-acetate uptake into the solid tumors and FAS expression levels was found. Conclusion: Extensive involvement of the fatty acid synthesis pathway in 1-11C-acetate uptake in prostate tumors was confirmed, leading to a possible marker for FAS expression in vivo by noninvasive PET.
The National Cancer Institute estimates that roughly 219,000 new cases of prostate cancer and about 27,000 deaths from this disease will occur in 2007 (1). In the early 1990s, early and widespread detection of prostate cancers was made possible by promotion of prostate-specific antigen (PSA) screening in conjunction with digital rectal examination. Elevated PSA levels are quite high in a patient with prostate cancer but, unfortunately, are also caused by benign prostatic hyperplasia and even inflammation or urinary retention (2). Transrectal ultrasound is frequently used to assist surgeons in biopsy and for local staging, CT and MRI are commonly used to determine the extent of disease, although structural changes are not always apparent with these modalities (3).
18F-FDG PET has become essential in the diagnosis of many malignancies, but it is not ideal in the detection of prostate cancer. Prostate cancer is one of a handful of tumors with low metabolism. and 18F-FDG, being a marker of glucose metabolism, is not highly effective in delineating it from surrounding tissue (4). Although 18F-FDG has been shown to be effective in the assessment of high-grade primary tumors and metastatic disease (5–9), other obstacles still leave much to be desired for its use with prostate malignancies, especially at early stages. The bladder clearance of 18F-FDG also poses an obstacle as it is in the same anatomic region as the prostate, and, therefore, the primary tumor. Studies have also shown an inability to differentiate benign hyperplasia in the prostate from malignant disease or postoperative scarring from radical prostatectomy (10,11).
Because of the problems associated with 18F-FDG imaging in prostate, alternative modalities must be used to image prostate cancer. Clinically, 1-11C-acetate has been shown to be an effective tracer for the delineation of prostate cancer and its metastases with PET in humans (12–16). Although it is accepted that the metabolic fate of 1-11C-acetate in tumors differs from that in normal tissue, the exact pathway has not been fully elucidated. Interestingly, fatty acid synthesis has been quantified in vitro by the incubation of cells with 14C-acetate.
Fatty acid synthase (FAS) is a multifunctional enzymatic protein that catalyzes fatty acid biosynthesis (17). FAS is overexpressed in prostate carcinomas as well as other cancers (18–22). On the other hand, FAS levels are low or absent in most normal tissues. FAS levels are associated with tumor aggressiveness in late-stage prostatic adenocarcinomas as well as a prognostic indicator for overall survival (23). Previous studies have demonstrated that FAS inhibitors can reduce 14C-acetate incorporation in human tumor cell lines and in human lung xenografts and mouse prostate tumors ex vivo (24–27). Because of these facts, we hypothesize that FAS is involved with 1-11C-acetate uptake in prostate cancer. The following reports an examination of the mechanism of 1-11C-acetate uptake in prostate tumor models and its implications for tumor progression and patient survival. Understanding the mechanism of 1-11C-acetate uptake and the relation to FAS expression levels could provide a valuable tool to clinicians for the planning and monitoring of treatments because of the increased mortality with raised levels of this protein in prostate cancer. It could also be used in validating the translation of novel FAS inhibitors, as anticancer agents, into the clinical setting.
MATERIALS AND METHODS
General
All chemicals, unless otherwise stated, were purchased from Sigma-Aldrich Chemical Co., Inc. Radioactive samples were counted in a radioisotope calibrator (Capintec, Inc.) for determination of megabecquerels (millicuries) and an automated well scintillation 8000 γ-counter (Beckman Coulter) for counts per minute. Centrifugation was performed on a Sorvall Superspeed RC-6 Centrifuge (Sorvall, Inc.) refrigerated to 4°C. Male athymic nu/nu mice (<20 g; 5- to 6-wk-old) were purchased from the National Cancer Institute. Human prostate carcinoma tumor cell lines PC-3 (androgen receptor negative), LNCaP (androgen responsive), and 22Rv1 (androgen resistant) were obtained from the American Type Culture Collection and maintained by serial passage in cell culture. Both LAPC-4 (androgen responsive) (Dr. Charles Sawyer at UCLA) and CWR22 (androgen responsive) (Bristol Myers Squibb) tumors were implanted and maintained by animal-to-animal passage. 11C-Labeled acetate was prepared by the reaction of 11C-labeled carbon dioxide with a Grignard reagent as described previously (28). Radiochemical purity was always ≥99%.
In Vitro Cell Uptake and Inhibition
PC-3, LNCaP, and 22Rv1 prostate cells were plated in 6-well plates (4.5 × 10⁵, 9 × 10⁵, and 1.2 × 10⁶ cells per well, respectively) 24 h before the study was initiated. The cells were grown to ∼75% confluence at 37°C and 5% CO2 in appropriate medium and supplemented with 10% heat-inactivated fetal bovine serum. Eighteen hours before the uptake experiment, C75 (63.5 μg), a FAS inhibitor (29), was added to the growth media (5 mL) in each well in a small amount of dimethyl sulfoxide (DMSO) (10 μL) so that the final concentration in each well was 50 μM (controls received DMSO alone). To initiate the study, the culture medium was removed, and cells were rinsed with phosphate-buffered saline (PBS). Approximately 0.37 MBq (10 μCi) of 1-11C-acetate were added to the cells in 1.0 mL fresh media to initiate tracer uptake (including C75 or DMSO alone to maintain inhibitor concentration). Incubation was terminated at various times (15, 30, or 60 min) by removing the radioactive culture medium. Cell monolayers were washed with 2 mL of cold PBS 3 times to remove any excess culture medium from the extracellular spaces. Lysis of the cells was achieved by addition of 1 mL of 0.25% sodium dodecyl sulfate (SDS). Lysis extracts, as well as 1 mL of radioactive culture medium as a standard, were counted in a γ-counter and measured for protein content using a standard copper reduction/bicinchoninic acid assay (BCA; Pierce Biotechnology), with bovine serum albumin as the protein standard. Cellular uptake data for all experiments were normalized for the amount of protein present and calculated as the percentage uptake (cell-associated). A further inhibition study was performed with 5-(tetradecyloxy)-2-furoic acid (TOFA), a potent inhibitor of acetyl-CoA carboxylase (ACC), a key enzyme involved in fatty acid biosynthesis (30). Procedures were similar to those stated earlier, with the final concentration of TOFA being 30 μM and the pretreatment occurring 2 h before addition of 1-11C-acetate. The tracer was added directly to the 5 mL of growth media, rather than changing the media, to ensure continued presence of the pretreatment concentration of TOFA.
To compare the abilities of C75 and TOFA to inhibit fatty acid synthesis, PC-3 cells were seeded in 24-well plates at 1 × 10⁵ cells per well. After 48 h the cells were treated with either C75 (0, 10, 20, 30, or 60 μM) to inhibit FAS or TOFA (0, 10, 20, or 30 μM) to inhibit ACC for 2 h, and then 2-14C-acetate (0.037 MBq; 1 μCi) was added for an additional 2 h. An additional study was performed using both PC-3 and LNCaP cells, where cells were seeded in 24-well plates at 1 × 10⁵ cells per well. After 48 h the cells were treated with either C75 (30 μM) to inhibit FAS or TOFA (30 μM) to inhibit ACC for 2 h, and then 2-14C-acetate (0.037 MBq; 1 μCi) was added for an additional 2 h. Control cells received DMSO (0.1%) only. After the labeling period, the cells were collected and washed and lipids were extracted and quantified by scintillation counting as described previously (31,32).
To observe the contribution of the tricarboxylic acid (TCA) cycle to 1-11C-acetate cellular uptake, an inhibition study with 3-nitroprionic acid, a known inhibitor of succinate dehydrogenase in the TCA cycle, was performed. PC-3 cells, plated in 6-well plates 24 h before uptake, were treated with 100 μM 3-nitropropionic acid 2 h before radiotracer uptake, whereas control cells received vehicle alone. 1-11C-Acetate (1.11 MBq; 30 μCi) was added to the wells; this was followed by a 25-min incubation. Cells were then washed and collected by trypsin/ethylenediaminetetraacetic acid (EDTA) for counting in the γ-counter and subsequent protein assay for normalization.
Small-Animal PET
All animal experiments were performed in compliance with the Guidelines for the Care and Use of Research Animals established by Washington University's Animal Studies Committee. Single-position, whole-body imaging was performed using small-animal PET (microPET Focus 120 or Focus 220; Siemens Medical Solutions, Inc.) (33). Mice were imaged individually or in pairs in a supine position in a specially designed bed. Isoflurane (1%–2%) was used as an inhaled anesthetic to induce and maintain anesthesia during imaging. The bed was placed near the center of the field of view of the PET scanner, where the highest image resolution and sensitivity are available. Imaging was performed, 20-min after injection, with a single 10-min static scan. Images were reconstructed by Fourier rebinning, which was followed by 2-dimensional ordered-subset expectation maximization (OSEM) (34).
PET images were evaluated by analysis of the standardized uptake value (SUV) of the tumor and nontarget organ (muscle) using ASIPRO software (Siemens Medical Solutions, Inc.). The average radioactivity concentration within the tumor or tissue was obtained from the average pixel values reported in nanocuries per milliliter within a volume of interest drawn around the entire tumor or tissue on multiple, consecutive transaxial image slices. SUVs were calculated by dividing this value, the decay-corrected activity per unit volume of tissue (nCi/mL), by the injected activity per unit of body weight (nCi/g). Necrotic tissue was excluded by analysis of the images in comparison with serial slices through the tumor postmortem. Any necrosis in a tumor was noted, and those sections (which also had no uptake) were not included in the overall SUV calculation.
An animal imaging study was performed on 22Rv1, PC-3, CWR22, and LAPC-4 tumor-bearing mice to confirm correlation of uptake of 1-11C-acetate with FAS expression in tumors. Two prostatic carcinoma tumor models were prepared in culture (22Rv1 and PC-3) and then harvested for implant by trypsin/EDTA and injected in a volume of 100 μL into the right flank of intact, male nu/nu mice (15–20 g) in the appropriate media at a given concentration (5 × 10⁶ cells in Matrigel [BD Biosciences] for 22Rv1 and 3 × 10⁶ cells in Kaighn's modification of Ham's F12 medium for PC-3). CWR22 and LAPC-4 tumors were obtained from animal-to-animal passage. Tumors were allowed to grow until palpable, and the time varied by model. PET was performed 20 min after intravenous injection of 14.8–18.5 MBq (400–500 μCi) 1-11C-acetate (100 μL) via the tail vein. The 20-min time point after injection was chosen on the basis of the experience of other researchers (13,14,16). After imaging, the mice were euthanized, and the tumors were excised and flash frozen to −80°C for subsequent Western blot analysis to determine FAS expression. Images were analyzed for determination of SUV and compared with the Western blots.
Western Blots
Frozen tumors were thawed over ice and homogenized, and the cells were lyzed with 1× cell lysis buffer (Cell Signaling Technology) for determination of protein concentration by BCA protein assay (Pierce). Twenty micrograms of protein of each sample were run using SDS-polyacrylamide gel electrophoresis with a 4%–20% Tris gradient gel. Standard Western blotting was performed with an anti-FAS primary antibody (rabbit; Novus Biologicals) and a goat antirabbit secondary antibody (DyLight 647; Pierce Biotechnology). Final detection was achieved by using the enhanced chemiluminescence system (Amersham Life Sciences) according to the manufacturer's instructions. Prestained standards (Kaleidoscope Prestained Standards 161-0324; Bio-Rad Laboratories) were used on each Western blot for reference. Blots were traced, and intensity and area values were obtained for each band by densitometry using Image J software (National Institutes of Health) to quantify expression.
PET of FAS Inhibition
Male, nu/nu mice were injected with either PC-3 (3 × 10⁶ cells/100 μL) (n = 3) or LNCaP (1 × 10⁷ cells/100 μL) (n = 4) tumor cells subcutaneously in the right flank, which were allowed to grow until palpable. PET was performed 20 min after intravenous injection of 3.7–7.4 MBq (100–200 μCi) 1-11C-acetate (100 μL), which was followed by a low-resolution CT scan for subsequent coregistration and anatomic reference. After imaging, all mice received an intraperitoneal injection of C75 at 30 mg/kg dissolved in DMSO/RPMI 1640 media (<2% DMSO). Eighteen hours after treatment, the mice were imaged again following the same protocol. After imaging, the mice were euthanized, and the tumors were excised and formalin-fixed for staining and immunohistochemical analysis.
Immunohistochemistry
After PET, to observe inhibition of 1-11C-acetate uptake in prostate tumors by blocking of FAS, immunohistochemical techniques were used to demonstrate the extent of protein expression. Tumors from the in vivo inhibition study were formalin-fixed, paraffin-embedded, sliced, and placed on slides for immunohistochemical analysis by the Histology Core at Washington University; 1 slide per section was also stained with hemotoxylin and eosin (H&E) to confirm tissue viability. Slides were baked for 30 min at 60°C and then soaked in xylene, 2 times for 3 min each, hydrated in 2 soaks of 100% ethanol for 2 min each, and soaked 2 times with 95% ethanol for 2 min each, 2 times with 70% ethanol for 2 min each, and 1 time with 50% ethanol for 2 min. Slides were then rinsed in doubly distilled water and placed in 3 washes of PBS before blocking with a protein block (Dako) in a humidified chamber for 30 min at room temperature. After aspiration of the blocking solution, the slides were incubated with the FAS primary antibody (1:1,000; anti-FASN [M] antibody 34-6E7; FASGen, Inc.) overnight in a humidified chamber at 4°C and then rinsed again with PBS. The slides were then incubated with secondary goat antimouse antibody labeled with biotin (1:200; ImmunoPure GAM IgG; Pierce) for 30 min and rinsed with PBS, which was followed by incubation for 30 min with ABC Vector Elite (Vector Laboratories) solution diluted in 0.5 M NaCl. The slides were rinsed 3 times in 0.1 M Tris buffer, pH 7.4, and then incubated in 3,3′-diaminobenzidine (DAB) and chromogen (DAB+ Kit; Dako) for 10 min. After repeated rinsing with tap water, the slides were counterstained with Meyer's hematoxylin for 40 s and washed with tap water. The slides were dipped 10 times in Bluing Reagent (YWR International) before they were dehydrated and cover-slipped using Permount (Fisher Scientific). The slides were observed and compared (10×) with the H&E-stained slides under a Nikon Eclipse E600W microscope fitted with a Nikon DXM1200F digital camera. As a result of the protocol, FAS protein should appear brown in color.
Statistical Analysis
Statistically significant differences between mean values were determined using ANOVA coupled to the Scheffé test or, for statistical classification, a Student t test was performed.
RESULTS
Inhibition of Fatty Acid Synthesis Reduces 1-11C-Acetate In Vitro Uptake
To confirm the hypothesis that 1-11C-acetate uptake in tumors is related FAS expression, an in vitro blocking study was performed. Cells were pretreated for 18 h with C75, a known inhibitor of FAS, before uptake of 1-11C-acetate to determine if uptake could be blocked. All cells showed a linear increase in uptake over time in both the C75-treated and the control tumor cells. In all cases, the uptake in the control cells was consistently higher throughout the duration of the study. By 30 min, the C75-treated cells showed inhibition of uptake by 26.4% (P = 0.0005) in the PC-3 cell line and by 16.7% (P = 0.0010) and 26.9% (P = 0.0007) for the LNCaP and 22Rv1 cell lines, respectively (Fig. 1A). Cell viability was measured by trypan blue staining. An average of 95% viability was measured for each cell line, with no decrease in overall cell number due to the presence of C75 (data not shown).

(A) In vitro cell association of 1-11C-acetate at 30 min in PC-3, LNCaP, or 22Rv1 prostate cancer cells with and without 18-h prior treatment with C75, a FAS inhibitor. (*P = 0.001; **P = 0.0007; ***P = 0.0005). (B) In vitro cell association of 1-11C-acetate at 30 min in PC-3, LNCaP, or 22Rv1 prostate cancer cells with and without 2-h prior treatment with TOFA, an ACC inhibitor to block the fatty acid synthesis pathway. (*P = 0.0025; **P = 0.0008; ***P = 0.0001). Data are expressed as mean ± SD.
The role of ACC in 1-11C-acetate uptake was also determined by treating cells with TOFA, a potent inhibitor of ACC. ACC is the rate-limiting enzyme in the fatty acid synthesis pathway. After pretreatment with TOFA, cell uptake of 1-11C-acetate was significantly reduced, more than with C75 (Fig. 1B). The percentage of blocking increased over time in all cases, with values of 29.8% ± 5.75%, 67.4% ± 9.22%, and 34.7% ± 9.31% for PC-3, LNCaP, and 22Rv1 cell lines, respectively, at 30 min. To demonstrate that TOFA is a more potent inhibitor of fatty acid synthesis than C75, a dose−response comparison between TOFA and C75 in PC-3 cells was performed (Fig. 2A and 2B). It is evident that even at concentrations of 10 μM, TOFA has a significantly more pronounced effect on fatty acid synthesis than C75 (10 μM: 10.7% ± 0.59% vs. 84.9% ± 2.47%). An additional one-point study comparing PC-3 cells with LNCaP cells was undertaken to show that this relationship was observed in more than 1 cell line. It was shown that 30 μM C75 inhibited about 30% of fatty acid activity in both PC-3 and LNCaP cells, whereas TOFA inhibited fatty acid synthesis about 75%–80% (both after a 2-h treatment) (Fig. 2C). These data demonstrate that 1-11C-acetate uptake is directly related to the degree of FAS inhibition in prostate tumor cell lines.
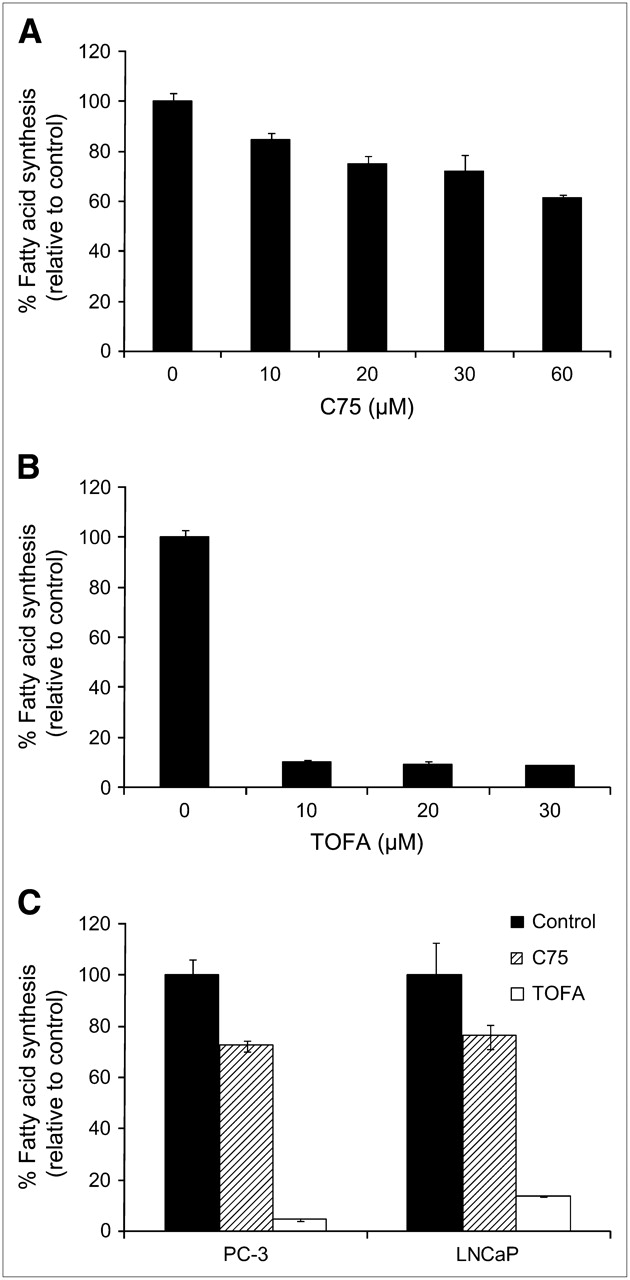
Dose–response comparison of relative effects of C75 (A) and TOFA (B) on fatty acid synthesis in PC-3 cells, performed with 14C-acetate. (C) Comparison of fatty acid synthesis inhibition with 30 μM C75 or TOFA in PC-3 and LNCaP cells. Data are expressed as mean ± SD.
PET Demonstrates In Vivo Correlation Between 1-11C-Acetate Uptake and FAS Expression
To test the hypothesis that 1-11C-acetate may be imaging FAS expression in vivo, an imaging study was performed, with excision of the tumors after imaging for further analysis of FAS levels by Western blot. 1-11C-Acetate PET of 4 prostate tumor models (PC-3, 22Rv1, CWR22, and LAPC-4) was performed (Figs. 3A–3C). Regions of interest were drawn on the images around the tumors, excluding any necrotic tissue. SUVs at 20 min after injection were calculated to normalize these values (nCi/mL) to the injected activity per animal (nCi) as well as body mass (g). Imaging SUVs were 0.11 ± 0.01 for LAPC-4 (n = 2), 0.26 ± 0.06 for CWR-22 (n = 2), and 0.18 ± 0.02 for 22Rv1 (n = 3). In this case, the PC-3 tumors (n = 2) could not be delineated from the surrounding tissue and, therefore, no SUVs were calculated. Visual inspection of the Western blot results revealed obvious differences in the intensity of the band near 250 kDa (FAS = 267 kDa), with PC-3 showing the lowest levels of expression, 22Rv1 and LAPC-4 with significantly more intensity than PC-3, and CWR22 being the highest of those examined (Fig. 3D). Densitometry analysis confirmed this trend quantitatively. The relative values of expression were averaged for each tumor type, resulting in 2,354.1 ± 22.8, 9,640.9 ± 2,552.3, 11,160 ± 25.0, and 15,798 ± 4,057.6 for PC-3, LAPC-4, 22Rv1, and CWR22, respectively. Comparison of the average SUVs from the PET data with Western blot analysis of the homogenized tumor tissue resulted in a correlation (R2 = 0.974) between tumor uptake of 1-11C-acetate and FAS expression (Fig. 3E).
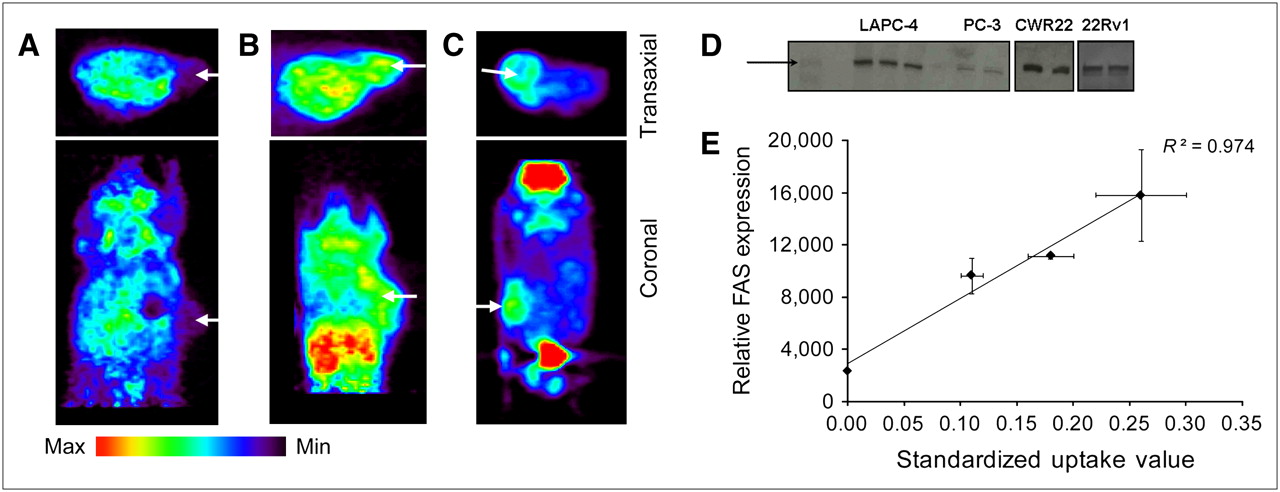
Representative transaxial and coronal PET image slices of LAPC-4 (A), CWR22 (B), and 22Rv1 (C) tumor-bearing mice at 20 min after intravenous injection of 14.8–18.5 MBq (400–500 μCi) 1-11C-acetate. Arrows mark tumor location. PC-3 tumors were not visualized. (D) Western blot of tumor lysates shows qualitative levels of FAS expression. Visual inspection of Western blot results revealed obvious differences in intensity of the band near 250 kDa (standard band denoted by black arrow; FAS = 267 kDa), with PC-3 showing relatively nonexistent bands, 22Rv1 and LAPC-4 with significantly more intensity, and CWR22 being the highest of those examined. Multiplication of the area of the band by its intensity (after subtraction of background intensity) gave a relative value of expression for the sample analyzed. (E) SUVs of 1-11C-acetate uptake in prostate tumor models vs. relative FAS expression (by Western blot) of these samples show a direct correlation (R2 = 0.974). Data are expressed as mean ± SD.
Small-Animal PET of FAS Inhibition (C75 Blocks 1-11C-Acetate Uptake In Vivo)
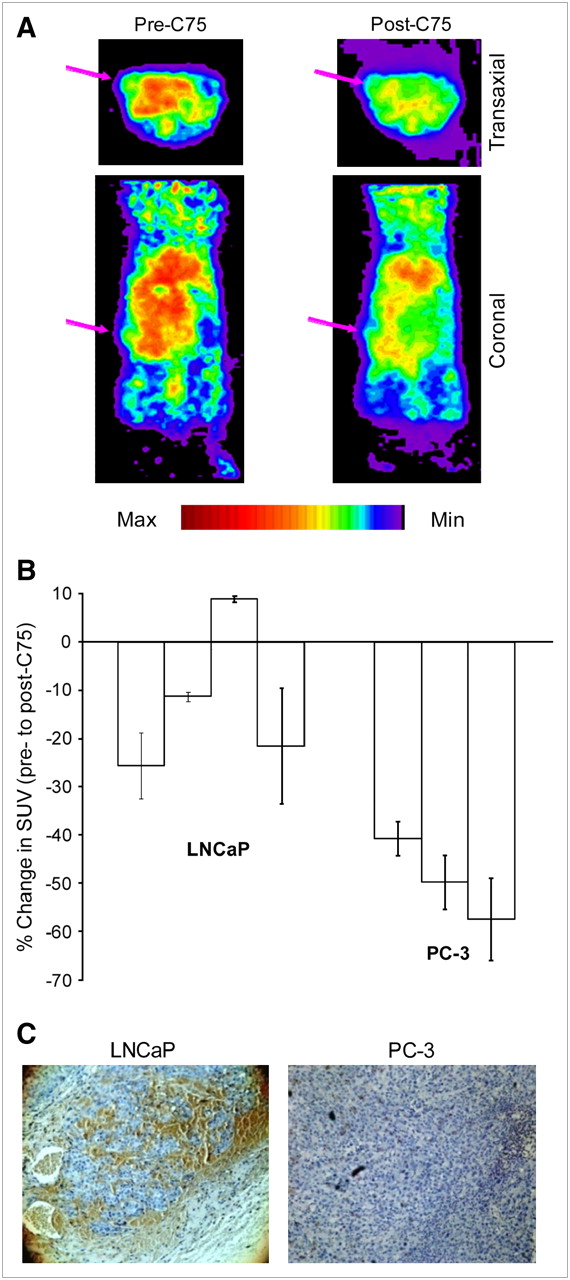
Because the in vitro results confirmed that 1-11C-acetate uptake could be diminished by inhibition of FAS, a similar study was pursued in vivo. PC-3 (as the low-expressing control) and LNCaP tumor-bearing mice were imaged with 1-11C-acetate before and after treatment with C75, so that each mouse would serve as its own control (Fig. 4A). In 6 of the 7 image sets analyzed, tumor uptake of 1-11C-acetate decreased after a single treatment with C75. LNCaP tumors showed an average decrease in uptake of 12.3%, with PC-3 SUVs reduced by an average of 49.4% (Fig. 4B). The reasoning for the significant difference in the effect of FAS inhibition on acetate uptake (P = 0.013) between the 2 tumor types was explored by immunohistochemical analysis of FAS expression (Fig. 4C). Visual inspection of the FAS-stained slides clearly demonstrated a much higher abundance of the protein in the LNCaP tumors compared with that of PC-3 in all cases. H&E stains of all tumor slides confirmed viability of the tissue. The brown staining also colocalized in the same areas as the hemotoxylin stain on subsequent slides, indicating protein-rich portions (data not shown).

(A) Representative image slices of an LNCaP tumor-bearing mouse after intravenous injection of 3.7–7.4 MBq (100–200 μCi) 1-11C-acetate. Arrows mark tumor location. (B) Overall change in SUV in solid PC-3 and LNCaP tumors in mice pre- and posttreated with C75. Data are expressed as mean ± SD. (C) Representative immunohistochemical staining of harvested prostate tumors for FAS (brown), showing a strong reactivity in LNCaP. Whereas PC-3 has almost none (10× magnification). Three slices per tumor were analyzed.
DISCUSSION
1-11C-Acetate was first examined as a possible tracer for malignancies by Shreve et al. in 1995 (35) and has since been extensively investigated in prostate cancer and its metastases (12–16). Direct comparisons by researchers have shown greater sensitivity for detection over the standard use of 18F-FDG (4,13). Most recent work has demonstrated 1-11C-acetate as a useful tool for detecting recurrent disease at PSA relapse in many cases (12,14,15,36) and even better results when paired with CT and MRI for anatomic reference and observation of structural changes (16). Despite these findings, no definitive explanation for increased uptake has been made.
Acetate can be metabolized by several distinct pathways in cells. Of course, acetate can be metabolized through the TCA cycle. In tumor cells, acetate can also be used as a substrate or a substrate precursor during fatty acid synthesis. Acetate is a precursor for acetyl-CoA, which can then be converted to malonyl-CoA by ACC. Acetyl-CoA and malonyl-CoA also provide substrate for fatty acid elongation in the mitochondria and endoplasmic reticulum, respectively. In addition, acetate is a precursor for cholesterol synthesis. As a result, 1-11C-acetate incorporation could be affected by multiple pathways. Considering that FAS and the fatty acid synthesis pathway are highly expressed and active in multiple cancers—prostate cancer, in particular—this pathway could be a major determinant of 1-11C-acetate uptake in prostate tumors.
Researchers have postulated that increased acetate uptake in malignancies may be due to increased lipid biosynthesis. Accordingly, one study recently observed the uptake and metabolism of 14C-acetate into 4 nonprostate tumor cell lines (LS174T, human colon adenocarcinoma; RPMI2650, human nasal septum tumor; A2780, human ovary carcinoma; and A375, human malignant melanoma) and 1 fibroblast model (37). The authors demonstrated that all malignant lines examined had significantly higher uptake over the fibroblasts and that the acetate incorporated into the lipid-soluble fractions, and primarily phosphatidylcholine (PC). Interestingly, Swinnen et al. have demonstrated that FAS-derived palmitate primarily partitions to detergent-insoluble lipid fractions in which PC is the primary constituent (38). Similarly, uptake of 2-14C-acetate has also been measured in CWR22 and PC-3 tumors in castrated and noncastrated mice (39). The authors found that acetate uptake correlated with androgen receptor expression, suggesting that acetate uptake can be affected by androgen. FAS has been shown to be overexpressed in prostate cancer (18–22); however, specific examination of FAS levels in correlation with 1-11C-acetate uptake by PET have yet to be reported. Because high levels of FAS expression have also been found to be an indicator of a poor prognosis in patients with prostate cancer, resulting in a 4.45-fold higher risk of death (40), we hypothesized that a noninvasive imaging method such as 1-11C-acetate PET for the determination of FAS in tumors could provide clinicians with an additional tool for individualized therapy.
In this current study, pharmacologic inhibition of the FAS pathway was used to demonstrate the specificity of 1-11C-acetate for imaging FAS expression by blocking the protein. C75-treated cells showed a significant decrease in cellular accumulation of 1-11C-acetate compared with that of controls but still showed an appreciable amount of cellular uptake (Fig. 1A). It is likely that either all of the FAS was not blocked or other described pathways are also involved. Inhibition of fatty acid synthesis with TOFA, a pharmacologic inhibitor of ACC—the rate-limiting enzyme involved in fatty acid biosynthesis—also had significant impact of the cellular accumulation of 1-11C-acetate (Fig. 1B). The demonstration that TOFA is a more efficient inhibitor of fatty acid synthesis than C75 (Fig. 2A–2C) correlates well with differences in 1-11C-acetate uptake. Furthermore, because blockade of the 2 key enzymes involved in fatty acid synthesis affected acetate uptake, our data demonstrate that a large portion of 1-11C-acetate tumor uptake and retention is related to the fatty acid synthesis pathway.
Demonstrating that in vivo uptake of 1-11C-acetate in 4 prostate tumor models correlated with FAS levels (Fig. 3), it is evident that FAS is at least involved in 1-11C-acetate uptake in vivo—to our knowledge, the first time this relationship has been demonstrated. After showing that 1-11C-acetate cellular uptake can be diminished with FAS inhibition in vitro and that uptake correlates to FAS expression levels in vivo, we performed a FAS-blocking study in vivo with C75 (Fig. 4). With each mouse serving as its own control, specific changes in overall tumor uptake were calculated and showed a small average change in the LNCaP mice (∼12%) and a larger effect in the PC-3 model (∼49%). LNCaP has a higher expression of FAS (Fig. 4C); therefore, the amount of C75 given is likely to show less of an effect than in PC-3 mice, where its lower expression of FAS would result in a more extreme response with the same amount of C75.
Inhibition of FAS with C75, orlistat, triclosan, and many other compounds has led to promising in vitro and in vivo results confirming FAS as a viable target for cancer therapies (41,42). Although FAS represents an important therapeutic target, there has been no in vivo demonstration that FAS inhibitors significantly block fatty acid synthesis in tumors. One study with 18F-FDG to monitor the effects of C75 on tumor glucose metabolism in a rodent model of human A549 lung cancer was reported recently (26). A transient, reversible decrease in glucose metabolism and tumor metabolic volume was noted after C75 treatment, with the peak effect seen at 4 h. This, however, was an indirect measure of fatty acid synthesis, whereas the use 1-11C-acetate shows a direct measurement. The data presented herein provide validation for further development of 1-11C-acetate PET, as a measure of fatty acid synthesis, and incorporation of the technology into preclinical in vivo models and clinical studies. Such information could provide important validation of the efficacy of FAS inhibitors and represents a unique tool in aiding the translation of new FAS inhibitors for the treatment of cancer into the clinical setting.
As mentioned earlier, acetate may also be metabolized by other pathways. The TCA cycle is a major factor in acetate metabolism throughout the body, and its presence in the cells needs to be considered. In one experiment, 3-nitropropionic acid (a known inhibitor of the TCA cycle) was added during cell uptake and showed a 14.3% ± 3.7% reduction of 1-11C-acetate uptake in the PC-3 model (data not shown). It has been shown that small interfering RNA (siRNA)-mediated knockdown of FAS in MDA-MB-435 mammary carcinoma cells can also affect expression of genes related to the TCA cycle and glycolysis and may also influence acetate metabolism indirectly (43). This supports, in part, the idea that TCA could be a major contributor to the retention of 1-11C-acetate and is regulated by the fatty acid synthesis pathway. Given the role of cholesterol in prostate cancer (44), and that in some cell lines increased fatty acid synthesis has been shown to be accompanied by an increase in cholesterol synthesis (45), further studies on the ability of the cholesterol synthesis pathway to regulate PET of 1-11C-acetate uptake in prostate cancer may also be warranted. On the other hand, the data presented herein clearly identify FAS and the fatty acid synthesis pathway as an important determinant of 1-11C-acetate uptake in PET of prostate cancer.
CONCLUSION
These findings are promising in that they suggest a possible biomarker for more-effective treatments in prostate cancer patients, and possibly others, as FAS expression has shown links to poor prognosis in other cancers as well. Moreover, because FAS inhibitors are being developed as antitumor agents, this technology also provides a unique opportunity to monitor the effectiveness and the validation of new FAS inhibitors for translation into a clinical setting.
Acknowledgments
The authors thank Amanda Roth, Nicole Fettig, Margaret Morris, Lori Strong, and Susan Adams for technical support; the cyclotron facility staff for radiopharmaceutical production; and Drs. Nobuyuki Oyama and Gordon Parry for their helpful discussions. We are grateful for financial support from the U.S. Department of Defense (grant PC 040435), the National Institutes of Health (grant F32 CA110422-03), and the National Cancer Institute (grant CA 114104).
Footnotes
-
COPYRIGHT © 2008 by the Society of Nuclear Medicine, Inc.
References
- Received for publication August 23, 2007.
- Accepted for publication October 31, 2007.


Jump to section
Related Articles
Cited By...
- Metabolic Phenotypes, Dependencies, and Adaptation in Lung Cancer
- 68Ga-PSMA-PET/CT Has a Role in Detecting Prostate Cancer Lesions in Patients with Recurrent Disease
- Harnessing Preclinical Molecular Imaging to Inform Advances in Personalized Cancer Medicine
- 11C-Acetate-PET/CT Compared to 99mTc-HDP Bone Scintigraphy in Primary Staging of High-risk Prostate Cancer
- Evaluation of Prostate Cancer with 11C-Acetate PET/CT
- Metabolic Plasticity as a Determinant of Tumor Growth and Metastasis
- Lipid Catabolism via CPT1 as a Therapeutic Target for Prostate Cancer
- Late Imaging with [1-11C]Acetate Improves Detection of Tumor Fatty Acid Synthesis with PET
- A novel direct activator of AMPK inhibits prostate cancer growth by blocking lipogenesis
- Interrogating Tumor Metabolism and Tumor Microenvironments Using Molecular Positron Emission Tomography Imaging. Theranostic Approaches to Improve Therapeutics
- 11C-Acetate PET/CT Before Radical Prostatectomy: Nodal Staging and Treatment Failure Prediction
- 11C-Acetate PET/CT in Localized Prostate Cancer: A Study with MRI and Histopathologic Correlation
- Prostate Cancer: PET with 18F-FDG, 18F- or 11C-Acetate, and 18F- or 11C-Choline
- Functional Imaging of Localized Prostate Cancer Aggressiveness Using 11C-Acetate PET/CT and 1H-MR Spectroscopy
- Dominant Uptake of Fatty Acid over Glucose by Prostate Cells: A Potential New Diagnostic and Therapeutic Approach
- 2-18F-Fluoropropionic Acid as a PET Imaging Agent for Prostate Cancer
- The Importance of Acetyl Coenzyme A Synthetase for 11C-Acetate Uptake and Cell Survival in Hepatocellular Carcinoma
- Radiopharmaceuticals in Preclinical and Clinical Development for Monitoring of Therapy with PET
- Humanized Radioiodinated Minibody For Imaging of Prostate Stem Cell Antigen-Expressing Tumors
- Tumor Cell Metabolism Imaging