


Article Figures & Data
Figures
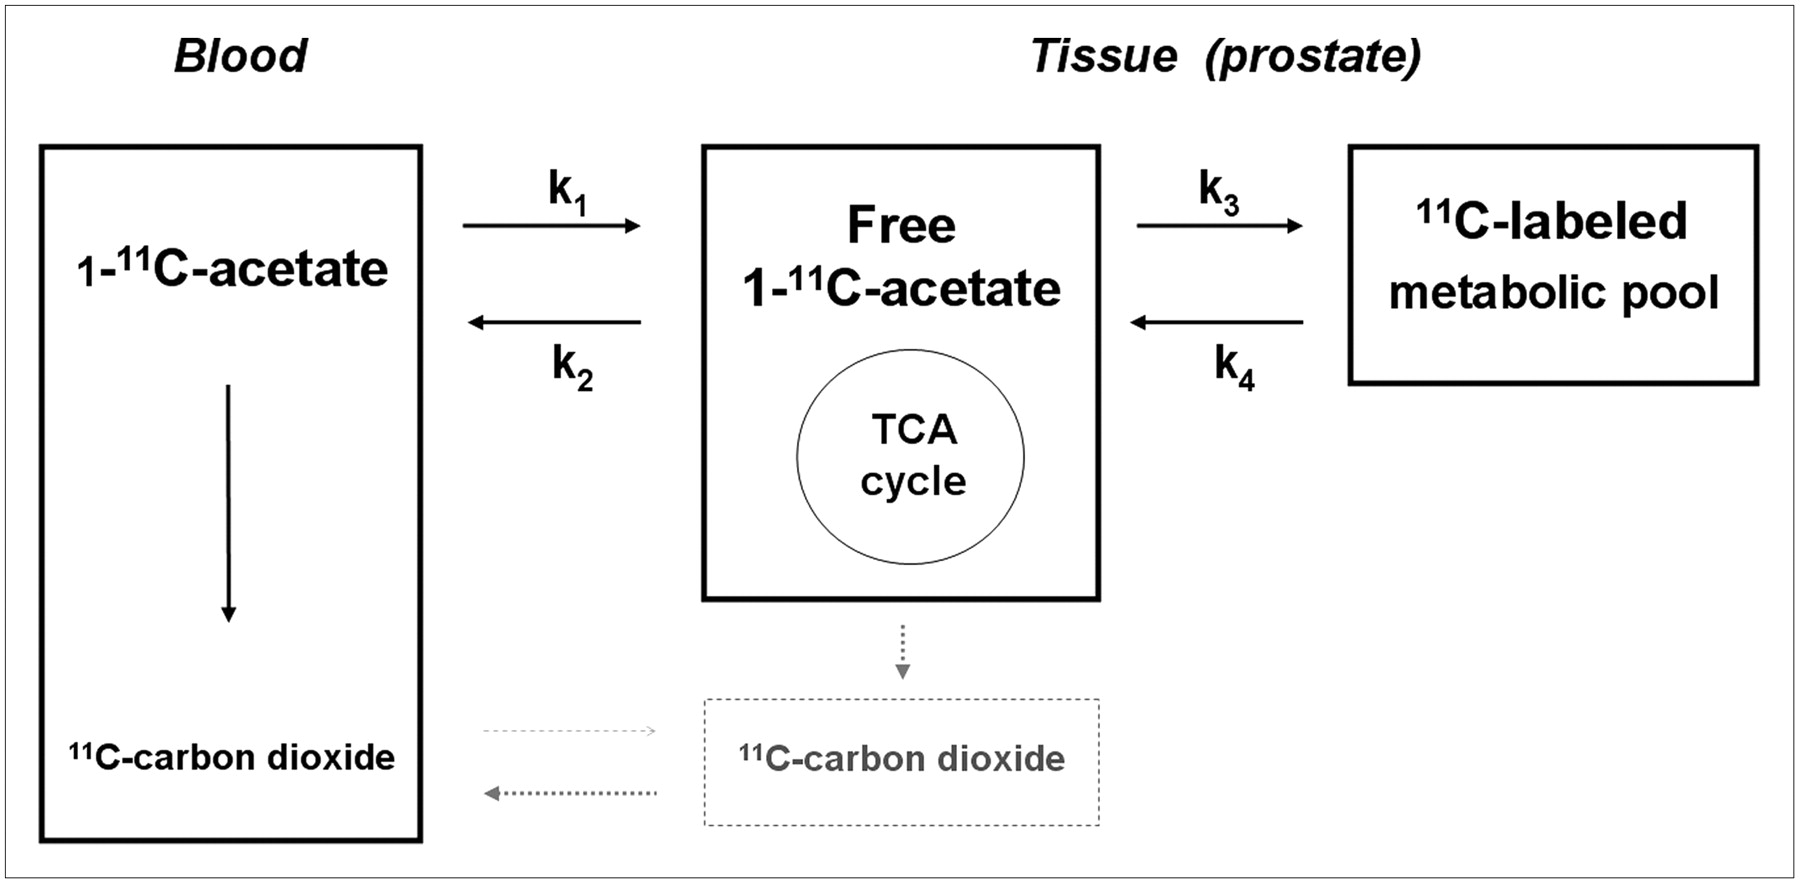
- FIGURE 1.
Kinetic model with 3 compartments and 2 tissues for prostate. CO2 concentration in tissue is low because of low intracellular pH. In our simplified model, intracellularly labeled CO2 (dotted gray box) is considered negligible. Blood-to-tissue transport is minimal as indicated by dotted gray arrow. Most of labeled CO2 is transported rapidly to blood (as part of k2). Metabolic pool consists of precursors for lipids, amino acids, fatty acids, and steroids that trap or retain 11C label. Labeled products of tricarboxylic acid (TCA) cycle also contribute to metabolic pool (as part of k3). Increase in TCA cycle metabolism would lead to increase of both k2 and k3.
- FIGURE 2.
Parametric images from 65-y-old man with primary prostate cancer. (A) Factor images representing vascular component; right and left iliac arteries are identified in 6 transverse planes. (B) Maximum-intensity-projection image of factor 1 in anterior–posterior view representing iliac arteries. (C) Transverse factor images representing tumor component. Note bilobular involvement. Arrow points to tracer in rectum. (D) Maximum-intensity-projection image of factor 2 in anterior–posterior view showing prostate. Note hot spot, left and superior of prostate, represents metastatic lymph node.
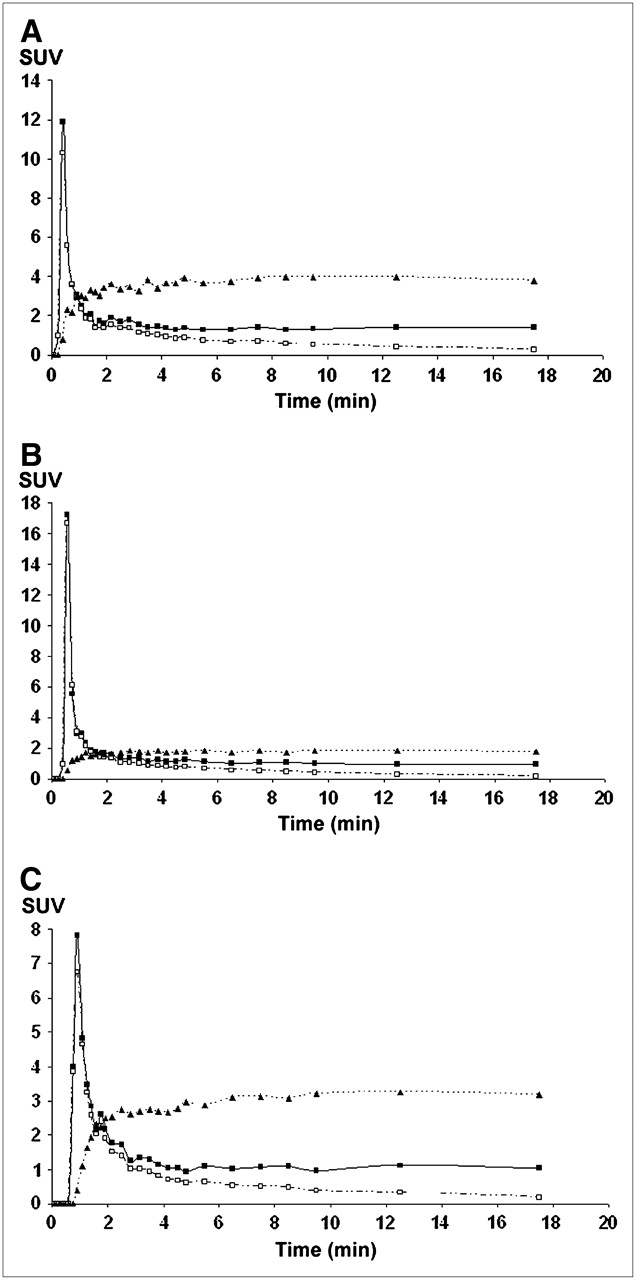
- FIGURE 3.
Time–activity-curves from iliac arteries (squares, solid line), metabolite-corrected input function (open squares, dashed line), and prostate tumor (triangles, dotted line). Uptake is expressed in SUV (standardized uptake value). (A) A 65-y-old man with primary prostate cancer (patient in Fig. 2). (B) A 57-y-old man with recurrent cancer; note lower SUV of tumor. (C) A 49-y-old volunteer with BPH.
- FIGURE 4.
Average values of kinetic parameters for 3 subgroups: primary and recurrent cancer as well as BPH. Error bar denotes 1 SD. Primary and recurrent prostate cancer show significant differences (*P < 0.01) for k1 and K (Table 2).
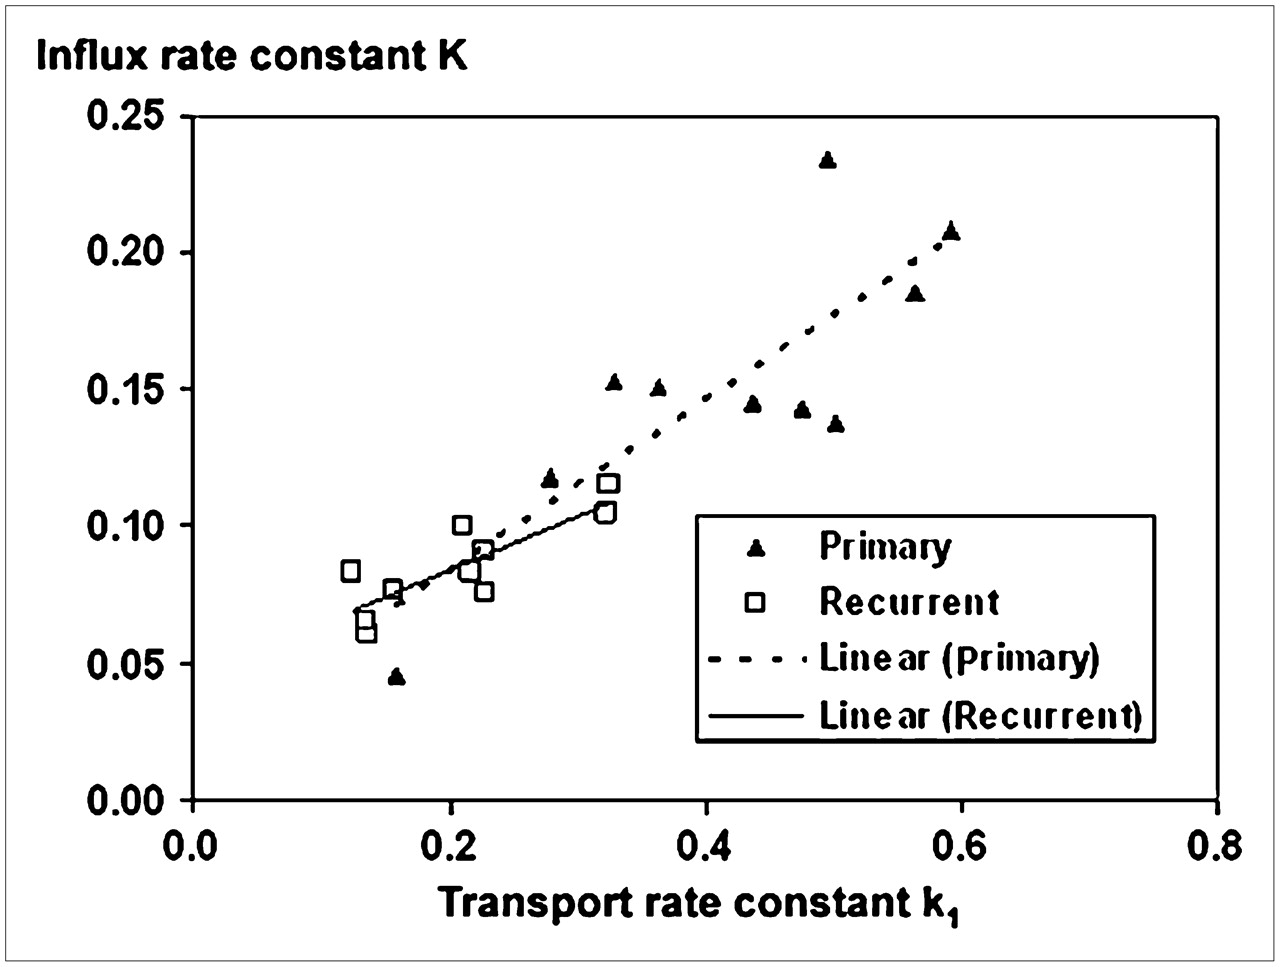
- FIGURE 5.
Scatter diagram of transport rate constant k1 vs. influx rate constant K, both in min−1. Triangles indicate primary cancer and open boxes indicate recurrent cancer. Lines are results of linear regression analysis, r = 0.82 (black) and r = 0.84 (gray). Slopes of linear fits are not statistically different.
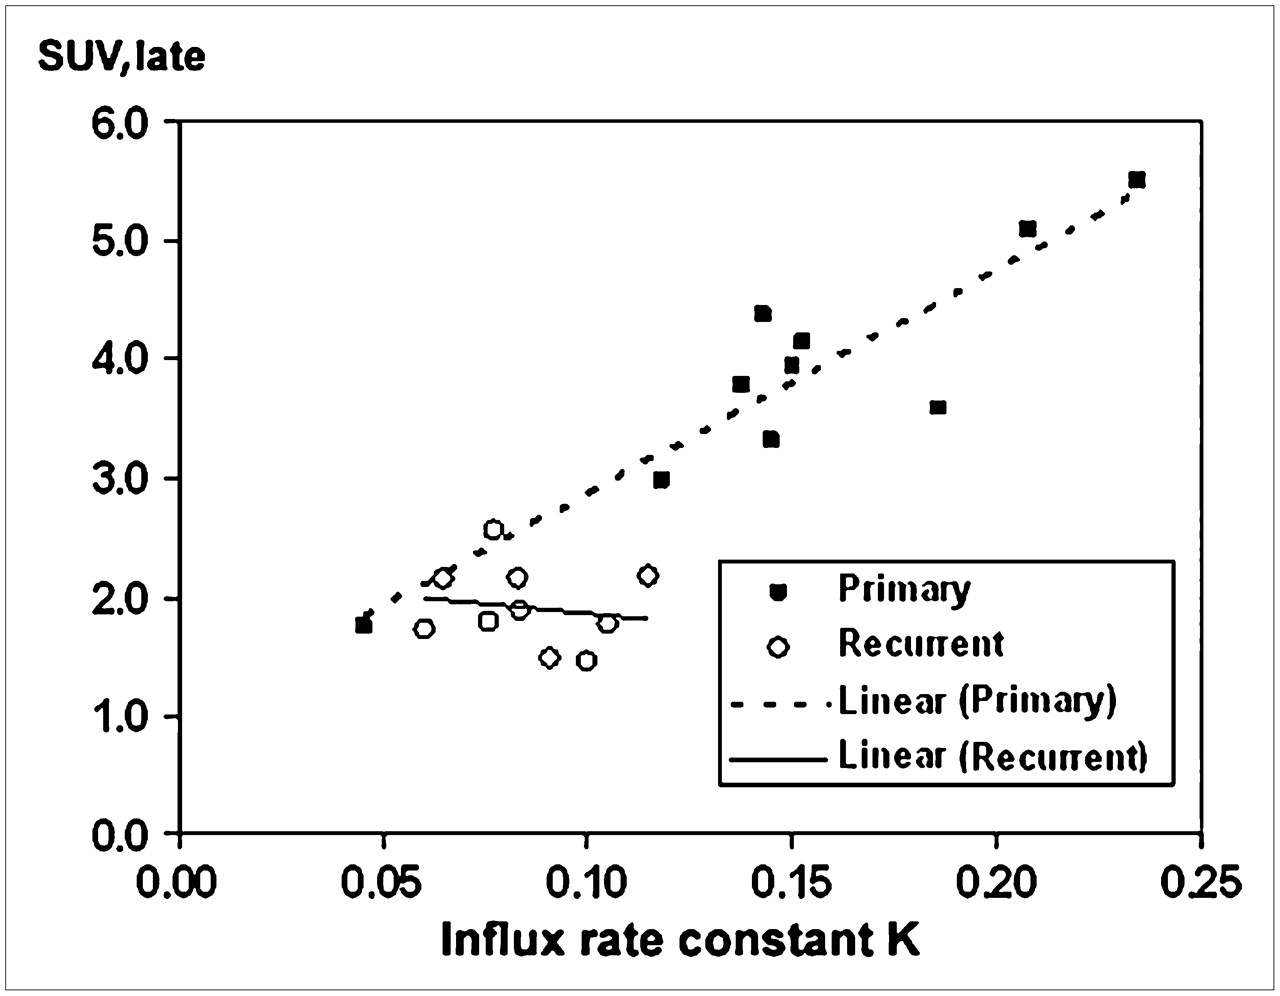
- FIGURE 6.
Scatter diagram of influx rate constant K in min−1 vs. 1-11C-acetate uptake in prostate (SUV). Black squares indicate primary cancer and open circles indicate recurrent cancer. Lines are results of linear regression analysis, r = 0.91 (squares) and r = −0.17 (circles).


Tables
Parameter 3C-5p 3C-5p 3C-4p 3C-4p 3C-3p 3C-3p 2C-3p 2C-3p Patlak-2p Patlak-2p Metabolite correction No Yes No Yes No Yes No Yes No Yes n 22 22 22 22 22 22 22 22 22 22 k1 0.289 ± 0.130 0.318 ± 0.145 0.301 ± 0.131 0.319 ± 0.142 0.295 ± 0.134 0.316 ± 0.145 0.289 ± 0.132 0.231 ± 0.099 k2 0.190 ± 0.051 0.184 ± 0.108 0.206 ± 0.054 0.216 ± 0.091 0.190 ± 0.047 0.202 ± 0.100 0.177 ± 0.046 0.048 ± 0.013 k3 0.006 ± 0.010 0.126 ± 0.078 0.012 ± 0.018 0.141 ± 0.046 0.005 ± 0.008 0.124 ± 0.046 k4 0.002 ± 0.002 0.008 ± 0.008 0.008 ± 0.017 0.006 ± 0.004 K 0.006 ± 0.010 0.124 ± 0.062 0.012 ± 0.013 0.124 ± 0.049 0.006 ± 0.008 0.118 ± 0.049 0.005 ± 0.011 0.109 ± 0.056 Vb 0.020 ± 0.020 0.024 ± 0.026 0.001 ± 0.003 0.000 ± 0.001 Vd 1.52 ± 0.63 1.50 ± 1.28 1.44 ± 0.67 0.96 ± 0.46 1.53 ± 0.59 1.08 ± 1.03 1.62 ± 0.60 4.87 ± 1.80 1.51 ± 0.61 1.57 ± 1.50 WRSS 397 ± 420 295 ± 278 439 ± 448 376 ± 368 491 ± 478 372 ± 386 491 ± 470 852 ± 722 NF 0 9 1 6 0 4 Reference M− Reference M+ AIC 71 ± 28 65 ± 26 72 ± 28 68 ± 28 74 ± 28 66 ± 28 75 ± 27 92 ± 24 2C, 3C = number of compartments; 2p, 3p, 4p, 5p = number of parameters in model. In model 3C-4p, Vb = 0 and in model 3C-3p both Vb and k4 are fixed to 0. NF = number of studies with a significantly lower error compared with corresponding 2C-3p (M− and M+—i.e., without and with metabolite correction as reference) determined with F test (P < 0.05). AIC (Akaike Information Criterion) is defined in Equation 3, and WRSS was used to calculate the likelihood function (35).
Estimates of fitted parameters k1–k4, as well as influx rate constant K, Vb, and Vd. Results are expressed as mean ± 1 SD of 22 studies (n) in 22 patients. Input function was corrected for partial-volume effects with 0.6 as recovery coefficient and for metabolites as indicated. Error estimate WRSS (Eq. 4) is a measure of “goodness of fit” between measured and calculated output function. Graphical analysis with Patlak plots was applied on images between 7 and 20 min.
- TABLE 2
Three-Compartment, 2-Tissue Model with 3 Parameter Estimates, k1–k3, Influx Rate Constant K, and Distribution Volume Vd
Type Primary Cancer Recurrent cancer P BPH n 10 10 2 k1 0.419 ± 0.136 0.208 ± 0.073 <0.001 0.339 ± 0.050 k2 0.218 ± 0.074 0.202 ± 0.124 NS 0.122 ± 0.066 k3 0.120 ± 0.026 0.140 ± 0.054 NS 0.066 ± 0.058 K 0.152 ± 0.051 0.086 ± 0.017 <0.01 0.110 ± 0.049 Vd 1.25 ± 0.32 0.69 ± 0.27 <0.001 2.19 ± 1.18 Patlak K 0.137 ± 0.062 0.079 ± 0.035 0.02 0.121 ± 0.048 Patlak Vd 1.95 ± 1.67 1.00 ± 1.27 NS 2.49 ± 1.22 SUV-early 3.80 ± 0.99 1.83 ± 0.40 <0.001 3.55 ± 0.60 SUV-late 3.84 ± 1.07 1.91 ± 0.34 <0.001 3.35 ± 0.24 NS = not significant.
Patlak plot results are given, as well. Results are expressed as mean ± 1 SD for 3 different tissue types. 1-11C-Acetate uptake at early (6–10 min) and late (15–20 min) time points is presented in SUVs. P denotes significance level by comparison of primary vs. recurrent cancers.
Supplemental Data
Files in this Data Supplement:


Jump to section
Related Articles
Cited By...
- Human Biodistribution and Radiation Dosimetry of 18F-Clofarabine, a PET Probe Targeting the Deoxyribonucleoside Salvage Pathway
- Evaluation of Prostate Cancer with 11C-Acetate PET/CT
- Late Imaging with [1-11C]Acetate Improves Detection of Tumor Fatty Acid Synthesis with PET
- Dynamic PET/CT with 11C-Acetate in Prostate Cancer
- Reply: Dynamic PET/CT with 11C-Acetate in Prostate Cancer
- 11C-Acetate PET/CT in Localized Prostate Cancer: A Study with MRI and Histopathologic Correlation
- Assessment of PET Tracer Uptake in Hormone-Independent and Hormone-Dependent Xenograft Prostate Cancer Mouse Models
- Kinetics of 3'-Deoxy-3'-18F-Fluorothymidine During Treatment Monitoring of Recurrent High-Grade Glioma
- Tumor Cell Metabolism Imaging