


Article Figures & Data
Figures
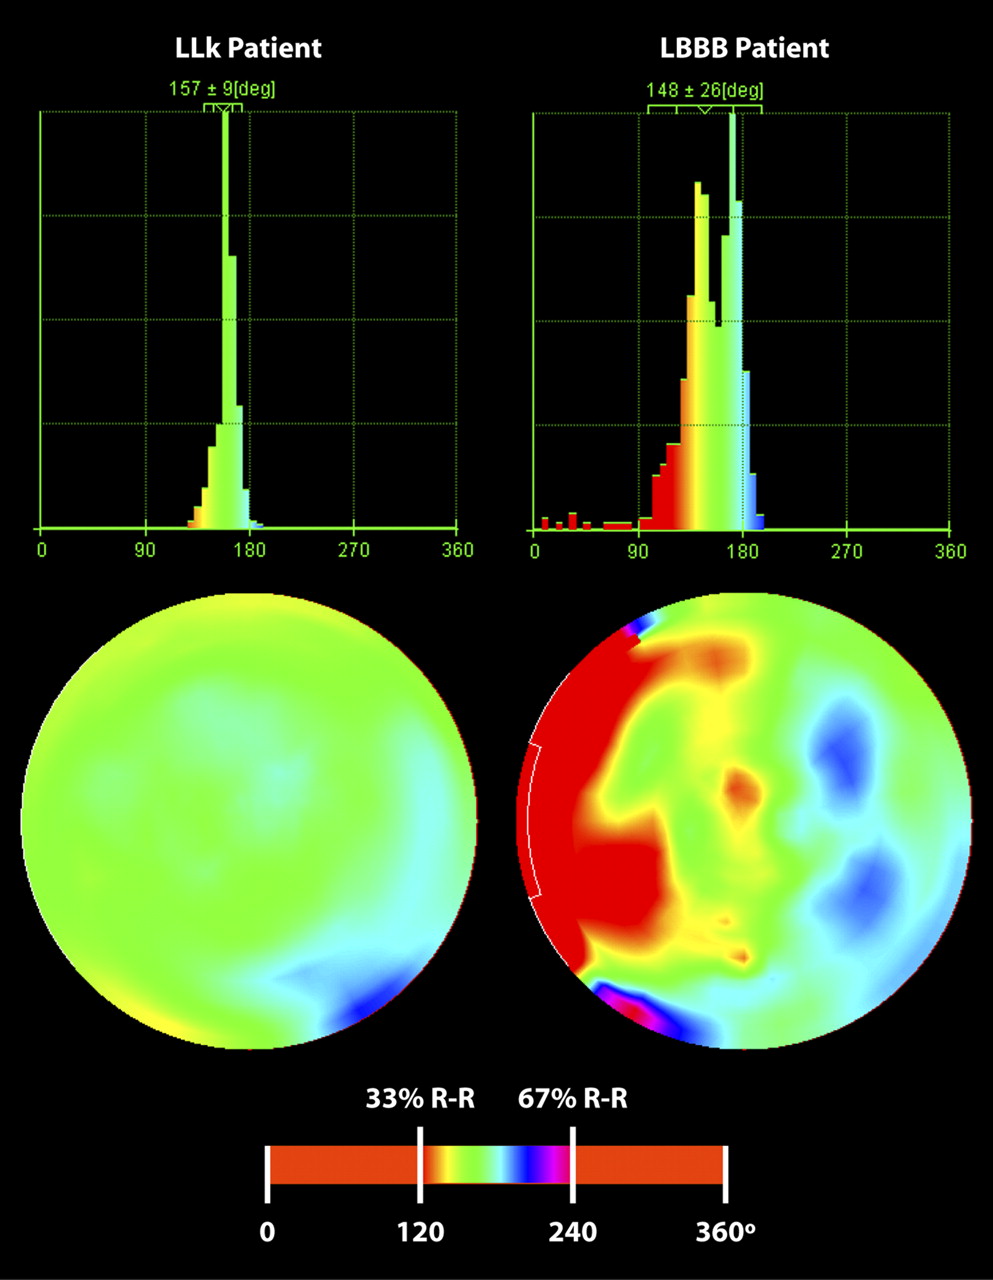
- FIGURE 1.
Comparison of global and regional thickening phase in individual patients from LLk and LBBB groups. Global histograms (top row) show overall increased dyssynchrony in patient with LBBB, and polar maps (middle) show uniform contraction for patient with LLk and clear septal-to-lateral contraction delay for patient with LBBB. Color scale used for both patients (bottom) has been adjusted to emphasize contraction timing differences in middle third of R-R cycle. deg = degrees.
- FIGURE 2.
Wall and segment definitions used for regional calculations. In wall model, differences between lateral (LAT) and septal (SEP) walls are used; anterior (ANT), inferior (INF), and apical (APX) regions of LV are not used in this analysis. In American Heart Association 17-segment model, lateral measurements are averaged from segments 11 and 12, and septal measurements are averaged from segments 8 and 9. AHA = American Heart Association.
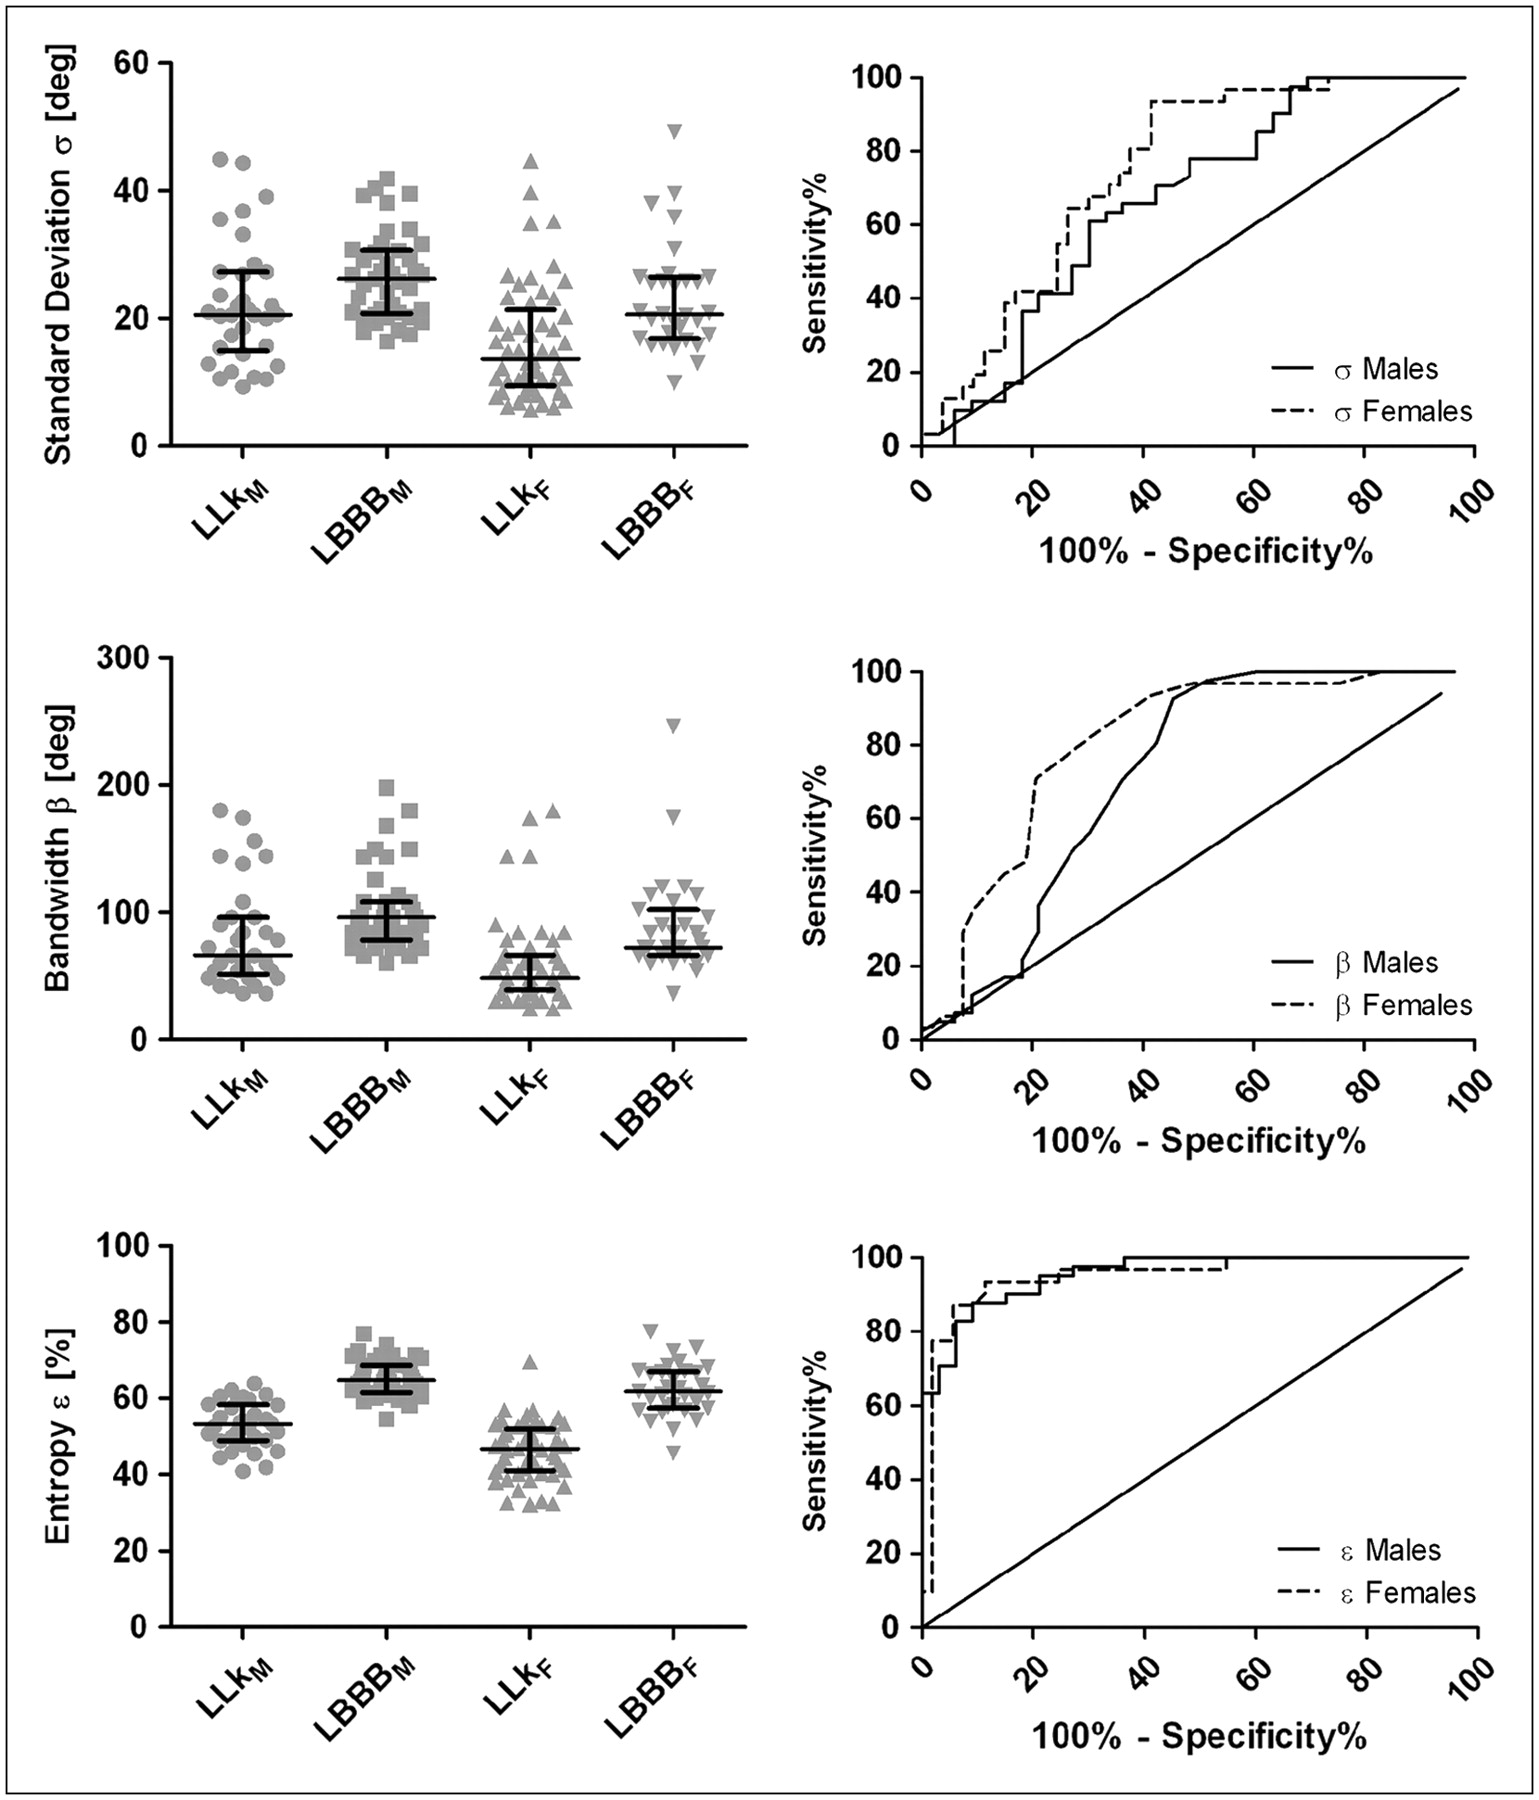
- FIGURE 3.
Data points and ROC analysis for global parameters σ (top), β (middle), and ε (bottom). Actual measurements for patients in each group are shown on left, with lines indicating median and interquartile range for each cluster, and ROC curves for men and women are shown on right.
- FIGURE 4.
Data points and ROC analysis for regional parameters. Wall-based measurements (ΔμW and ΔMW) are shown on top, and segment-based measurements (ΔμS and ΔMS) are shown on bottom. Actual measurements for differences of means and modes are shown on left, with lines indicating median and interquartile range for each cluster, and ROC curves are shown on right.
- FIGURE 5.
Comparison of regional count curves vs. time (expressed in degrees, from 0° to 360°) in individual patients from LLk and LBBB groups. Vertical count scale is omitted for clarity. Inner area of each outline (A and B) represents 5° spread and is used to further emphasize delay in propagation of mechanical contraction wave from septum to inferior and anterior walls, and lastly to lateral wall for LBBB patient. ANT = anterior; INF = inferior; LAT = lateral; SEP = septal.


Tables
Patients with… Characteristic LLk LBBB Male (%) 33/86 (38) 41/72 (57) Age (y) 49.2 ± 11.0 (23–88) 71.6 ± 11.0 (42–92) LV EF (%) 70.8 ± 8.5 (52–92) 62.6 ± 8.8 (48–82) LV EDV (mL) 90 ± 34 (42–206) 102 ± 34 (34–180) LV ESV (mL) 28 ± 16 (5–88) 40 ± 20 (8–85) EF = ejection fraction; EDV = end-diastolic volume; ESV = end-systolic volume.
Values for LLk and LBBB groups are mean ± SD, with range from minimum to maximum in parentheses, except for population sex, shown as number of men divided by total population size, followed by percentage of men in parentheses.
LLk LBBB Parameter Women Men P* Women Men P* σ 16.2 ± 10.6 22.4 ± 12.4 <0.05 23.1 ± 13.0 26.6 ± 14.2 NS β 59.1 ± 39.3 80.2 ± 46.6 <0.05 88.5 ± 51.9 100.7 ± 55.8 NS ε 46.3 ± 23.4 53.1 ± 26.2 <0.0001 62.3 ± 31.7 65.3 ± 32.8 <0.05 ΔμW 0.1 ± 8.7 −2.9 ± 8.1 NS 35.4 ± 21.9 30.6 ± 21.7 NS ΔMW 0.8 ± 5.0 0.5 ± 7.0 NS 31.2 ± 18.8 33.2 ± 20.9 NS ΔμS −1.3 ± 6.7 −2.4 ± 5.2 NS 31.4 ± 18.5 27.5 ± 19.2 NS ΔMS −2.0 ± 6.1 −2.9 ± 7.1 NS 31.8 ± 18.9 27.1 ± 19.0 NS ↵* For differences between female and male subgroups.
NS = not significant.
Values are mean ± SD.
- TABLE 3
t Test and ROC Analysis Results for Global Parameters Between Male and Female Subpopulations
Women Men t test ROC t test ROC Parameter LLkF LBBBF P AUC Ss Sp Th LLkM LBBBM P AUC Ss Sp Th σ 16.2 ± 10.6 23.1 ± 13.0 <0.0001 0.75 81% 63% 16.5° 22.4 ± 12.4 26.6 ± 14.2 <0.05 0.67 66% 64% 22.2° β 59.1 ± 39.3 88.5 ± 51.9 <0.001 0.80 71% 79% 69.0° 80.2 ± 46.6 100.7 ± 55.8 <0.05 0.72 71% 64% 81.0° ε 46.3 ± 23.4 62.3 ± 31.7 <0.0001 0.95 94% 89% 53.9% 53.1 ± 26.2 65.3 ± 32.8 <0.0001 0.96 88% 91% 60.6% Global parameters are mean ± SD.
- TABLE 4
t Test and ROC Analysis Results for Regional Parameters Between LLk and LBBB Groups
t test ROC Parameter LLk LBBB P AUC Ss Sp Th ΔμW −1.1 ± 11.9 32.7 ± 19.2 <0.0001 0.93 88% 86% 10.5° ΔMW 0.7 ± 8.6 32.3 ± 16.2 <0.0001 0.95 90% 94% 15.0° ΔμS −1.7 ± 8.4 29.2 ± 16.5 <0.0001 0.94 90% 94% 9.2° ΔMS −2.3 ± 9.2 29.2 ± 16.7 <0.0001 0.95 88% 90% 10.5° Regional parameters are mean ± SD.


Jump to section
Related Articles
Cited By...
- Presence of Postsystolic Shortening Increases the Likelihood of Coronary Artery Disease: A Rest Electrocardiography-Gated Myocardial Perfusion SPECT Study
- Electrocardiogram-Gated 18F-FDG PET/CT Hybrid Imaging in Patients with Unsatisfactory Response to Cardiac Resynchronization Therapy: Initial Clinical Results
- Quantitative Gated SPECT-Derived Phase Analysis on Gated Myocardial Perfusion SPECT Detects Left Ventricular Dyssynchrony and Predicts Response to Cardiac Resynchronization Therapy