


Abstract
Although many patients with heart failure benefit from cardiac resynchronization therapy (CRT), predicting which patients will respond to CRT remains challenging. Recent evidence suggests that the analysis of mechanical dyssynchrony using gated myocardial perfusion SPECT (MPS) may be an effective tool. The aim of this study was to evaluate global and regional gated MPS dyssynchrony measurements by comparing parameters obtained from patients with a low likelihood (LLk) of conduction abnormalities and coronary artery disease and patients with left bundle branch block (LBBB). Methods: A total of 86 consecutive patients with LLk and 72 consecutive patients with LBBB, all without prior myocardial infarction or sternotomy, were studied using gated MPS. Global (histogram SD [σ], bandwidth [β], and entropy [ε]) and regional (wall- and segment-based differences of means [ΔμW and ΔμS, respectively] or modes [ΔMW and ΔMS, respectively]) dyssynchrony measures were calculated by Fourier harmonic phase-angle analysis of local myocardial count variations over the cardiac cycle for each patient, and then unpaired t tests were used to determine which parameters were sex-specific and how well they discriminated between the LLk and LBBB populations. Receiver-operating-characteristic analysis was also performed to calculate the area under the curve (AUC), sensitivity (Ss), specificity (Sp), and optimal threshold (Th). Results: Global parameters were found to be sex-specific, whereas regional differences were sex-independent. All parameters studied showed statistically significant differences between the groups (all global, P < 0.05; all regional, P < 0.0001). Receiver-operating-characteristic analysis yielded higher AUC, Ss, and Sp for ε and regional parameters (ε: AUC = 0.95/0.96, Ss = 94%/88%, Sp = 89%/91%, and Th = 53.9%/60.6% for women/men; ΔμW: AUC = 0.93, Ss = 88%, Sp = 86%, and Th = 10.5°; ΔμS: AUC = 0.94, Ss = 90%, Sp = 94%, and Th = 9.2°; ΔMW: AUC = 0.95, Ss = 90%, Sp = 94%, and Th = 15°; and ΔMS: AUC = 0.95, Ss = 88%, Sp = 90%, and Th = 10.5°) than for global parameters (σ: AUC = 0.75/0.67, Ss = 81%/66%, Sp = 63%/64%, and Th = 16.5°/22.2° for women/men; β: AUC = 0.80/0.72, Ss = 71%/71%, Sp = 79%/64%, and Th = 69°/81° for women/men). Conclusion: The computed parameters all discriminate effectively between LLk and LBBB populations. Measurements that are less dependent on the shape of the phase-angle distribution histogram provided higher sensitivity and specificity for this purpose. Further study is needed to evaluate these parameters for the purpose of predicting response to CRT.
- left ventricular dyssynchrony
- left bundle branch block
- cardiac resynchronization therapy
- myocardial perfusion gated SPECT
Asynchrony of left ventricular (LV) contraction can result in a clinically significant reduction in cardiac functional class. Recently, the development of cardiac resynchronization therapy (CRT) has been shown to be effective in selected patients with LV asynchrony. Two randomized, controlled trials, the Multisite Stimulation in Cardiomyopathy (MUSTIC) (1) and Multicenter InSync Randomized Clinical Evaluation (MIRACLE) (2), have demonstrated the benefits of CRT for patients with New York Heart Association functional class III or ambulatory class IV heart failure who are refractory to optimal medical therapy and have a QRS duration greater than or equal to 120 ms and LV ejection fraction less than or equal to 35%. Other trials are currently ongoing to assess the benefits of CRT in other populations with heart failure (3). The trial Cardiac Resynchronization Therapy in Patients with Heart Failure and Narrow QRS (RethinQ) provided evidence that patients with heart failure and narrow QRS intervals may not benefit from CRT, despite echocardiographic evidence of mechanical dyssynchrony (4). These findings are in contrast to earlier reports demonstrating that the direct assessment of LV dyssynchrony by echocardiography predicts both response to CRT and prognosis (5) and indicating that reliance on the QRS duration may not be the most accurate method for identifying CRT candidates, because approximately one third of CRT patients do not respond to this therapy (6).
The dissimilar findings from the trial and earlier reports emphasize the need to identify better predictors of response to CRT. Mechanical synchrony, which can be achieved without requiring electrical synchrony (7), increases the effectiveness and energetic efficiency of ventricular ejection (8) and can be assessed by various techniques such as 2- and 3-dimensional echocardiography and tissue Doppler imaging (9–11), radionuclide angiography (12,13), and MRI (14).
In the field of nuclear cardiology, phase analysis of ventricular contraction has been used for decades to assess LV asynchrony. Early on, phase analysis was used with equilibrium radionuclide angiography (15) and applied to the characterization of abnormal patterns of ventricular activation (16), including the diagnosis of bundle branch blocks (17,18). More recently, phase analysis has been applied to gated myocardial perfusion SPECT (MPS), in which global synchrony measures derived from count-based thickening (19) have been shown to correlate with tissue Doppler imaging–derived measures of intraventricular delay (20) and, in a preliminary study, to predict response to CRT (21). In this study, we describe a dyssynchrony analysis technique using global and regional count-based phase measurements derived from the myocardial surfaces computed automatically by the Cedars-Sinai Quantitative Gated SPECT (QGS) algorithm (22) and obtained from routine gated MPS studies. We assess the potential utility of various measurements by examining their ability to differentiate patients with left bundle branch block (LBBB) from patients with apparently normal contraction and a low pretest likelihood (LLk) of coronary artery disease (CAD).
MATERIALS AND METHODS
Patients
The total study population consisted of a consecutive group of 158 patients without known valvular disease or cardiomyopathy who underwent clinically indicated exercise or vasodilator rest/stress MPS at Cedars-Sinai Medical Center. Patients either had a normal stress electrocardiogram and low pretest likelihood of CAD (<5%) on the basis of age, sex, presenting symptoms, and coronary risk factors (23) (n = 86) or had LBBB without prior myocardial infarction or sternotomy (n = 72). All patients also had normal myocardial perfusion (summed stress score, <4) and normal LV ejection fraction (≥45%). Additional exclusion criteria for both groups were atrial fibrillation or frequent premature ventricular contractions that might have hampered the quantitative assessment of asynchrony using gated MPS. The patient characteristics are shown in Table 1.
Characteristics of Study Population Groups
Image Acquisition and Processing
Each patient underwent a standard separate-acquisition dual-isotope rest/stress 201Tl/99mTc sestamibi protocol as previously described (24), using a dual-detector camera (Forte; Philips, or e.cam; Siemens Medical Systems), 90° configuration, elliptic 180° orbit, 64 projections, 25 s per projection, and 16 frames per R-R interval. For this study, only stress images were analyzed. For stress imaging, 99mTc-sestamibi (925–1,295 MBq; dose adjusted to patient weight) was injected at peak exercise or at peak adenosine effect (2 min). Gated MPS acquisition was initiated 15–30 min after stress, using a 20% energy window centered over the 140-keV photopeak. The beat length acceptance window was set to 100%, such that beats ranging from 50% to 150% of the mean beat length were accepted. Projection images were reconstructed using filtered backprojection (ramp filter followed by 2-dimensional Butterworth filtering; order, 5; cutoff frequency, 0.5 cycle per pixel on a 0–1 scale; pixel size, 6.5 mm) and automatic oblique reorientation (25) to produce gated short-axis image datasets. Neither attenuation nor scatter correction was performed.
Phase Parameters
For this study, gated short-axis images were segmented using a modified version of QGS that provides new global and regional quantitative parameters for the assessment of intraventricular dyssynchrony as well as previously described functional parameters (26,27). QGS operates by first computing a midmyocardial LV surface. QGS then computes endocardial and epicardial surfaces using count-profile and thickening information derived from myocardial mass conservation combined with count increases caused by partial-volume effects. For the phase-analysis algorithm, a unidimensional array is created for each spatial sampling point that contains the local maximum myocardial counts at each interval, obtained by searching between the epicardium and endocardium along a direction normal to the midmyocardial surface. This array represents a time-varying, periodic function from which the first Fourier harmonic (FFH) is determined, the phase angle of which forms the basis of all of the synchrony measurements. Amplitude information is used by the algorithm to eliminate phase measurements for which the corresponding amplitude was deemed too low to yield accurate measurements: 5% of the samples corresponding to the lowest amplitudes across the whole myocardium are automatically removed from the analysis because phase measurements are essentially ill-defined for signals that exhibit low temporal variations (13).
Global and Regional Synchrony Parameters
Once timing parameters have been calculated for all sampling points, multiple global and regional LV synchrony measures are computed on the basis of whole-ventricle, wall-based, vessel-based, and segment-based (17 or 20 segments) statistics. These statistics are calculated for the histogram (a tabulation of distribution frequencies) of FFH phase angles, and their notations in this article are as follows: μ R, mean over region R; σ R, SD over region R; MR, mode over region R (i.e., the location of the peak of the phase-angle histogram for region R); βR, bandwidth of the phase-angle histogram over region R (a measure of variability described later in this article); and εR, entropy of the phase-angle histogram over region R (a measure of variability described later in this article).
If the region R is not specified for a parameter (e.g., μ instead of μR), the statistics are computed over the whole left ventricle for a maximum of 28 × 36 samples, depending on the geometry of the LV valve plane (22). The mean, SD, and mode are calculated in the standard manner. The bandwidth, β, of a phase histogram is defined as the smallest phase-angle range that encompasses 95% of the histogram samples (19). The entropy, ε, of any given variable is computed as previously described in the context of information theory (28). ε is normalized to its maximum value for the number of histogram bins used (arbitrarily fixed at 60) and reported as a percentage. This measure of variability has been described as potentially more sensitive than the SD of the phase (13), which has often been used in the assessment of cardiac synchrony (29,30) and is equal to zero if only 1 phase value is present in the histogram and positive otherwise. The formula used to compute ε is shown in Equation 1, in which n represents the number of histogram bins, fi is the frequency of the histogram bin i (i.e., the number of measured phase angles that fall within bin i divided by the total number of phase-angle measurements in the histogram; range, 0…1), and loge x is the natural logarithm of number x: Eq. 1
Eq. 1
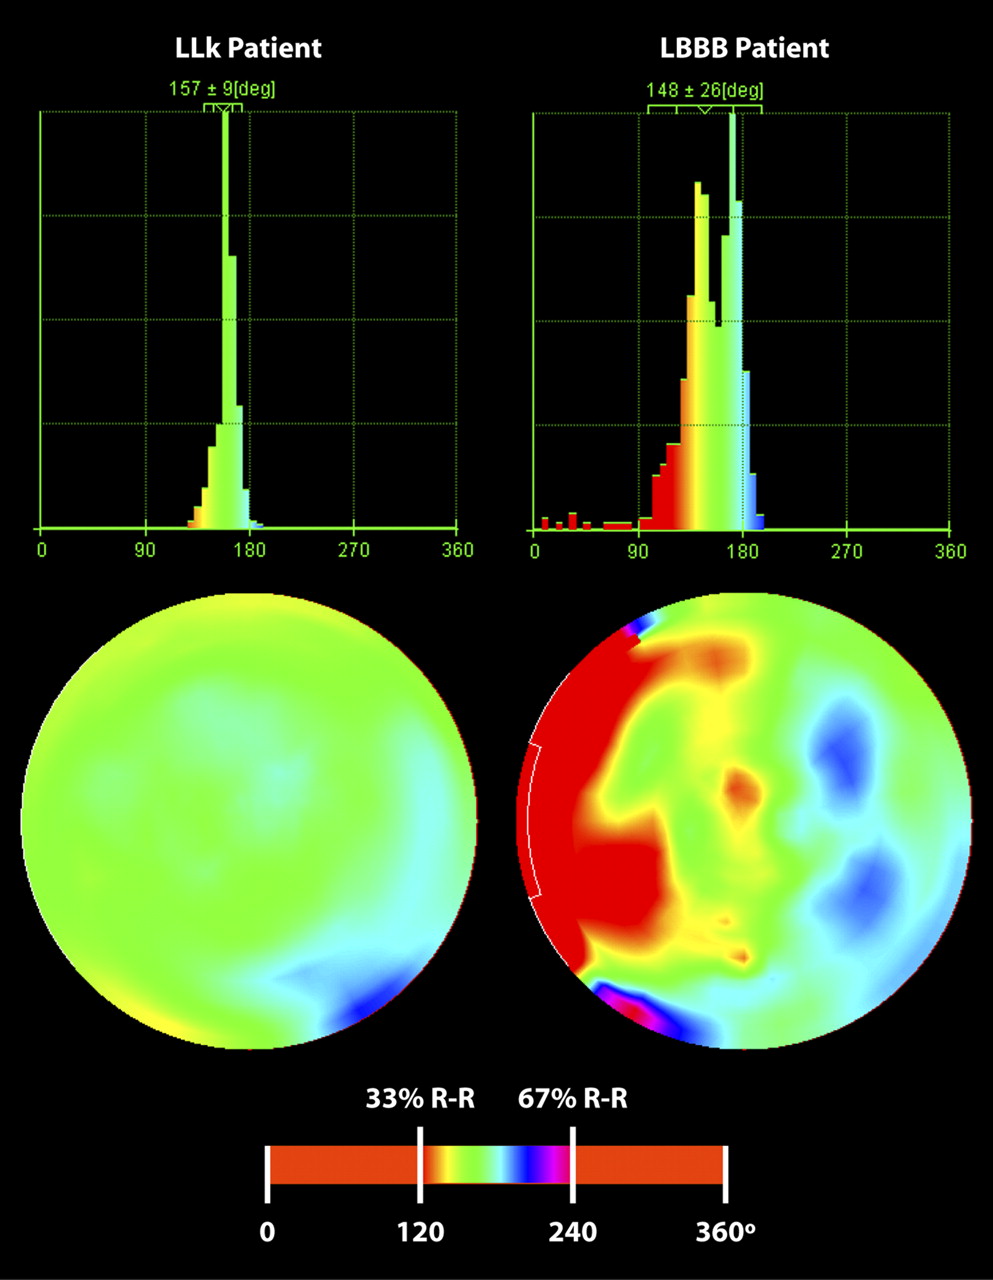
Phase-angle polar maps and global synchrony histograms for representative patients with LLk and LBBB are shown in Figure 1.

Comparison of global and regional thickening phase in individual patients from LLk and LBBB groups. Global histograms (top row) show overall increased dyssynchrony in patient with LBBB, and polar maps (middle) show uniform contraction for patient with LLk and clear septal-to-lateral contraction delay for patient with LBBB. Color scale used for both patients (bottom) has been adjusted to emphasize contraction timing differences in middle third of R-R cycle. deg = degrees.
In addition to whole-ventricle statistics, we included in this study differences between regional measures computed for the lateral wall (LAT) versus the septal wall (SEP) and differences between the average of segments 11 and 12 (midventricular lateral) versus segments 8 and 9 (midventricular septal) of a 17-segment model (Fig. 2). These differences were calculated for the means and modes of the chosen parameters and reported in this article as Δμ and ΔM, respectively, with the subscripts W for wall-based calculations and S for segment-based calculations: ΔμW = μLAT − μSEP, ΔMW = MLAT − MSEP, ΔμS = (μ11 + μ12)/2 − (μ8 + μ9)/2, and ΔMS = (M11 + M12)/2 − (M8 + M9)/2.

Wall and segment definitions used for regional calculations. In wall model, differences between lateral (LAT) and septal (SEP) walls are used; anterior (ANT), inferior (INF), and apical (APX) regions of LV are not used in this analysis. In American Heart Association 17-segment model, lateral measurements are averaged from segments 11 and 12, and septal measurements are averaged from segments 8 and 9. AHA = American Heart Association.
Timing values can be expressed in milliseconds, as angles in degrees (range, 0°−360°), or as a percentage of the average duration of the cardiac cycle (range, 0%–100%). Although timing values expressed in milliseconds may be clinically relevant (31), they are directly dependent on heart rate, potentially rendering comparison of studies acquired from patients with different heart rates problematic (10). Because the purpose of this study was not to quantify absolute timing delays but to compare differences between groups, we have expressed all timing values in degrees.
Statistical Analysis
Before comparing the LLk and LBBB groups, we performed intragroup comparisons between the sexes using 2-sample, unpaired t tests to determine whether the parameters analyzed were sex-specific and required separating patients into male and female subpopulations. Subsequently, the LLk and LBBB groups were compared by choosing contraction timing–related variables of interest and performing 2-sample, unpaired t tests. Welch's correction was applied if variances were significantly different. Receiver-operating-characteristic (ROC) analysis was also performed. LLk and LBBB denote the combined (male plus female) populations, and the M and F subscripts denote the male and female subpopulations, respectively. This yields the following groups: LLk, LBBB, LLkM, LLkF, LBBBM, and LBBBF. Calculations were performed using GraphPad Prism (version 5; GraphPad Software) and Stata (version 8; StataCorp LP).
RESULTS
Sex Differences
Table 2 summarizes the overall findings by sex within the LLk and LBBB groups. In the LLk group, the global parameters tended to be sex-specific, with statistically significant differences between men and women; differences between regional values were sex-independent, with no statistically significant differences for any of the regional parameters. In the patients with LBBB, the sex differences were minimal. Because of the findings in the LLk patients, we report below sex-specific results for global measures and combined results for regional differences.
Sex Differences within LLk and LBBB Groups
Global Parameters
Table 3 summarizes t test and ROC analysis results for global intraventricular sex-specific dyssynchrony parameters. Significant differences were found for all parameters (σ, β, and ε) between LLkF and LBBBF (women) and between LLkM and LBBBM (men). Data points, interquartile ranges, and ROC curves are shown in Figure 3.
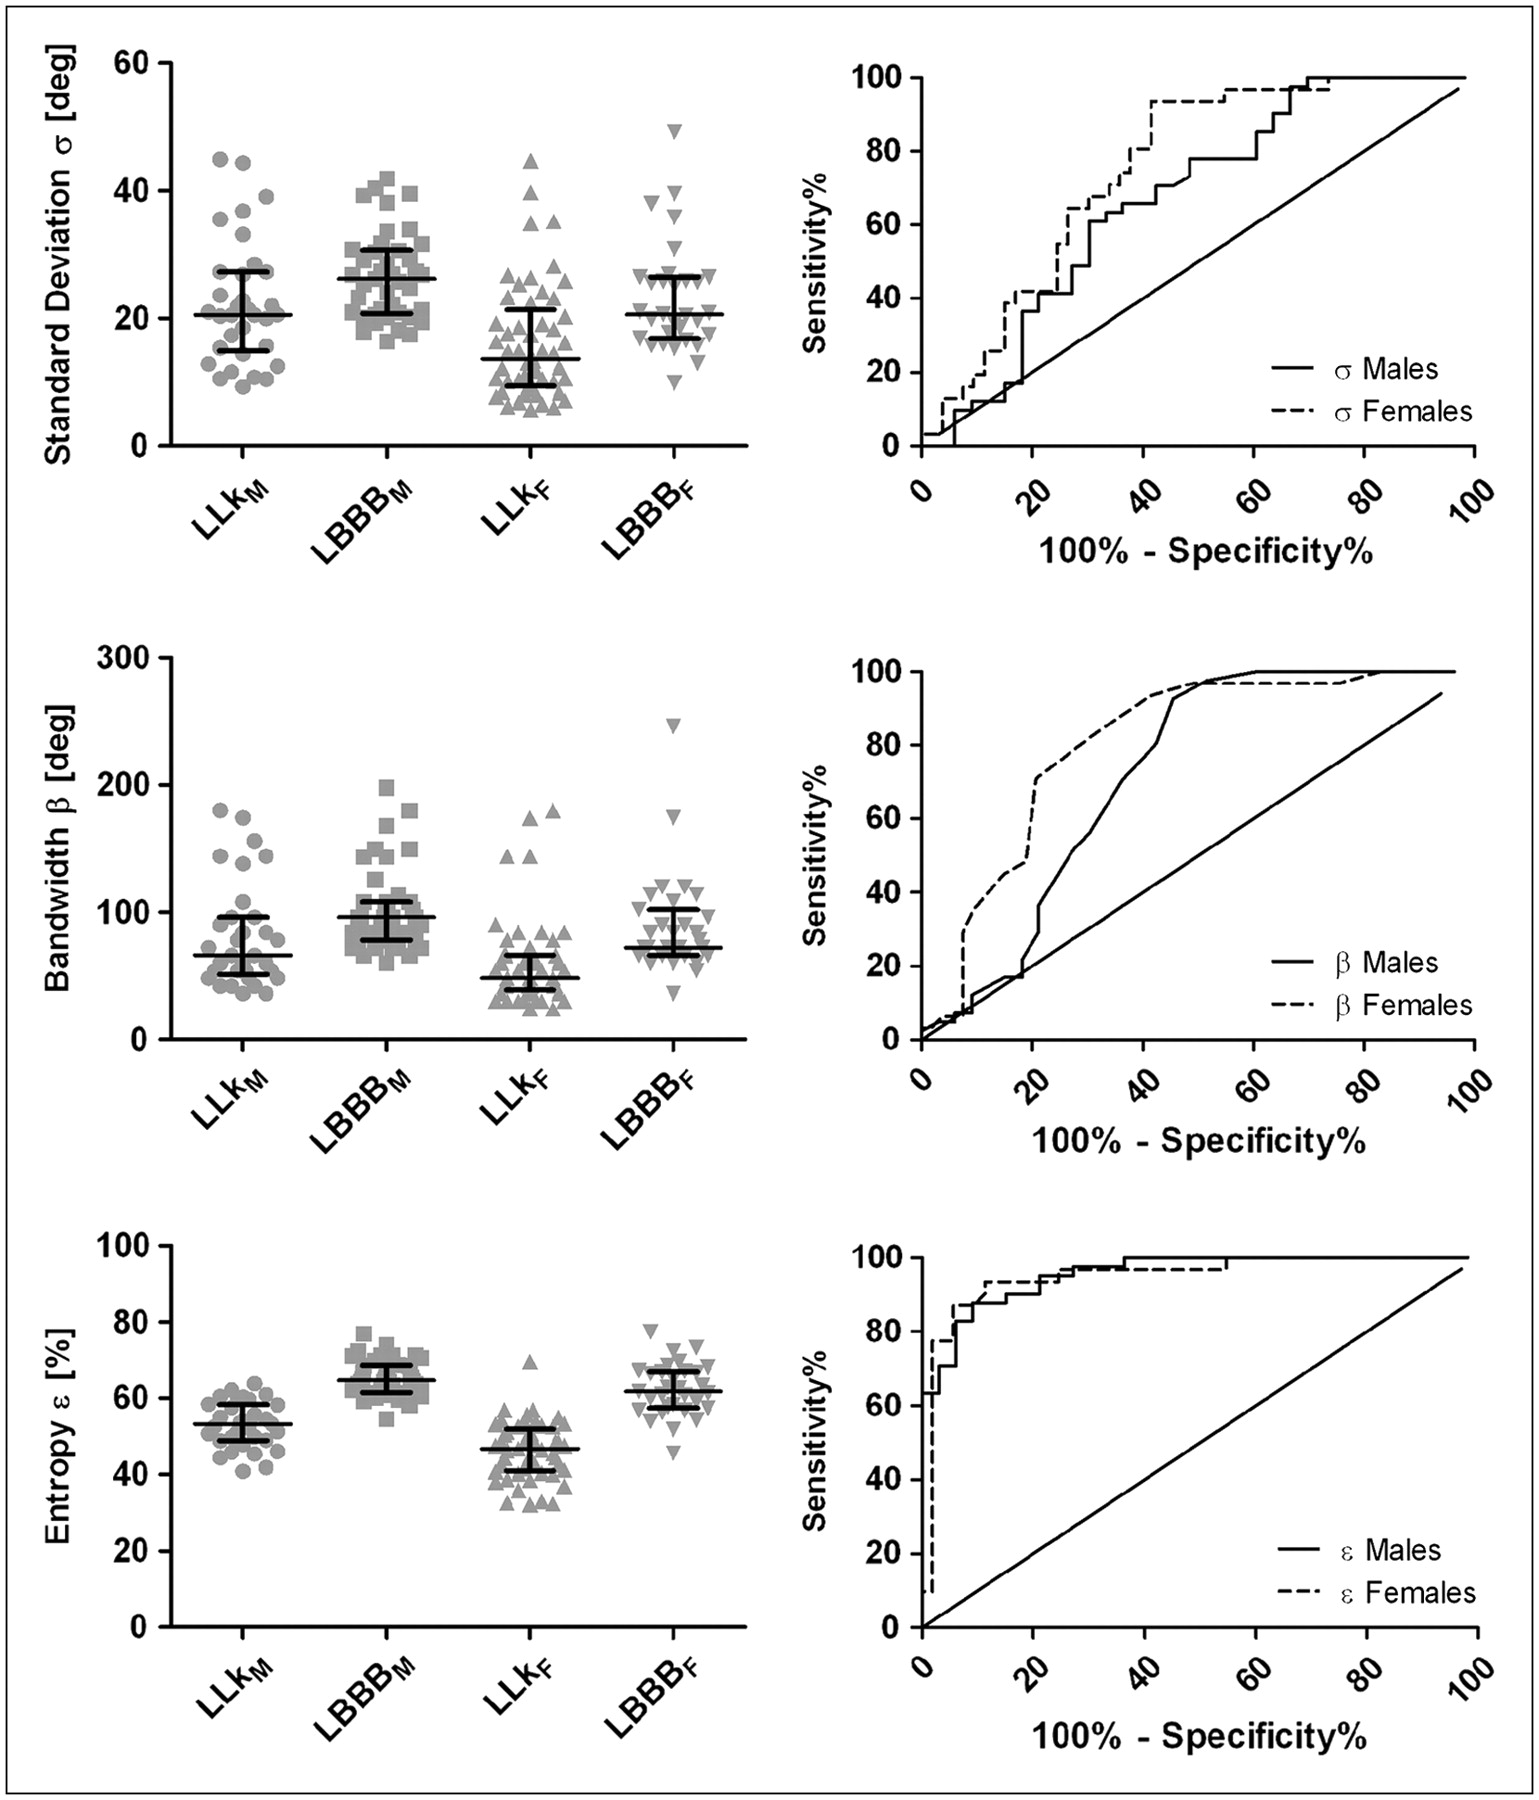
Data points and ROC analysis for global parameters σ (top), β (middle), and ε (bottom). Actual measurements for patients in each group are shown on left, with lines indicating median and interquartile range for each cluster, and ROC curves for men and women are shown on right.
t Test and ROC Analysis Results for Global Parameters Between Male and Female Subpopulations
Regional Parameters
Table 4 summarizes t test and ROC analysis results for sex-independent differences between regional FFH phase-angle means and modes. Significant differences were found for all parameters (ΔμW, ΔMW, ΔμS, and ΔMS) between LLk and LBBB. Data points, interquartile ranges, and ROC curves are shown in Figure 4.

Data points and ROC analysis for regional parameters. Wall-based measurements (ΔμW and ΔMW) are shown on top, and segment-based measurements (ΔμS and ΔMS) are shown on bottom. Actual measurements for differences of means and modes are shown on left, with lines indicating median and interquartile range for each cluster, and ROC curves are shown on right.
t Test and ROC Analysis Results for Regional Parameters Between LLk and LBBB Groups
DISCUSSION
This article describes and evaluates a modification of existing nuclear cardiology software to include a new approach to the assessment of LV dyssynchrony that can be applied to commonly performed, standard gated MPS studies. Patients without known heart disease, with normal electrocardiogram findings, and with a low likelihood of CAD were used as the controls in whom myocardial contraction is expected to occur essentially synchronously throughout the LV (8). To validate the dyssynergy measurements, we chose patients with LBBB. In these patients, mechanical contraction of the LV had been shown to occur earlier in the cardiac cycle at the septal wall and later in other regions of the myocardium because the slower electrical impulse propagation through the conduction system caused increasingly delayed activation, with the latest activation site most often located in the inferior or lateral wall (32). Consequently, increased values for the dyssynchrony measurements should be more prevalent in the LBBB group, and regional measures should demonstrate a clear pattern of propagation of mechanical contraction from the septal to the lateral wall.
Global Parameters
In both the female and the male LLk groups, t tests showed that P values for ε were lower than those for σ and β, and ROC analysis demonstrated increased area under the curve (AUC), sensitivity (Ss), and specificity (Sp) for ε versus σ and β. These results can be explained by examining how σ, β, and ε are affected by the distribution of phase histogram values. ε is a mathematical expression of synchrony that does not rely on phase similarity. The contribution to ε of 2 contiguous histogram bins is the same as the contribution to ε of 2 distant histogram bins; therefore, ε is not influenced by the presence of outliers (histogram bars located farther from the histogram peak), whereas these bins increase the value of σ and β to a greater extent. It has also been reported that such a measure better discriminates between multiple pathologies, not solely between normal and abnormal contraction patterns (13).
Regional Parameters
Differences between lateral and septal regional measurements were analyzed for combined female plus male populations. All differences were statistically significant (P < 0.0001), and ROC AUCs were all greater than 0.92, with high Ss (>87%) and Sp (>85%) for all parameters. Overall, mode differences yielded a slightly higher AUC than did mean differences. Segment-based calculations also yielded a marginally higher AUC than did wall-based calculations but not necessarily higher Ss and Sp. One might expect slightly better results with segment-based calculations because the chosen midventricular segments exclude the more troublesome basal region of the LV in which segmented contours, and therefore extracted counts, may be less accurate as the myocardium becomes thinner. A comparison of ROC curves, however, indicated that differences were not statistically significant.
Average thickening timing differences were close to zero for patients with LLk (−1.1°, 0.7°, −1.7°, and −2.3° for ΔμW, ΔMW, ΔμS, and ΔMS, respectively) and positive for patients with LBBB (32.7°, 32.3°, 29.2°, and 29.2° for ΔμW, ΔMW, ΔμS, and ΔMS, respectively). As previously mentioned, positive differences indicating later contraction in the lateral wall than in the septal wall were to be expected given the physiopathology of LBBB. Figure 5 shows a sample comparison of wall-based thickening (counts) curves for individual patients with LLk and LBBB, graphically emphasizing regional differences between the timing of thickening for the LV walls.

Comparison of regional count curves vs. time (expressed in degrees, from 0° to 360°) in individual patients from LLk and LBBB groups. Vertical count scale is omitted for clarity. Inner area of each outline (A and B) represents 5° spread and is used to further emphasize delay in propagation of mechanical contraction wave from septum to inferior and anterior walls, and lastly to lateral wall for LBBB patient. ANT = anterior; INF = inferior; LAT = lateral; SEP = septal.
Study Limitations
Myocardial stunning in the poststress images was not a concern as it might be in a general population of patients with CAD because perfusion and function were normal for all patients, and visual transient ischemic dilation, an indicator of possible balanced reduction of flow, was not present. In other studies, and especially when comparing SPECT dyssynchrony parameters with other measurements acquired at rest, it may be advisable to process rest images instead of poststress images.
Because our algorithm relies on myocardial count variations, severe and extensive ischemia can be detrimental to the quantification of dyssynchrony. Although the algorithm handles hypoperfused areas by eliminating a fixed proportion of measurements instead of relying on a threshold that might discard large portions of the myocardium, in extreme cases it may be necessary to rely on another technique to derive dyssynchrony measurements. Preliminary experience with patients with chronic heart failure, however, indicates that this may only rarely be necessary.
The FFH phase angle derived from wall thickening information is often used to quantify the onset of ventricular contraction (19). This angle, however, can be influenced by a variety of other timing factors (33), a problem that can be more easily alleviated in high–frame-rate imaging techniques such as radionuclide angiography by discarding a fraction of the late diastolic filling phase frames (15).
As has been previously described (27), accurately measuring thickness from MPS is intrinsically difficult. This study, however, is concerned only with variations of this quantity, and it is reasonable to expect that the temporal behavior of thickness curves, approximated by myocardial counts, adequately depicts the underlying physiologic process of myocardial contraction. At the same time, it is also reasonable to expect that myocardial wall motion may be affected by other phenomena such as paradoxic stretching of the early activated territory (14) in the case of LBBB, and therefore wall motion was not included in this analysis. A discussion of normal regional motion in QGS is available elsewhere (34).
Differences between regional SD, bandwidths, or entropies were not included because they would not have a meaningful interpretation in this context. Similarly, global LV means and modes are not reported, because they do not provide information regarding the degree of dyssynchrony.
MPS currently provides only LV synchrony assessment, but a prognostic study using radionuclide cineangiography for an idiopathic dilated cardiomyopathy population showed intraventricular synchrony to be a better predictor than interventricular synchrony (35), indicating that the lack of interventricular measurements may not be a relevant limitation.
CONCLUSION
This study allowed us to determine that both global and regional parameters derived from QGS phase analysis may prove useful in characterizing mechanical contraction abnormalities. For this particular application, ε was superior to σ and β as far as discriminating between the LLk and LBBB groups is concerned. All regional parameters performed well and similarly to ε, with low P values (<0.0001) when comparing groups using t tests and high AUC (>0.92), Ss (>87%), and Sp (>85%) in ROC analysis. Recent work (20) has shown that global LV measures can be correlated to some degree with quantities obtained from tissue Doppler imaging. The availability of regional measures should allow for the refinement of such a comparison and possibly for the direct comparison of timing values. A correlative study of regional MPS–derived phase measures with other dyssynchrony markers may yield more insight into the potential of MPS as an effective tool for selecting candidates for the placement of pacing devices.
QGS and its associated Quantitative Perfusion SPECT analysis algorithm (25) constitute a framework in which the combination of phase information with myocardial viability assessed by PET and a measure of ventricular remodeling (36) may provide insight into the benefits of CRT for a particular patient through avoidance of scar tissue in lead placement (37,38) and monitoring of postimplantation reverse remodeling (39).
Acknowledgments
Cedars-Sinai Medical Center owns the algorithm described in this manuscript and receives royalties from its licensing. A portion of these royalties is shared by authors Serge D. Van Kriekinge, Daniel S. Berman, and Guido Germano.
Footnotes
-
COPYRIGHT © 2008 by the Society of Nuclear Medicine, Inc.
References
- Received for publication June 13, 2008.
- Accepted for publication July 24, 2008.


Jump to section
Related Articles
Cited By...
- Presence of Postsystolic Shortening Increases the Likelihood of Coronary Artery Disease: A Rest Electrocardiography-Gated Myocardial Perfusion SPECT Study
- Electrocardiogram-Gated 18F-FDG PET/CT Hybrid Imaging in Patients with Unsatisfactory Response to Cardiac Resynchronization Therapy: Initial Clinical Results
- Quantitative Gated SPECT-Derived Phase Analysis on Gated Myocardial Perfusion SPECT Detects Left Ventricular Dyssynchrony and Predicts Response to Cardiac Resynchronization Therapy