


Abstract
Postsystolic shortening (PSS), which is a delayed myocardial contraction that occurs after end-systole, has been considered an important diagnostic index of myocardial ischemia. Recent technological advancements in quantitative gated SPECT (QGS) software enables the left ventricular (LV) regional analysis and may be useful for PSS measurement. The purpose of this study was to evaluate whether PSS at the resting condition determined by QGS is useful to identify patients with coronary artery disease. Methods: The study comprised 146 patients (mean age ± SD, 71 ± 8 y; 98 men) with normal LV wall motion (mean LV ejection fraction ± SD, 72% ± 9%) who underwent both coronary angiography and resting 99mTc-tetrofosmin myocardial perfusion SPECT. The sum of the difference between post–end-systolic maximal LV thickening and end-systolic LV thickening, designated PSS index, was calculated from 17 LV myocardial segments using QGS. Results: The PSS index was significantly higher in patients with significant stenosis of the coronary artery than in the other patients (9.8 ± 10.2 vs. 5.6 ± 5.1; P < 0.01). A cutoff point of 6.0 of the PSS index had sensitivity, specificity, positive predictive value, and negative predictive values of 55%, 70%, 76%, and 47%, respectively, for the diagnosis of coronary artery disease. Multivariate logistic regression analysis demonstrated that a PSS index greater than 6.0 was an independent predictor for the presence of coronary artery disease (odds ratio, 2.46; 95% confidence interval, 1.1–5.4; P < 0.05). Conclusion: Among subjects with normal LV function, PSS index even in the resting condition determined using QGS may help to identify patients with coronary artery disease.
Quantitative electrocardiography-gated SPECT myocardial perfusion imaging (quantitative gated SPECT [QGS]) can be used to acquire the left ventricular (LV) time volume curve at several phases of the cardiac cycle and, therefore, to assess LV wall motion (1–5). Advances in QGS software have enabled the analysis of the LV regional wall motion (6–8). Several previous studies have used this method to investigate the diagnostic and prognostic values of LV dyssynchrony in patients with heart failure (9–13) and ischemic heart disease (14–17). Postsystolic shortening (PSS), defined as delayed myocardial contraction occurring after end-systole, is observed in patients with flow-limiting coronary stenosis and has also been proposed as a marker of myocardial ischemic memory (18–26).
The LV wall motion can be analyzed by QGS using an automated procedure with high reproducibility. In the present study, we used QGS to investigate whether the presence of PSS at rest is associated with an increased likelihood of coronary artery stenosis in subjects with normal global LV systolic function.
MATERIALS AND METHODS
Study Patients
We retrospectively analyzed data from 146 consecutive patients (98 men, 48 women; mean age ± SD, 71 ± 8 y) who underwent myocardial perfusion SPECT for the diagnosis of active myocardial ischemia because of the presence of signs or symptoms suggestive of myocardial ischemia or to the presence of proven coronary artery lesions, who also underwent coronary artery angiography within 3 mo before and after the myocardial perfusion SPECT study. Exclusion criteria included decompensated heart failure, atrial fibrillation, history of heart surgery, previous myocardial infarction, cardiomyopathy, advanced arterial ventricular block, severe chronic obstructive pulmonary disease, bronchospasm, ejection fraction less than 55%, left bundle branch block, and postpacemaker implantation. The institutional review board (the ethical committee of the Osaka Medical College) approved this retrospective study, and the requirement to obtain informed consent was waived.
SPECT Imaging
Gated SPECT myocardial perfusion imaging was routinely performed using a 1-d stress–rest protocol that included physical exercise with a bicycle ergometer (RH-32; Lode Instrumenten) or administration of adenosine (Daiichi Sankyo Pure Chemicals). 99mTc-tetrofosmin (296 MBq) was intravenously injected 1 min before near-maximum stress or 3 min after the start of continuous adenosine infusion. Twelve-lead electrocardiograms and blood pressure measurements were obtained at baseline and every minute during the stress test. Myocardial SPECT acquisition was performed 30–45 min later after injection. Four hours later, resting SPECT was performed approximately 1 h after an injection of 600 MBq of 99mTc-tetrofosmin.
A triple-detector SPECT system (GCA-9300A/PI; Toshiba Medical Systems) equipped with a high-resolution parallel-hole collimator was used for the imaging studies. The gated SPECT data were acquired using the following parameters: 360° step-and-shoot rotation, 60 steps per head, 60 s per step, 128 × 128 matrix (1 pixel = 3.2 mm), 16 frames per cardiac cycle, and a beat acceptance window at 20% of the average R-R interval calculated just before the data collection began. The ungated projection data were obtained by summing the gated projection data. The 360° projection data were reconstructed by performing filtered backprojection with a Butterworth filter (cutoff frequency, 0.47 cycles/cm; order, 8) using a GMS-7700B workstation (Toshiba Medical Systems). The reconstructed short-axis images were analyzed using quantitative perfusion SPECT with QGS software (Cedars-Sinai Medical Center). The ejection fraction, end-diastolic volume, and end-systolic volume were automatically obtained from the QGS analysis.
Phase Analysis and PSS Index Measurements
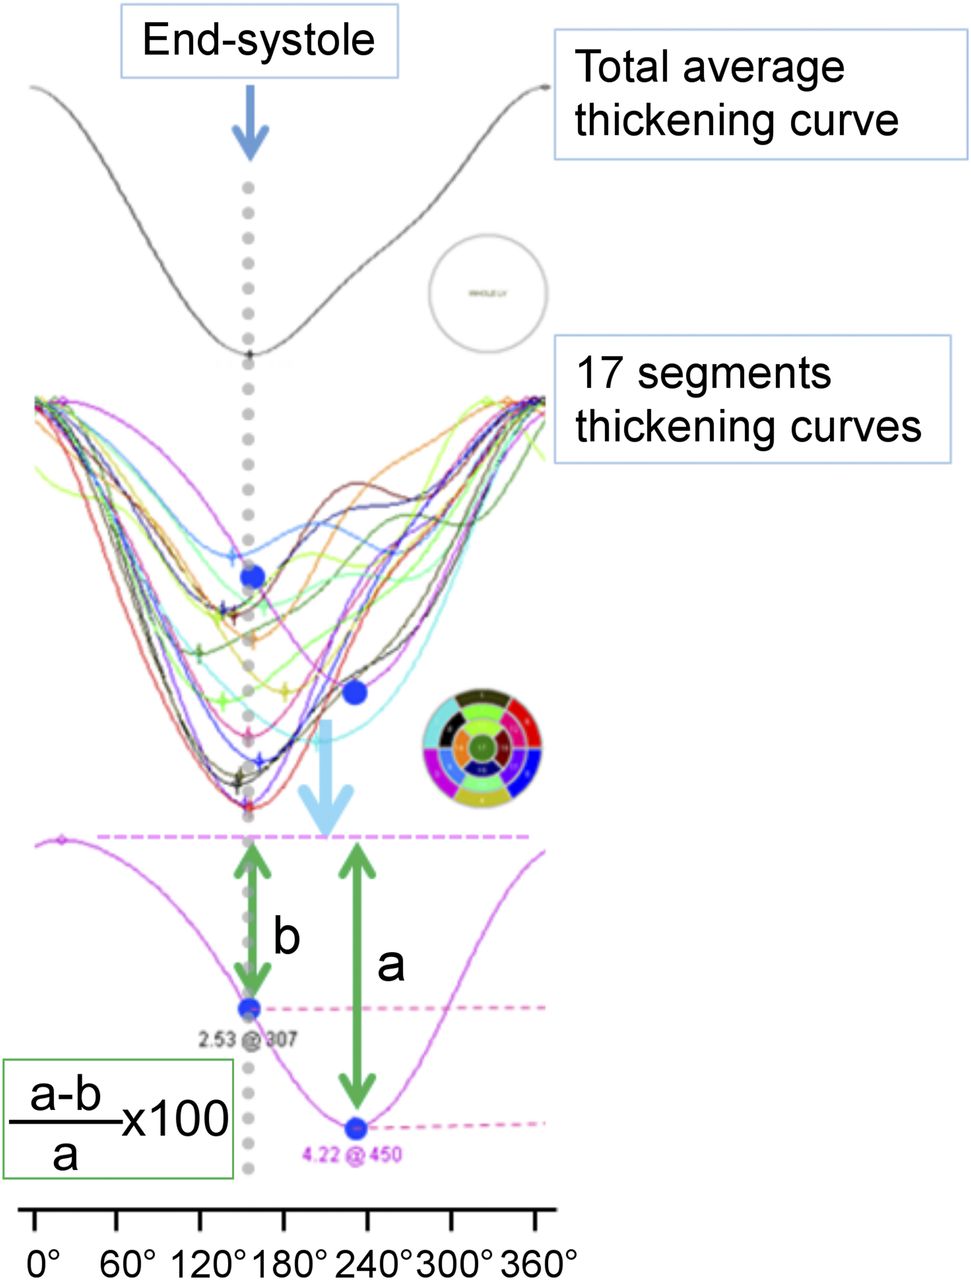
Phase analysis of the left ventricle was performed on the resting electrocardiography-gated SPECT dataset using QGS 2007 software (6) on a GMS-7700B workstation. The global and regional dyssynchrony measures were automatically computed. For this study, a histogram was constructed from the phase values for the entire left ventricle, and phase SD and histogram bandwidth were calculated and examined as the global dyssynchrony measures (6–16). Timing values were expressed in degrees (0°–360°). End-systole was defined using the total average thickening curve, and 17-segment thickening curves were drawn. The time to maximal (max) LV thickening (msec), max LV thickening (mm), and end-systolic LV thickening (mm) were measured for each of the 17 segments. The PSS index was derived from the sum of the difference between post–end-systolic max LV thickening and end-systolic LV thickening divided by post–end-systolic max LV thickening from the 17 segments (21). If a segment curve showed that the time to max LV thickening occurred before end-systole, the difference between max LV thickening and end-systolic LV thickening was assumed to be 0 (Fig. 1).

Measurements of PSS index. (Upper) End-systole was defined on the basis of total average thickening curve. (Lower) PSS was determined from 17 segments using sum of difference between post–end-systolic max LV thickening (a) and end-systolic LV thickening (b) divided by post–end-systolic max LV thickening (a). If segment curve showed time to max LV thickening before end-systole, difference between max LV thickening and end-systolic LV thickening was assumed to be 0.
Evaluation of Perfusion
The SPECT images from the poststress and resting studies were displayed on a personal computer monitor. The images were generated both in gray scale and in color scale from the raw transaxial tomograms. Orthogonal images were generated using oblique angle reconstruction, producing short-axis, horizontal long-axis, and vertical long-axis views. In addition, polar maps were generated to enable comparison of global perfusion. Two experienced observers with no knowledge of the clinical data examined the images and estimated the degree of myocardial ischemia. The diagnostic accuracy was evaluated using patient-based data. A 17-segment model was used to categorize perfusion defects. Individual segments were scored as follows: 0, normal; 1, mildly reduced; 2, moderately reduced; 3, severely reduced; and 4, absent. The severity of reversible defects in myocardial perfusion was defined on the basis of the summed difference scores (SDSs) derived from summed stress scores (SSSs) and summed rest scores (SRSs) for all the segments. For the calculation of sensitivity, specificity, and predictive values for angiographic coronary artery disease, an interpretive score or greater was defined as abnormal in the overall territory. Differences between the interpreters were resolved by consensus.
Coronary Angiography
The interval between coronary angiography and myocardial perfusion SPECT was less than 3 mo. The degree of coronary artery stenosis was visually rated according to the criteria of the American Heart Association by an experienced investigator unaware of the SPECT data (27). Significant stenosis was considered to be present when 75% or more narrowing of the diameter was observed within any of 13 segments (1–4, 5–9, and 11–14).
Data Analysis
The differences in parametric data between the 2 groups were tested using the Student t test for normally distributed data (i.e., age, body mass index, end-diastolic volume, ejection fraction, and transient ischemic dilatation) or the Kruskal–Wallis test for data not normally distributed data (i.e., end-systolic volume, phase SD, histogram bandwidth, PSS index, SSS, SRS, and SDS). The findings were expressed as mean ± SD. Sensitivity, specificity, positive predictive value (PPV), and negative predictive value (NPV) in indices as predictors of significant coronary artery disease were calculated in the traditional manner. Receiver-operating-characteristic (ROC) curves were analyzed to determine the optimal cutoffs for the SSS, SRS, SDS, phase SD, histogram bandwidth, and PSS index. Univariate or stepwise multivariate logistic regression analysis was used to identify coronary artery disease. Proportions of diagnostic accuracy were compared using the χ2 test when appropriate. A P value of less than 0.05 was considered statistically significant. Data analysis was performed using SPSS (version 22.0; IBM/SPSS).
RESULTS
The characteristics of the study patients are shown in Table 1. Coronary angiographic examination revealed that 53 of the 146 patients did not have significant coronary artery stenosis, 57 had single-vessel disease, and 36 had multivessel disease. There was no significant difference in either of the 2 conventional parameters, phase SD and histogram bandwidth, between the subjects with significant coronary artery stenosis and those without. Conversely, the PSS index was significantly higher in patients with coronary artery disease than in those without (Fig. 2). There were significant correlations between PSS index and phase SD and histogram bandwidth (Fig. 3). Representative phase analysis and 17-segment thickening curves are shown in Figure 4.
Patient Characteristics
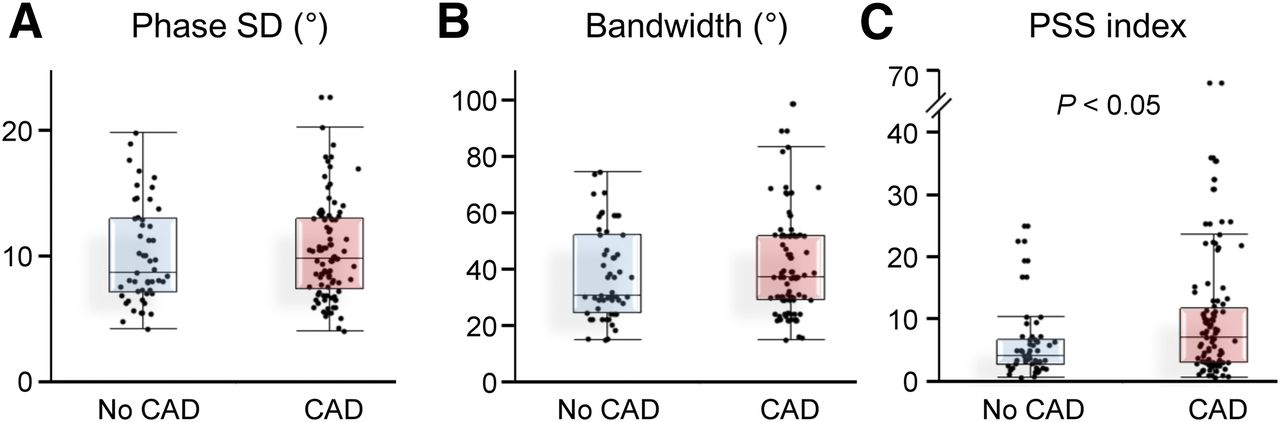
Box plots showing medians and 25th and 75th percentiles of phase SD, histogram bandwidth, and PSS index between patients with and without coronary artery disease. CAD = coronary artery disease.
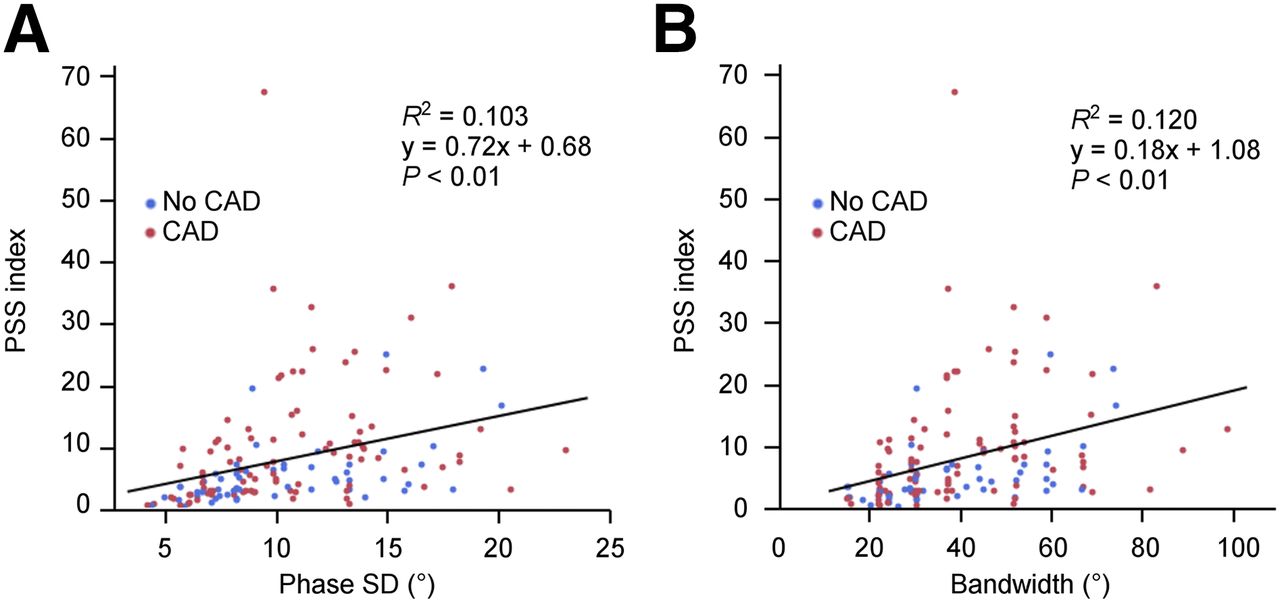
Comparisons of PSS index with phase SD and histogram bandwidth. CAD = coronary artery disease.

Representative cases of phase analysis and 17-segment thickening curves. Results from patient without coronary artery stenosis (A) and results from patient with significant coronary artery stenosis of right coronary artery and left circumflex artery (B). In A, phase SD = 10°, histogram bandwidth = 37°, and PSS index = 2.7, and in B, phase SD = 10°, histogram bandwidth = 39°, and PSS index = 29.6.
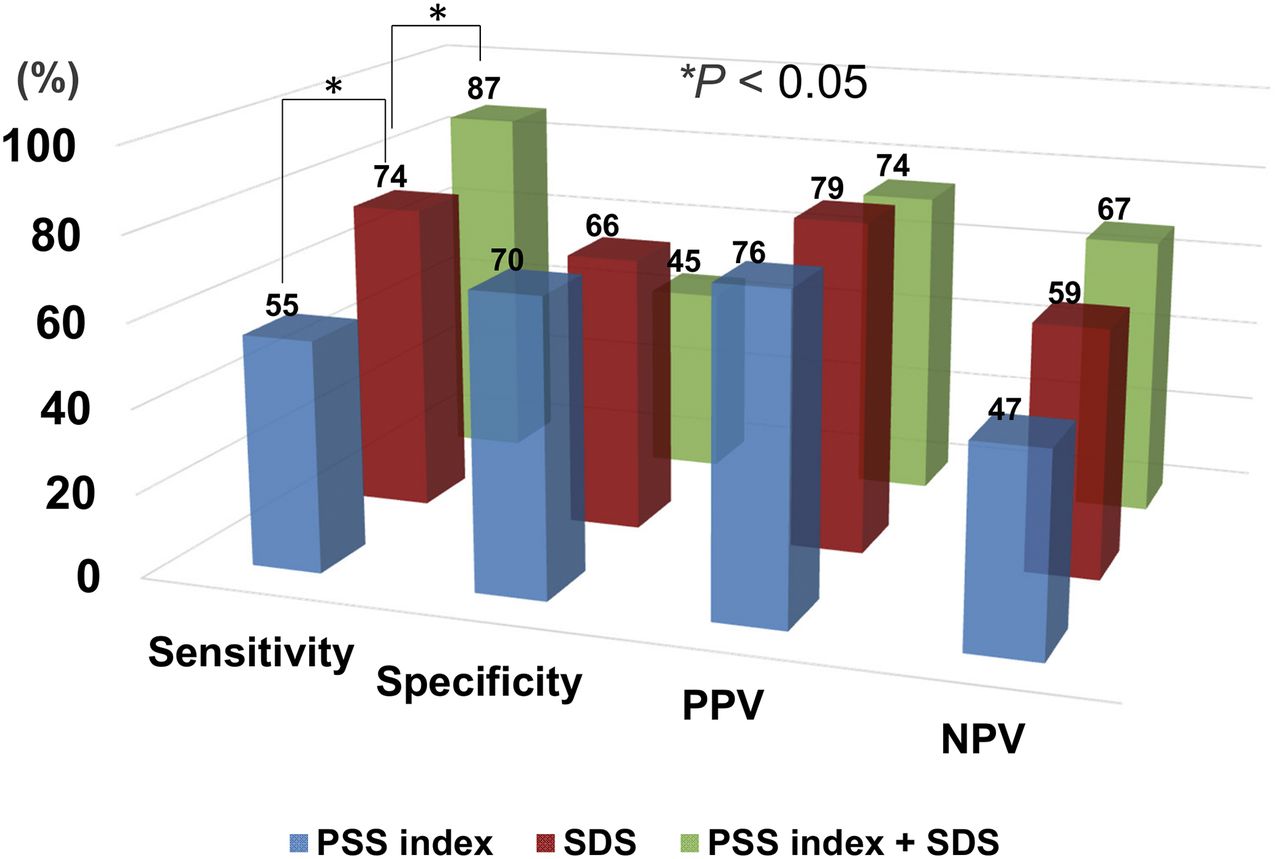
The optimal cutoff points for the phase SD, histogram bandwidth, PSS index, and SDS for the detection of coronary artery stenosis were determined using the ROC analysis. The optimal cutoff points were 10° for phase SD, 37° for histogram bandwidth, 6 for PSS index, 4 for SSS, 2 for SRS, and 3 for SDS. The areas under the ROC curves were 0.53, 0.53, 0.64, 0.71, 0.52, and 0.74, respectively. The PPV of a PSS index greater than 6 was 76% (95% confidence interval, 68%–84%). The sensitivity, specificity, PPVs, NPVs, and accuracy of the cutoff points of the 4 parameters are summarized in Table 2. The diagnostic value of the combination of the PSS index and SDS is shown in Figure 5.
Diagnostic Accuracy for Detecting Coronary Artery Disease

Diagnostic usefulness of PSS index, SDS, and combination of PSS index and SDS.
Among the 9 parameters tested, the PSS index, SSS and SDS, but not phase SD or histogram bandwidth, and SRS were significantly associated with coronary artery stenosis on univariate analysis. The PSS index and SDS remained significant independent predictors for coronary artery disease on the multivariate analysis adjusted for sex and age (Table 3).
Univariate and Multivariate Logistic Analysis for Detecting Coronary Artery Stenosis
In addition, to detect multivessel disease, the area under the ROC curve was higher for the PSS index than for transient ischemic dilatation (0.57 vs. 0.49). The diagnostic accuracy of a PSS index greater than 6 was as follows: sensitivity, 58%; specificity, 58%; PPV, 31%; and NPV, 81%.
DISCUSSION
The results of the current study demonstrated that the extent of the PSS index evaluated using segmental thickening curves extracted from QGS data in the resting condition was associated with the presence of coronary artery stenosis among the patients with suspected or confirmed coronary artery disease.
The QGS method is widely used to assess LV function (1,4,5). Phase analysis of QGS images was developed to assess LV dyssynchrony (6–8). The phase SD and histogram bandwidth are associated with the prognosis of patients with LV dysfunction (7–13). In addition, several studies have also investigated the value of these parameters from alterations in the stress–rest image for the diagnosis of coronary artery disease (14–16). Al Jaroudi et al. reported that even the presence of a large reversible perfusion defect did not alter the indices of mechanical dyssynchrony (14). In contrast, Chen et al. reported a significant increase in postdipyridamole 201tallium stress–rest alternation in patients with ischemia, and using 99m Tc-sesamibi, Hida et al. also showed significant increases in postexercise stress LV dyssynchrony in patients with multivessel coronary artery disease (13,16). The differences in the findings of these 3 studies may have originated from the timing of the acquired SPECT images (images are usually acquired 5–60 min after stress, not during stress), the different kinds of stress and radiotracers, and the dose of radiotracer. Furthermore, phase analysis may reflect many different factors throughout the cardiac cycle.
In the present study, the PSS index was derived using QGS from 17-segment thickening curves acquired during rest. This approach was selected because PSS is a sensitive and early sign of acute and chronic myocardial ischemia based on experimental and clinical data (13,14,18–20). Asynergy of the left ventricle induced by stress generally improved soon. In contrast, PSS persisted longer than systolic disturbance, and the progress of PSS differed depending on the degree of stenosis (20,25). In the present study, the patients with a higher PSS index were more likely to have coronary artery disease, and multivariate analysis showed that the PSS index was more strongly associated with coronary artery disease than the other dyssynchrony indices, phase SD and histogram bandwidth.
The mechanism underlying PSS has not been clearly addressed by previous studies. Patients with severe coronary artery disease may suffer ischemia even in daily life, and PSS persists after stress because of prolonged stunning or myocardial hibernation. In the present study, PSS assessed by 99mTc-tetrofosmin QGS demonstrated different dyssynchrony patterns between the patients with and without significant coronary stenosis, even at rest. In general, it is difficult to diagnose ischemia without any provocation. Dilsizian et al. reported persistent abnormalities of fatty acid metabolism 30 h after transient ischemia using 123I-BMIPP imaging (28). In addition, PSS and diastolic index acquired at rest using tissue Doppler imaging echocardiography have been shown to predict coronary artery disease with a sensitivity of 60%–83% and specificity 74%–90% (23). Here, we demonstrated that PSS evaluated using QGS could predict coronary artery disease. This method can be performed in an automated manner during a relatively short period of time and with high reproducibility.
This study has some limitations. First, the study was conducted retrospectively at a single center with a small number of participants. Therefore, a larger cohort of prospectively selected patients would strengthen the findings. Second, we did not assess dyssynchrony variables using other modalities because all the patients had normal LV function without heart failure. Third, there was a technical limitation in that data were acquired at 16 frames per cardiac cycle and end-systole as average systole LV thickening, but not aortic valve closure, which may have decreased the PSS index. Acquisition at higher frames per cardiac cycle is theoretically better to detect PSS. Fourth, we did not investigate the relationship between the selected parameters and the degree of stenosis of the coronary artery. Fifth, PSS is not specific for ischemia because it can occur in hypertensive heart disease, hypertrophic cardiomyopathy, dilated cardiomyopathy, left bundle branch block, and normal hearts (20,29,30). Sixth, this study excluded patients with prior myocardial infarction because the QGS method has limited ability to evaluate LV thickening in areas of low perfusion. Finally, the diagnostic criteria of coronary stenosis included stenosis of the coronary arteries based on angiographic findings, rather than physiologic changes, such as the functional flow reserve or coronary flow reserve.
Potential Clinical Implications and Future Directions
Today, QGS is the standard imaging technique used to assess LV function in clinical settings. Segmental thickening curves can be generated in a few extra minutes. The patients with higher PSS index were more likely to have coronary artery disease, and lower PSS index was associated with lower prevalence of multivessel disease. These results suggest that the patients suffer ischemia even at rest, and this contributes to prognosis. Further large-scale, long-term studies are required to better understand the diagnostic and prognostic value of PSS. The technique was semiautomated, nonuser-dependent, coupled with simultaneous myocardial perfusion assessment and 3-dimensional analyses from resting QGS scan.
CONCLUSION
The results of the present study indicate that PSS index at rest assessed using QGS might be a clinically useful indicator for detection of coronary artery disease in patients with diagnosed or suspected coronary artery disease but with no visual evidence of regional wall motion abnormality.
DISCLOSURE
The costs of publication of this article were defrayed in part by the payment of page charges. Therefore, and solely to indicate this fact, this article is hereby marked “advertisement” in accordance with 18 USC section 1734. No potential conflict of interest relevant to this article was reported.
Acknowledgments
We are thankful for the technical assistance of the staff (Akira Asazu and Hideyuki Sodeoka) in our nuclear medicine department; the secretarial assistance of Yuko Takenaka and Tomoko Takabayashi; and the technical advice of Yoshihiro Nishimura, Kenji Kuse, and Masahiro Kubota.
Footnotes
Published online Sep. 10, 2015.
- © 2015 by the Society of Nuclear Medicine and Molecular Imaging, Inc.
REFERENCES
- Received for publication May 26, 2015.
- Accepted for publication August 31, 2015.


Jump to section
Related Articles
Cited By...
- No citing articles found.