


Abstract
The present study aimed to distinguish responders to cardiac resynchronization therapy (CRT) from nonresponders, using electrocardiogram-gated 18F-FDG PET/CT. Methods: Seven consecutive CRT nonresponders were included in the study, along with 7 age- and sex-matched CRT responders, serving as reference material. Therapy response was defined as clinical improvement (≥1 New York Heart Association class) and evidence of reverse remodeling. Besides PET/CT, we measured brain natriuretic peptide levels and assessed dyssynchrony using transthoracic echocardiography. Results: Compared with nonresponders, CRT responders showed significant differences in the declines of left-ventricular end-systolic volume and brain natriuretic peptide and in left-ventricular dyssynchrony (global left-ventricular entropy), extent of the myocardial scar burden, and biventricular pacemaker leads positioned within viable myocardial regions. Among the nonresponders, further therapy management was guided by the PET/CT results in 4 of 7 patients. Conclusion: Cardiac hybrid imaging using gated 18F-FDG PET/CT enabled the identification of potential reasons for nonresponse to CRT therapy, which can guide subsequent therapy.
- resynchronization therapy
- gated 18F-FDG PET/CT
- phase analysis
- hybrid imaging
- nonresponder
- dyssynchrony
- ICD
The aim of the present study was to evaluate gated 18F-FDG PET/CT as an integrated approach for assessing left ventricle viability, identifying the location of biventricular pacemaker leads, and obtaining left ventricle functional data, including contractile phase analysis. We hypothesized that clinical nonresponders to cardiac resynchronization therapy (CRT) would prove to have relatively greater left-ventricular (LV) scar burden and persistent dyssynchrony and tend to have LV pacemaker leads positioned in nonviable myocardial areas. These 3 endpoints were assessed from a single hybrid PET/CT examination, which could potentially guide individual therapy in a significant number of CRT nonresponders.
MATERIALS AND METHODS
Seven consecutive CRT nonresponders were included in the study, along with 7 age- and sex-matched CRT responders, for a total study population of 14 patients (12 men; mean age ± SD, 67.9 ± 8.4 y), who were examined by PET/CT at a mean of 32 ± 17 mo after CRT.
CRT Implantation
The selection criteria leading to CRT consisted of advanced heart failure (New York Heart Association [NYHA] class III or IV) despite optimal medical therapy (1), a QRS duration of more than 120 ms, and an LV ejection fraction (LVEF) of 35% or less. Patients with ischemic and dilated cardiomyopathy were included, presuming that, in a clinical setting, patients with the initial diagnosis of a dilated cardiomyopathy frequently presented with areas of myocardial scar tissue (2). All patients received a CRT system with implantable cardioverter defibrillator backup (Medtronic, St. Jude Medical, or Guidant).
2-Dimensional Transthoracic Echocardiography and Clinical Follow-up
The patient follow-up included a pacemaker device interrogation and clinical assessments at 1 and 3 mo and then every 6 mo. During follow-up, we tried to optimize the stimulation parameters under echocardiographic control. After essential correction of pacing parameters (atrioventricular/interventricular timing) in 4 patients (2 responders, 2 nonresponders), arrhythmias (2 patients) or loss of biventricular capture due to fusion beats (2 patients) had to be corrected during follow-up. Additionally, LVEF, LV end-systolic volume (LVESV), and parameters for mechanical atrioventricular and inter- and intraventricular dyssynchrony were assessed by echocardiography (ACUSON Sequoia 512; Siemens Medical Systems).
Definition of Response and Nonresponse
According to previous reports, response to CRT was defined as clinical improvement of a minimum of 1 NYHA class and a reduction of at least 15% for of LVESV, indicating significant reverse remodeling (3). If one or both of the mentioned criteria were not fulfilled, the patient was regarded as a CRT nonresponder.
Electrocardiogram-Gated 18F-FDG PET/CT
All PET/CT investigations were performed on a hybrid PET/CT scanner equipped with a 64-slice CT (Biograph 64; Siemens Medical Systems) after intravenous injection of 370 MBq of 18F-FDG. In the standard protocol, all patients were pretreated with acipimox at 120 min before 18F-FDG injection. Diabetic patients received 18F-FDG after hyperinsulinemic euglycemic clamping; all others received 18F-FDG at 60 min after oral glucose loading (4). Forty minutes after 18F-FDG injection, a low-dose CT scan of the thorax was obtained for attenuation correction of the PET data and for 3-dimensional (3D) image fusion of the pacemaker leads, followed by a 15-min electrocardiogram-gated emission recording.
Image Analysis
PET/CT images were analyzed in 3 steps by consensus of 2 experienced physicians, who were unaware of the patients’ clinical data and their response to CRT.
In the first step, nonviable myocardial areas were detected and quantified using a dedicated analysis tool (5). LV 18F-FDG polar maps were normalized to the highest uptake in the myocardium and—according to previous studies (6,7)—a lower threshold of 50% was used to identify viable tissue. Accordingly, the total area of scar tissue was calculated as percentage of the LV myocardium.
In the second step, LV phase analysis was performed from the electrocardiogram-gated PET dataset using the QGS 2008 software package (Cedars Sinai). The measurement of phase data allows the description of uniformity and coincidence of the onset of wall movement throughout the cardiac cycle (8), which is related to LV dyssynchrony or synchrony. Histogram bandwidth (95% confidence interval) and SD, as well as the global phase entropy, which reflects the uniformity of movement, were recorded.
In the third step, the 18F-FDG PET and low-dose CT images were fused 3-dimensionally using a dedicated software package (Hybrid Viewer, version 1.3; Hermes Medical Solutions). Placement of the tip of the LV lead was assigned to viable or nonviable myocardium (>5% of the left ventricle).
Impact of 18F-FDG PET/CT on Change of Therapy
Change of therapy was noted if a therapy decision was based on the results of the PET/CT scan.
RESULTS
Study Population
Baseline characteristics of the 14 patients are described in Table 1. Eight of 14 patients had known coronary artery disease with revascularization procedures before CRT implantation. Two of the 8 patients had revascularization procedures after CRT (Supplemental Table 1 [available online only at http://jnm.snmjournals.org]); both were classified as nonresponders at 6 mo after CRT and remained nonresponsive after revascularization.
Baseline Characteristics for Study Cohort and Subcohorts of Responders and Nonresponders
Clinical Response to CRT
Compared with the group of clinical responders, the nonresponders showed significant differences in echocardiography. Although LVEF in responder patients increased by 15% ± 11%, corresponding values were stable in nonresponders (−1% ± 7%; P = 0.003). Furthermore, the 2 groups differed significantly regarding the change of LVESV after therapy (responders, −82 ± 37 mL; nonresponders, +1 ± 24 mL; P = 0.001), decrease of brain natriuretic peptide (responders, −454 ± 416 pg/mL; nonresponders, −68 ± 373 pg/mL; P = 0.01), and change of NYHA class (responders, −1.0 ± 0.0; nonresponders, +0.1 ± 0.4; P < 0.05). Remaining intraventricular dyssynchrony of the left ventricle was observed in 7 patients (5 nonresponders and 2 responders) (Table 1).
PET/CT Scar Mapping and Image Fusion
LV myocardial scar burden was higher in nonresponders (30% ± 21%) than in responders (10% ± 8%; P < 0.05). 3D image fusion of PET with the pacemaker leads in CT showed the LV lead position in an area of absent 18F-FDG uptake in 4 patients. All 4 were clinical nonresponders and had no evidence of reverse remodeling during follow-up echocardiography, as indicated by their unchanged LVESV, in contrast to the 28% ± 21% decrease in responders.
There was no obvious association between lead position in viable myocardial areas and persistent dyssynchrony in echocardiography, but pacemaker leads in all CRT responders were positioned in areas with preserved 18F-FDG uptake (Figs. 1 and 2; Supplemental Video).
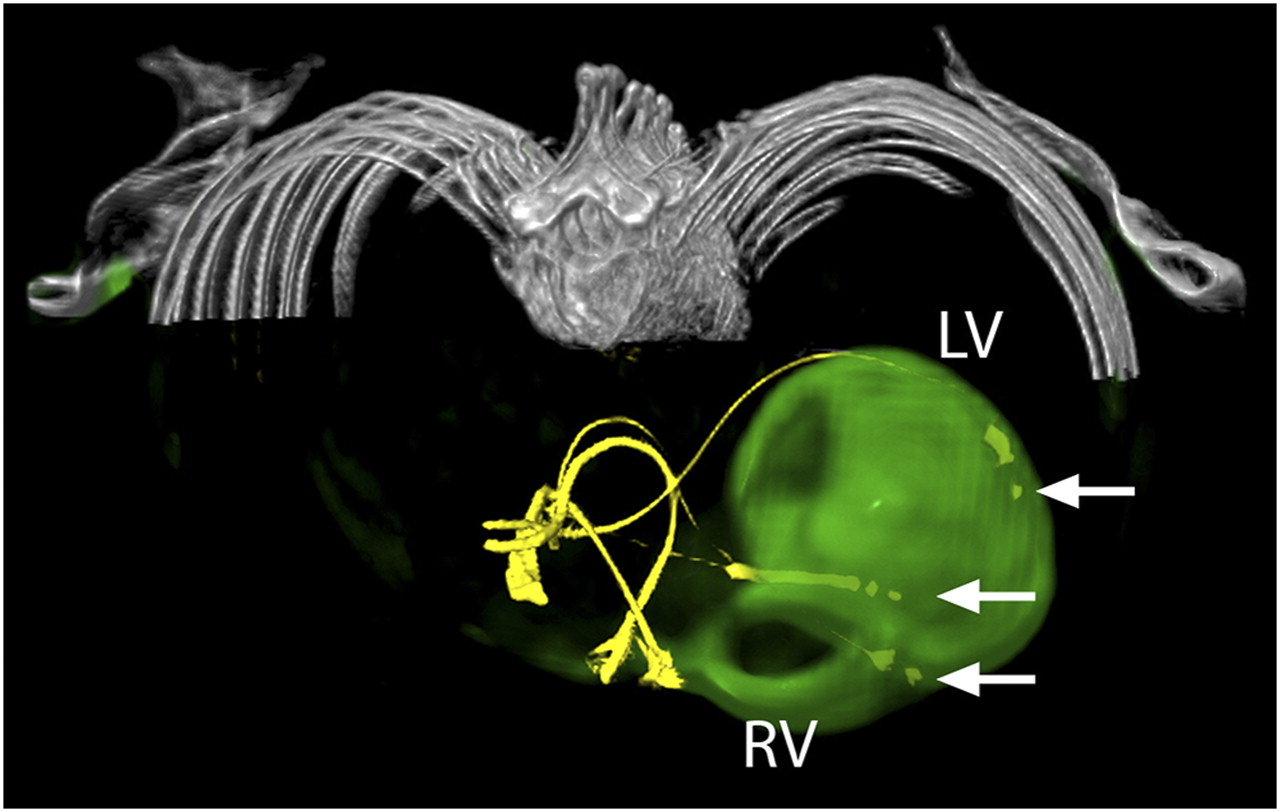
LV lead position in viable myocardium. CT and 3D fused 18F-FDG PET/CT image of patient 5, who was rated as responder to CRT. Image shows attenuation-corrected CT images, with leads of both implantable cardioverter defibrillator and biventricular pacemaker in yellow and PET information in green. There is no relevant scar burden close to catheter lead in lateral wall of left ventricle. Right ventricle is enlarged and shows slight 18F-FDG uptake. Tips of pacemaker leads are marked with arrows. LV = left ventricle; RV = right ventricle.
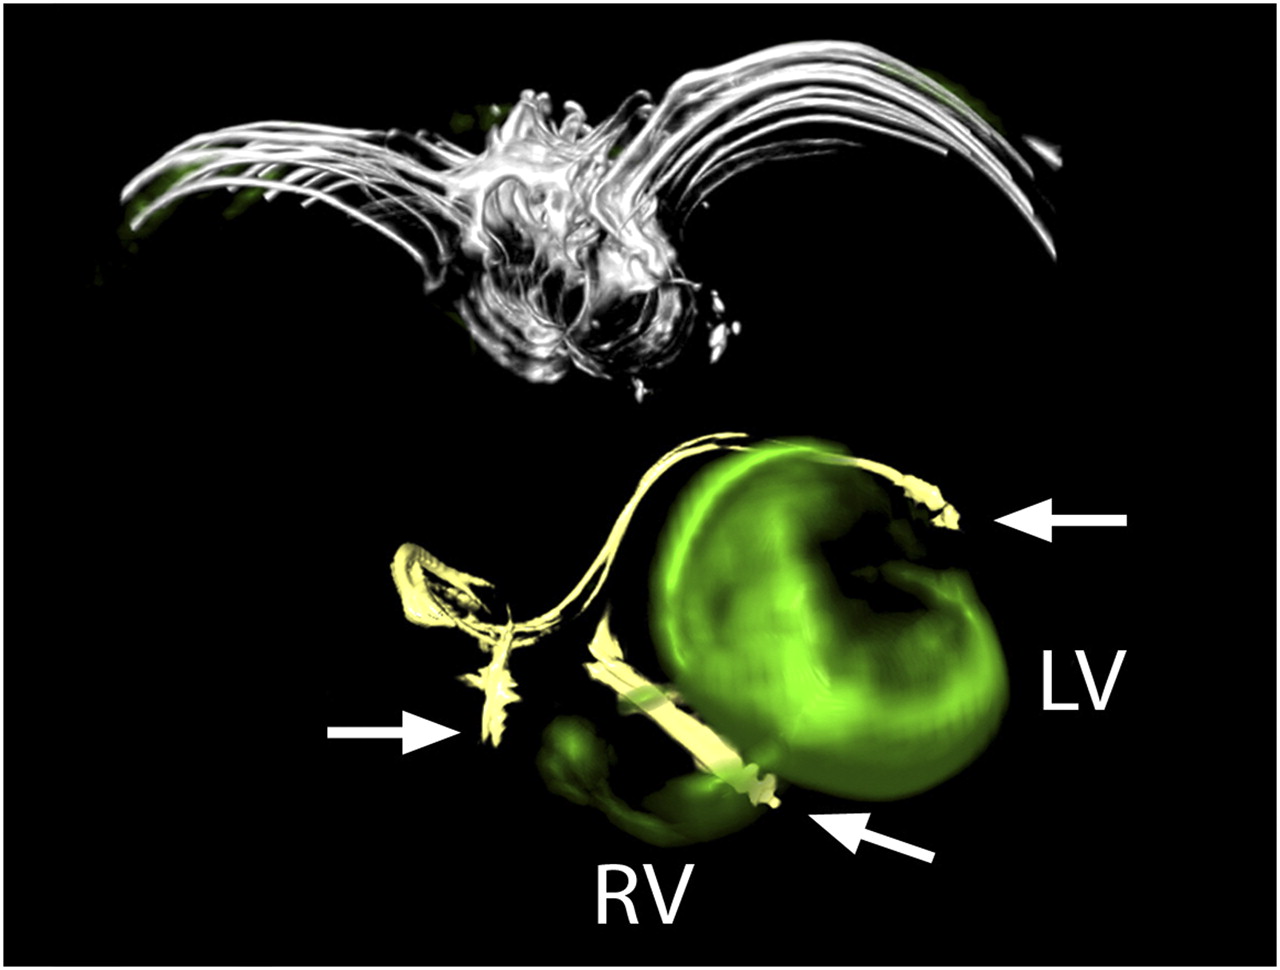
LV lead position in nonviable myocardium. CT and 3D fused PET/CT image of patient 13, who was rated as nonresponder to CRT. Image shows attenuation-corrected CT images, with leads of biventricular pacemaker in yellow and PET information in green. Huge amount of left ventricle, especially lateral wall where tip of LV lead was located, shows absent glucose metabolism. right ventricle shows slight 18F-FDG uptake. Catheter leads are marked with arrows. LV = left ventricle; RV = right ventricle.
Gated PET Phase Analysis
In the phase analysis, global phase entropy was significantly lower in the clinical responders than in the nonresponders (P = 0.038). Phase histogram bandwidth and SD showed no significant difference between the 2 groups (Table 1). There were no significant differences in bandwidth, phase SD, or global entropy between groups with the lead position in viable or nonviable myocardium (Fig. 3).
Influence on Therapy Decision
The results of PET/CT directly affected therapy decisions in 4 of 7 (57%) nonresponders. In 1 nonresponder, the LV lead was repositioned to a region of viable myocardium (identified by PET/CT). Ongoing progression of heart failure could be reversed without substantial change of echocardiographic parameters at the 3-mo follow-up. In another patient, a substantial increase of mitral regurgitation was detected in follow-up echocardiography. PET/CT showed extensive scarring in the lateral and posterolateral LV wall, which predicted poor response to transvenous or epicardial lead revision; consequently, a percutaneous mitral valve reconstruction was performed, and the patient showed a reduction of 12% in LVESV and clinical improvement by 1 NYHA class at 3 mo after the procedure. In 2 further patients, there was no evident means for CRT optimization, because of either persistent intraventricular dyssynchrony, despite placement of the LV lead tip in an adequate and viable position, or insufficient heart function, despite the absence of intraventricular dyssynchrony and the LV lead tip in a scar area. Both patients were referred for heart transplantation, which was completed at 1 and 5 mo after PET/CT.
DISCUSSION
Scar Burden and LV Lead Position
Prior studies have demonstrated a relationship between the extent of global LV scar burden measured by 18F-FDG PET, SPECT, or MRI and the response to CRT (7,9–16). In addition to confirming an association between response and scar burden, our exploitation of the additional CT modality revealed positioning of the LV pacemaker in nonviable myocardial areas for 4 of 7 nonresponders. In contrast, none of the 7 responders had a pacemaker lead positioned within scar tissue. Furthermore, it is remarkable that we found 3 nonresponders with global LV scar burden exceeding 15%, who nonetheless had their LV lead positioned in viable myocardium. Thus, individual global scar burden and the particulars of lead placement are key factors influencing response to CRT; all patients with global scar burden less than 15% and LV lead in viable myocardium were responders.
There are previous studies demonstrating that posterolateral (17) or lateral (18) scar locations correlate with worse CRT response. In addition, Riedlbauchová et al. (6) endeavored to determine the LV lead position based on chest radiographs in 2 different views, with translation into a 17-segment model of the left ventricle. Remarkably, in the 25 CRT nonresponders of their study, there was a higher incidence of pacemaker leads placed within scar tissue (47%) than of those placed within viable myocardial areas (36%), although this difference did not reach statistical significance.
Phase Analysis
An unfavorable response to CRT is associated with LV dyssynchrony (19,20), which can be assessed by methods applying phase analysis, an algorithm for quantifying the uniformity or homogeneity of LV wall contraction (8,21). We did find that our responder group had slightly lower phase entropy, which is a mathematic expression of synchrony not relying on phase similarity. Consequently, in contrast to phase bandwidth and SD (22), phase entropy is not influenced by boundary histogram bars—phase entropy is a reflection of the variability of synchrony during the ventricular contraction. O'Connell et al. recently reported that LV entropy measurements in a gated blood-pool SPECT study were superior to phase SD for distinguishing healthy subjects from patients with LV aneurysm or diffuse or regional ventricular dysfunction (21). Our finding of differing phase entropy, but not bandwidth or phase SD between responder and nonresponder groups, could reflect partial resynchronization of ventricular contraction, despite nonoptimal lead positions.
Clinical Significance of PET/CT in CRT Nonresponders
After exclusion of major potential causes for inadequate CRT response, functional characterization of the LV and lead target region were provided by PET/CT. In all patients, the viability of the region surrounding the LV lead could be interpreted unambiguously, which supported the decision to make revision of the LV lead or referral to transplantation.
The main advantage presented by gated PET/CT lies in the objective global assessment of all LV segments, which is not usually possible by echocardiography, a procedure that remains invaluable for the assessment of atrioventricular and interventricular dyssynchrony. Examination of a larger number of CRT nonresponders might substantiate a reversal of clinical course by PET/CT-guided LV lead revision.
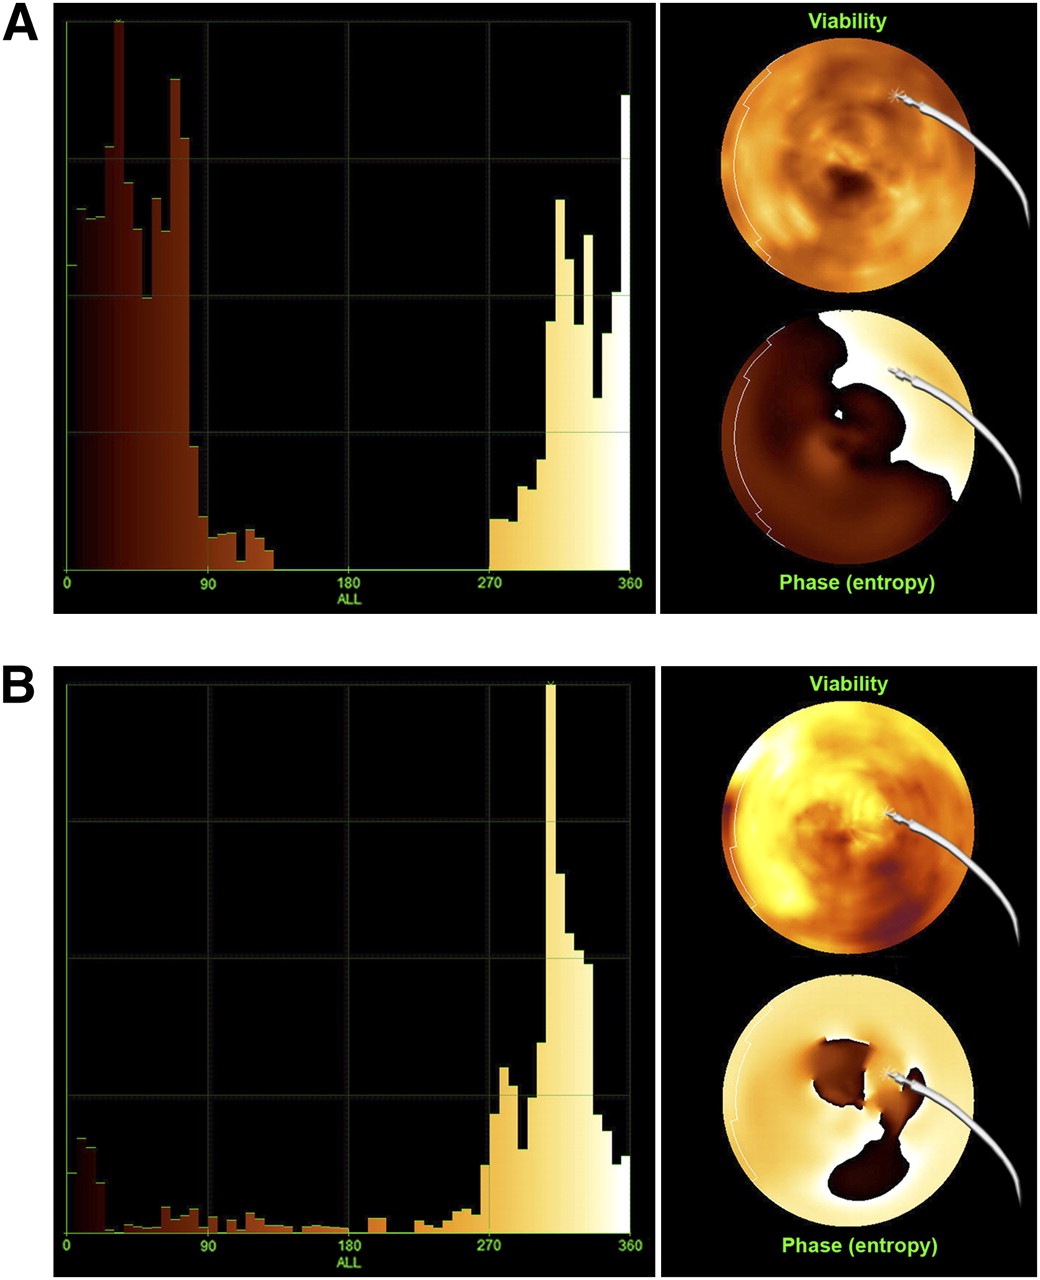
Shown are phase histogram (left) and bull's eye (right) of LV glucose metabolism (upper polar map) and global phase entropy (lower polar map) in relation to LV pacemaker lead position in nonresponder (patient 2; A) and responder (patient 5; B) to CRT. Compared with responder patient, nonresponder shows broader bandwidth in phase histogram and LV lead located in area of nonviable myocardium and high phase entropy.
Limitations
Our results reflect a single-center pilot study with a limited number of both responder and nonresponder patients. Furthermore, 18F-FDG PET/CT was performed at a mean of 32 mo after CRT. Because of this long period, included patients reflected a congestive heart failure population, preselected for survivors.
CONCLUSION
18F-FDG PET/CT with 3D image fusion showed that CRT nonresponders had higher global scar burden, a higher incidence of LV lead placement within scar tissue, and a higher rate of intraventricular dyssynchrony than did responders. Intraventricular dyssynchrony was best described by phase entropy, a parameter considering the variability of dyssynchrony within the ventricular contraction phase. Consideration of all variables provided the basis for rational changes in therapy management in most nonresponders.
Acknowledgments
A substantial part of this work originated from the doctoral thesis of Franziska Schuessler. We thank Andreas Elsner from Hermes Medical Solutions for generating 3D fused images.
Footnotes
↵* Contributed equally to this work.
- © 2011 by Society of Nuclear Medicine
REFERENCES
- Received for publication May 3, 2010.
- Accepted for publication September 10, 2010.


