


Article Figures & Data
Figures
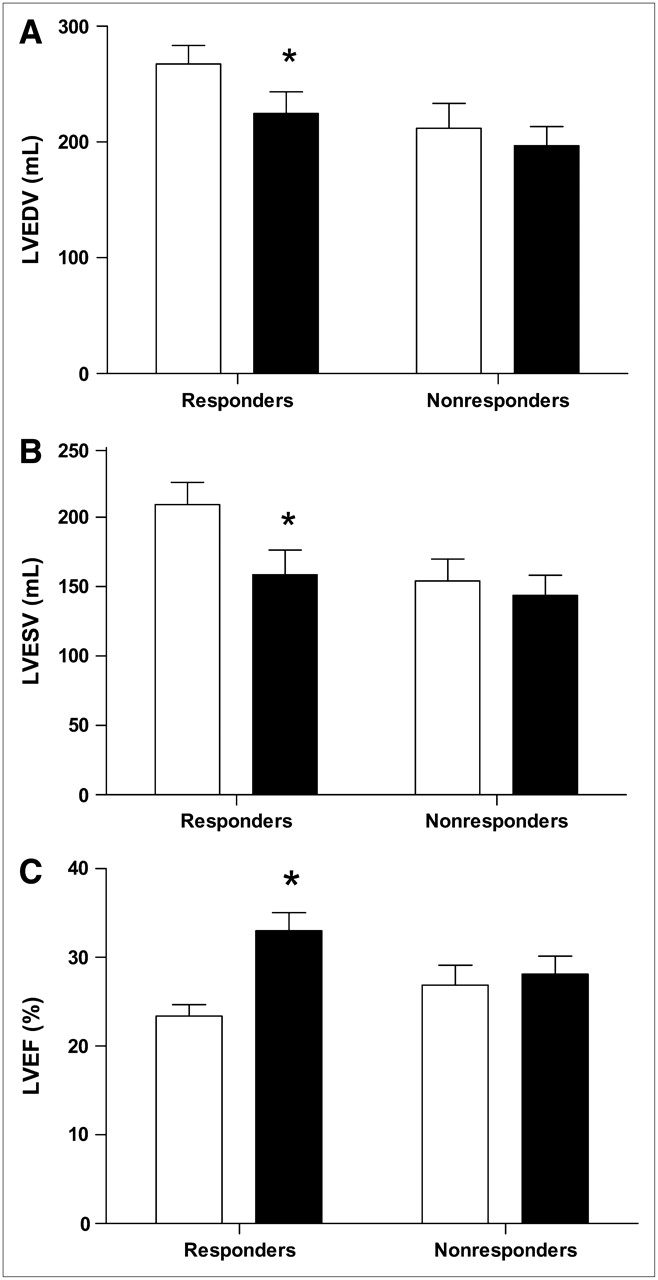
- FIGURE 1.
(A) Changes in LVEDV from baseline (white bars) to 6-mo follow-up (black bars) in responders and nonresponders to CRT. LVEDV decreased significantly in responders and remained unchanged in nonresponders. *P < 0.0001 baseline vs. 6-mo follow-up. (B) Changes in LVESV from baseline (white bars) to 6-mo follow-up (black bars) in responders and nonresponders to CRT. LVESV decreased significantly in responders and remained unchanged in nonresponders. *P < 0.0001 baseline vs. 6-mo follow-up. (C) Changes in LVEF from baseline (white bars) to 6-mo follow-up (black bars) in responders and nonresponders to CRT. LVEF increased significantly in responders and remained unchanged in nonresponders. *P < 0.0001 baseline vs. 6-mo follow-up.
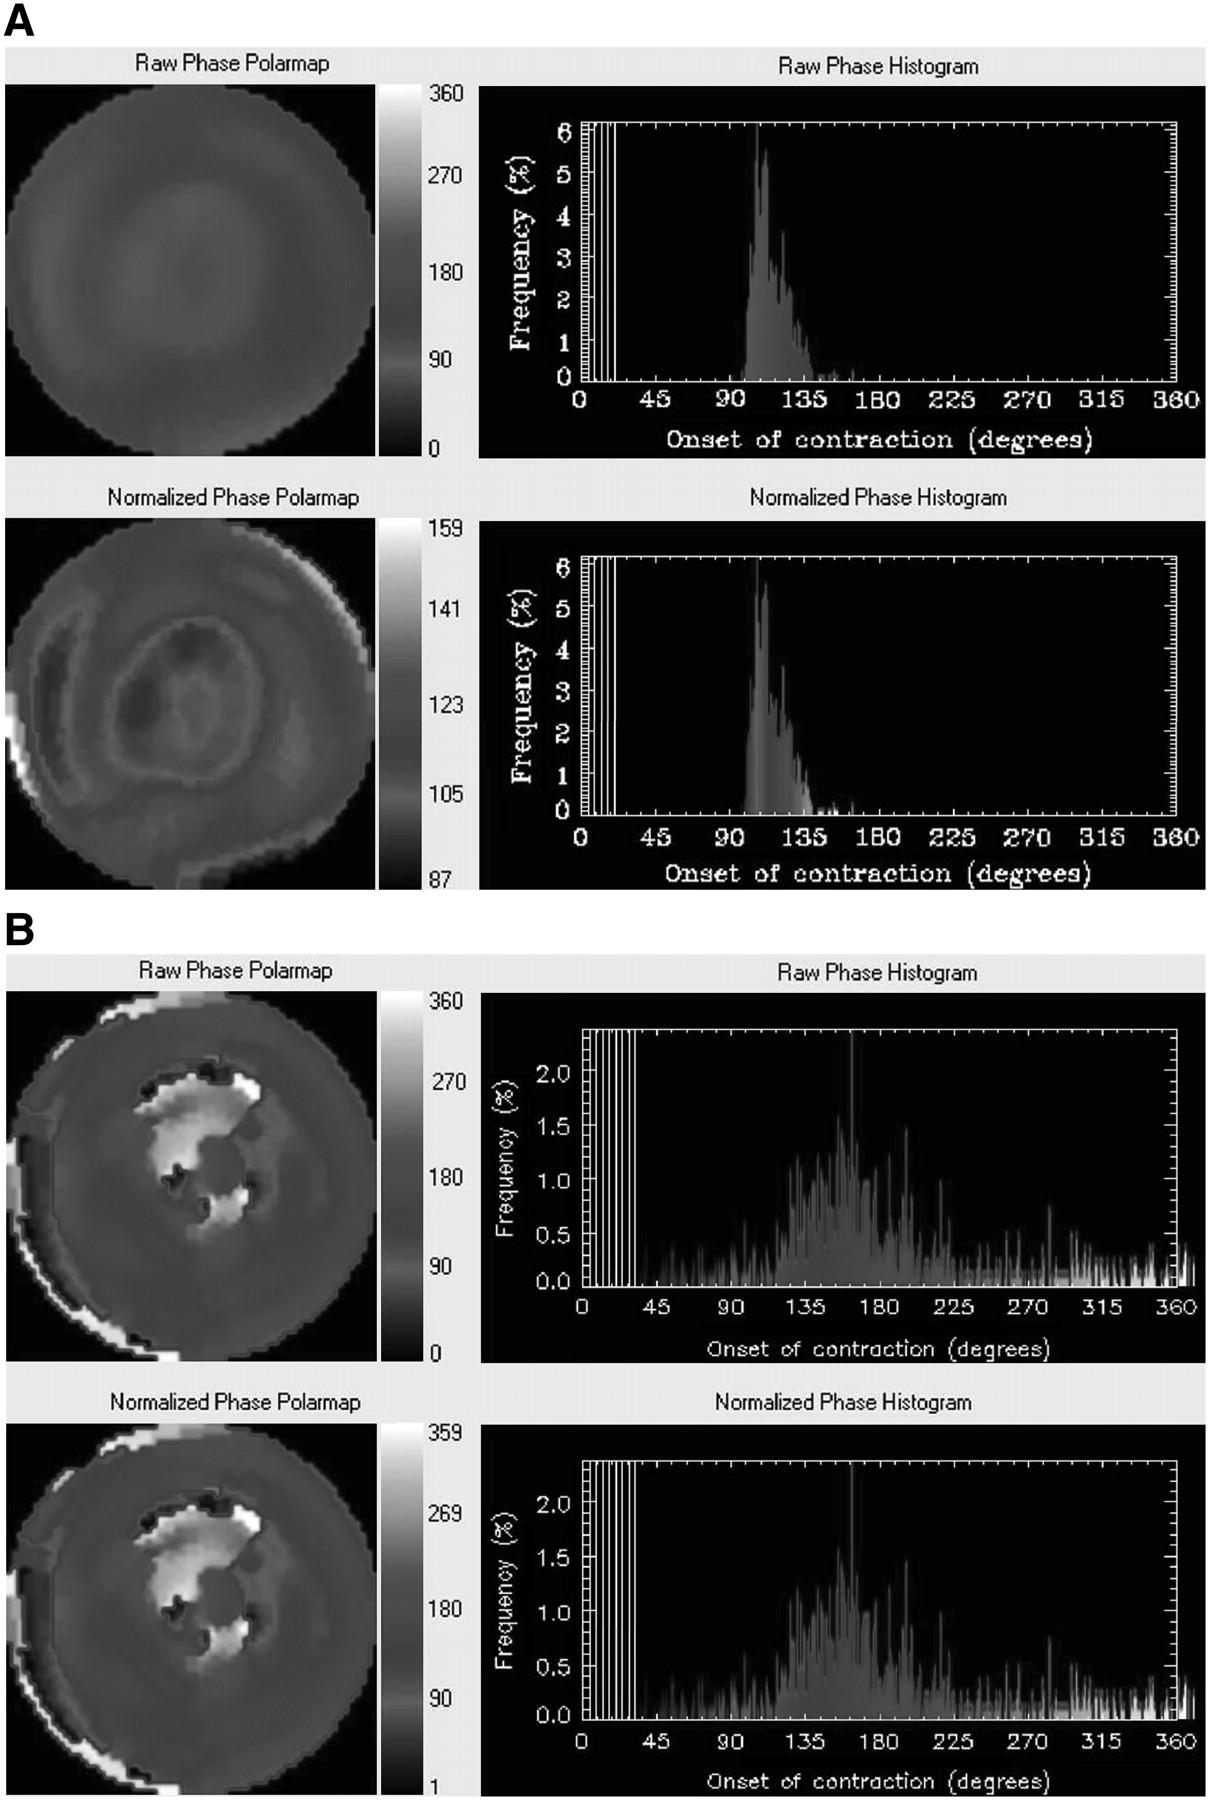
- FIGURE 2.
(A) Example of phase analysis in a nonresponder to CRT. At baseline, no LV dyssynchrony with phase analysis was present in this patient. Nonnormalized (top panel) and normalized (bottom panel) phase distributions are relatively uniform and the corresponding phase histograms are highly peaked, narrow distributions. After 6-mo follow-up, no response to CRT was observed, as reflected by deterioration in NYHA functional class from 3 to 4. In addition, LVEF remained unchanged (baseline [32%] vs. 6-mo follow-up [33%]). (B) Example of phase analysis in a responder to CRT. In this patient, LV dyssynchrony with phase analysis was present at baseline. Nonnormalized (top panel) and normalized (bottom panel) phase distributions show substantial nonuniformity, whereas the corresponding phase histograms are widely spread distributions. After 6-mo follow-up, this patient improved in NYHA functional class from 3 to 2, indicating response to CRT. In addition, LVEF increased from 27% at baseline to 33% at 6-mo follow-up.
- FIGURE 3.
ROC analysis of histogram bandwidth demonstrated a sensitivity and specificity of 70% to predict response to CRT at cutoff level of 135° for histogram bandwidth.
- FIGURE 4.
ROC curve analysis of phase SD demonstrated a sensitivity and specificity of 74% to predict response to CRT at cutoff level of 43° for phase SD.
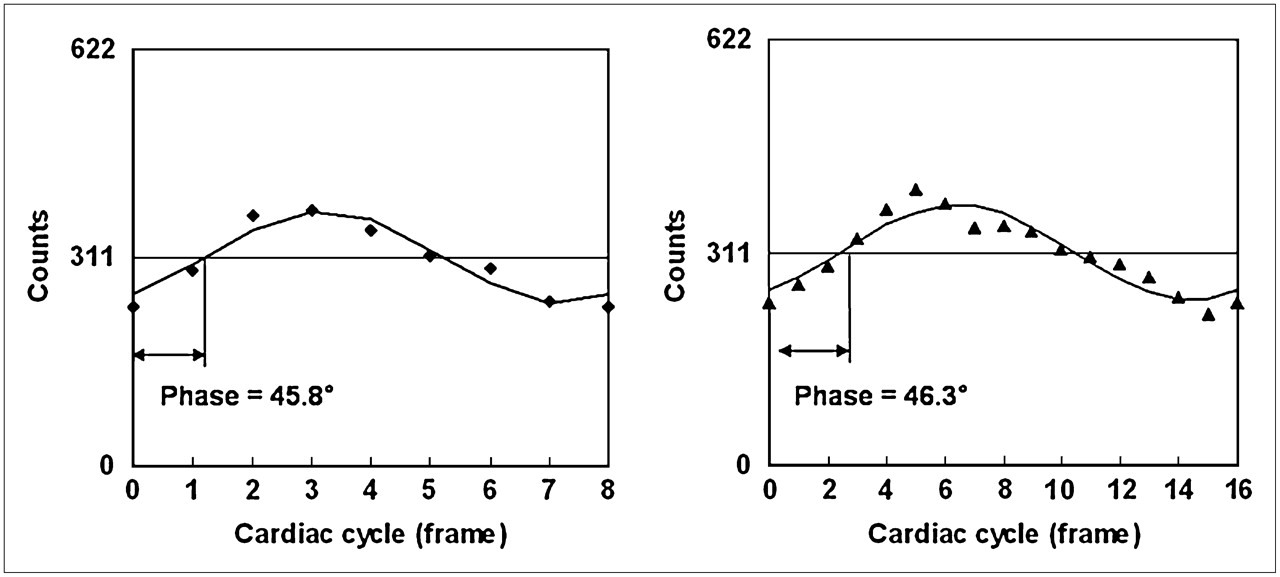
- FIGURE 5.
Comparison of difference of phases obtained when 8 frames per cycle (left panel) or 16 frames per cycle (right panel) data acquisition are used. Points in right panel are counts of a pixel arbitrarily chosen from the anterior region of polar maps given by a set of gated (16 frames per cycle) short-axis images. These points are regional maximum counts and their variations represent wall thickness changes at region over the cardiac cycle. Points in left panel are down-sampled from points in right panel. Curves are the first harmonics that approximate wall thickness changes during the cardiac cycle. With first harmonic approximation, phase difference between 8 frames per cycle and 16 frames per cycle is very small at −0.5° (360° corresponds to 1 cardiac cycle).


Tables
Clinical characteristic Value Age (y) 67 ± 9 Men 31 (74) Ischemic cardiomyopathy 28 (67) Idiopathic dilated cardiomyopathy 14 (33) Previous infarction 24 (57) Q wave on electrocardiogram 18 (43) QRS duration (ms) 153 ± 32 2D echocardiographic variables LVEDV (mL) 251 ± 87 LVESV (mL) 193 ± 83 LVEF (%) 24 ± 7 6-min walk test (m) 330 ± 109 Quality-of-life score 37 ± 18 NYHA class 2.9 ± 0.4 Data are presented as mean ± SD or as number (%).
Baseline characteristic Responders Nonresponders P value Age (y) 67 ± 8 66 ± 11 NS Men 22 (73) 9 (75) NS Ischemic cardiomyopathy 19 (63) 9 (75) NS Idiopathic dilated cardiomyopathy 11 (37) 3 (25) NS Previous infarction 17 (57) 7 (58) NS Q wave on electrocardiogram 11 (37) 7 (58) NS 2D echocardiographic variables LVEDV (mL) 267 ± 88 212 ± 74 NS LVESV (mL) 209 ± 88 154 ± 55 NS LVEF (%) 23 ± 7 27 ± 8 NS 6-min walk test (m) 345 ± 104 289 ± 117 NS Quality-of-life score 35 ± 17 43 ± 18 NS NYHA class 2.9 ± 0.3 2.8 ± 0.6 NS GMPS variables Histogram bandwidth (°) 175 ± 63 117 ± 51 <0.01 Phase SD (°) 56.3 ± 19.9 37.1 ± 14.4 <0.01 NS = not statistically significant.
Data are presented as mean ± SD or as number (%).


Jump to section
Related Articles
Cited By...
- Quantitative clinical nuclear cardiology, part 2: Evolving/emerging applications
- The Prognostic Value of Diastolic and Systolic Mechanical Left Ventricular Dyssynchrony Among Patients With Coronary Heart Disease
- Utility of Equilibrium Radionuclide Angiogram-Derived Measures of Dyssynchrony to Predict Outcomes in Heart Failure Patients Undergoing Cardiac Resynchronization Therapy
- Presence of Postsystolic Shortening Increases the Likelihood of Coronary Artery Disease: A Rest Electrocardiography-Gated Myocardial Perfusion SPECT Study
- On the Importance of Image Gating for the Assay of Left Ventricular Mechanical Dyssynchrony Using SPECT
- Imaging for Planning of Cardiac Resynchronization Therapy
- A Prospective Pilot Study to Evaluate the Relationship Between Acute Change in Left Ventricular Synchrony After Cardiac Resynchronization Therapy and Patient Outcome Using a Single-Injection Gated SPECT Protocol
- Nonechocardiographic Imaging in Evaluation for Cardiac Resynchronization Therapy
- Long-term prognostic value of left ventricular dyssynchrony assessment by phase analysis from myocardial perfusion imaging
- Left ventricular dyssynchrony assessment by phase analysis from gated myocardial perfusion SPECT: moving beyond conventional criteria
- Agreement Is Poor Among Current Criteria Used to Define Response to Cardiac Resynchronization Therapy
- Echocardiography and Noninvasive Imaging in Cardiac Resynchronization Therapy: Results of the PROSPECT (Predictors of Response to Cardiac Resynchronization Therapy) Study in Perspective
- Quantitative Gated SPECT-Derived Phase Analysis on Gated Myocardial Perfusion SPECT Detects Left Ventricular Dyssynchrony and Predicts Response to Cardiac Resynchronization Therapy
- Imaging Cardiac Resynchronization Therapy
- The Year in Cardiac Imaging
- Automatic Global and Regional Phase Analysis from Gated Myocardial Perfusion SPECT Imaging: Application to the Characterization of Ventricular Contraction in Patients with Left Bundle Branch Block
- Can LV Dyssynchrony as Assessed with Phase Analysis on Gated Myocardial Perfusion SPECT Preferably Predict Response to CRT?
- Reply: Can LV Dyssynchrony as Assessed with Phase Analysis on Gated Myocardial Perfusion SPECT Preferably Predict Response to CRT?