


Abstract
Cardiac resynchronization therapy (CRT) is now a well-recognized therapeutic option for patients with end-stage heart failure. However, not all patients respond to CRT, and, therefore, preimplantation identification of responders is desirable. The aim of the present study was to investigate whether the degree of left ventricular (LV) dyssynchrony, as assessed with phase analysis from gated myocardial perfusion SPECT (GMPS), can predict which patients will respond to CRT. Methods: Forty-two patients with severe heart failure, depressed LV ejection fraction, and wide QRS complex were prospectively included for implantation of a CRT device and underwent GMPS and 2-dimensional echocardiography as part of the clinical protocol. Clinical status was evaluated using the New York Heart Association (NYHA) classification, 6-min walk test, and quality-of-life score. The histogram bandwidth and phase SD (parameters indicating LV dyssynchrony) were assessed from GMPS, and the clinical status and echocardiographic variables were reassessed at 6-mo follow-up. Results: Responders (71%) and nonresponders (29%) had comparable baseline characteristics, except for histogram bandwidth (175° ± 63° vs. 117° ± 51° [P < 0.01]) and phase SD (56.3° ± 19.9° vs. 37°.1 ± 14.4° [P < 0.01]), which were significantly larger in responders compared with nonresponders. Moreover, receiver-operating-characteristic curve analysis demonstrated an optimal cutoff value of 135° for histogram bandwidth (sensitivity and specificity of 70%) and of 43° for phase SD (sensitivity and specificity of 74%) for the prediction of response to CRT. Conclusion: Response to CRT is related to the presence of LV dyssynchrony assessed by phase analysis with GMPS. A cutoff value of 135° for histogram bandwidth and of 43° for phase SD could be used to predict response to CRT. Larger prospective studies are warranted to confirm the present findings.
In the recent years, cardiac resynchronization therapy (CRT) has emerged as a new treatment strategy for a subgroup of patients with end-stage heart failure, a depressed left ventricular ejection fraction (LVEF), and wide QRS complex on the surface electrocardiogram (>120 ms) (1). Although initial studies reported promising results, approximately 20%–30% of the patients do not respond to CRT (1–4). Recent data have indicated that LV dyssynchrony may be mandatory for response to CRT (5,6). A wide QRS complex may not adequately indicate LV dyssynchrony, as 30% of the patients with a wide QRS complex (>120 ms) do not have substantial LV dyssynchrony on echocardiography whereas, on the other hand, approximately one third of the patients with a narrow QRS appear to have substantial LV dyssynchrony on echocardiography (7,8).
At present, various imaging techniques are available for the assessment of LV dyssynchrony, including echocardiography with tissue Doppler imaging (TDI), or strain imaging, and MRI (9,10). Since the early 1980s, the possibility of assessing dyssynchronous cardiac contraction with nuclear imaging has been explored. Most studies were performed with gated blood-pool ventriculography for evaluation of cardiac dyssynchrony. Although this technique allows assessment of LVEF in a very reliable manner (11,12), it does not provide information on the presence of ischemia or myocardial infarction. Recently, a new technique was developed to allow phase analysis from gated myocardial perfusion SPECT (GMPS). GMPS is used for assessment of myocardial perfusion but also provides information on regional wall thickening (13,14). A count-based method has been developed to extract amplitude (systolic wall thickening) and phase from the regional LV count changes throughout the cardiac cycle (15). The phase information is related to the time interval when a region in the 3-dimensional (3D) LV myocardial wall starts to contract. It provides information as to how uniform or inhomogeneous is the distribution of these time intervals for the entire LV—that is, a measure of LV (dys)synchrony (15).
The purpose of this study was to investigate whether the degree of LV dyssynchrony, as assessed with phase analysis from GMPS, can predict which patients will respond to CRT.
MATERIALS AND METHODS
The study population consisted of 42 patients with heart failure who were prospectively included for implantation of a CRT device. Patients with previously implanted pacemakers were included. Selection criteria for CRT were severe heart failure (New York Heart Association [NYHA] class 3 or 4), depressed LVEF (<35%), and prolonged QRS duration (>120 ms).
The study protocol was as follows: Before implantation of the CRT device, resting GMPS with 99mTc tetrofosmin was performed to assess LV dyssynchrony using phase analysis (15).
Next, clinical status was evaluated, which included the assessment of NYHA functional class, 6-min walk test, and quality-of-life score (using the Minnesota Quality of Life Questionnaire) (16). In addition, 2-dimensional (2D) echocardiography was performed for the assessment of LV volumes and LVEF. Clinical status and echocardiographic variables were reassessed at 6-mo follow-up.
Gated SPECT
Assessment of LV dyssynchrony from GMPS using phase analysis was recently reported (15). GMPS imaging with 99mTc-tetrofosmin (500 MBq, injected at rest) was performed using a triple-head SPECT camera system (GCA 9300/HG; Toshiba Corp.) equipped with low-energy, high-resolution collimators. Around the 140-keV energy peak of 99mTc-tetrofosmin, a 20% window was used. A total of 90 projections (step-and-shoot mode; 35 s per projection; imaging time, 23 min) were obtained over a 360° circular orbit, according to standard GMPS imaging protocol in our center. GMPS data acquisition involved 16 frames per cardiac cycle. Data were stored in a 64 × 64 matrix. Data were reconstructed by filtered backprojection and then reoriented to yield gated short-axis images. These images were then submitted to the Emory Cardiac Toolbox (Emory University/Syntermed, Atlanta, Ga) for phase analysis (15). The phase of the regional LV count changes throughout the cardiac cycle is an important indicator of the LV function. Because it is related to the time interval when a region in the 3D LV myocardial wall starts to contract (presumably, onset of mechanical contraction), it provides information on the uniformity of the distribution of these time intervals for the entire LV—that is, a measure of ventricular synchrony. The phase analysis tool of the Emory Cardiac Toolbox (Emory University/Syntermed) extracts a phase distribution from a gated SPECT study representing the regional LV onset of mechanical contraction in 3D. The phase distribution can be displayed in a polar map or in 3D and used to generate a phase histogram.
The following 2 quantitative indices were calculated from the phase arrays of all patients: (i) histogram bandwidth, which includes 95% of the elements of the phase distribution, and (ii) phase SD, which is the SD of the phase distribution (15). From the phase polar maps the site of latest activation was identified (4 regions were evaluated, including anterior, inferior, lateral, and septal). The region with the latest activation had larger phases and appeared in the phase polar map as a brighter region.
In a healthy individual, the ventricle contracts in a coordinated way and most of the myocardial segments have the same or similar phases. Thus, the phase distribution is nearly uniform and the phase histogram is a highly peaked, narrow distribution. As the LV mechanical synchrony worsens, the phase SD and histogram bandwidth are expected to increase.
2D Echocardiography
Two-dimensional echocardiography was performed before CRT implantation and at 6-mo follow-up. Patients were imaged in the left lateral decubitus position with a commercially available system (Vingmed Vivid Seven; GE-Vingmed). Images were acquired in the parasternal view and apical 2- and 4-chamber views using a 3.5-MHz transducer at a depth of 16 cm. Standard 2D and color Doppler data, triggered to the QRS complex, were saved in cine-loop format. LV end-systolic volume (LVESV) and LV end-diastolic volume were derived from the conventional apical 2- and 4-chamber views, and LVEF was calculated using the biplane Simpson's rule (17).
CRT Implantation
For positioning of the LV lead, a coronary sinus venogram was obtained using a balloon catheter, followed by the insertion of the LV pacing lead. An 8-French guiding catheter was used to position the LV lead in the coronary sinus. The preferred position was a lateral or posterolateral vein (18). The right atrial and ventricular leads were positioned conventionally. All leads were connected to a dual-chamber biventricular implantable cardioverter defibrillator (ICD).
Statistical Analysis
Results are presented as mean ± SD. Continuous data were compared using the paired or unpaired Student t test when appropriate. Categoric data were compared with the Wilcoxon signed rank test or with the Mann–Whitney test when appropriate. The Fisher exact test was used for proportions. Receiver-operating-characteristic (ROC) curves were analyzed to determine the optimal cutoff values of the histogram bandwidth and phase SD to predict response to CRT. For all tests, a P value < 0.05 was considered statistically significant.
RESULTS
Study Population
The baseline characteristics of the 42 patients (31 men, 67 ± 9 y) are summarized in Table 1. In total, 28 (67%) patients had ischemic cardiomyopathy, whereas 14 (33%) patients had idiopathic dilated cardiomyopathy. By definition, all patients had severe heart failure (mean NYHA functional class 2.9 ± 0.4). Thirty-six patients used diuretics (86%), 39 patients used angiotensin-converting enzyme inhibitors (93%), and 28 patients used β-blockers (67%). Echocardiographic examination showed a mean LVEDV of 251 ± 87 mL, a mean LVESV of 193 ± 83 mL, and a mean LVEF of 24% ± 7%. The mean values for the GMPS variables were as follows: histogram bandwidth, 158° ± 65°, and phase SD, 50.8° ± 20.3°. Two patients because of worsening heart failure before the 6-mo follow-up evaluation.
Clinical Characteristics of Study Population (n = 42)
CRT Implantation
CRT device and lead implantation was successful in all patients without major complications (Contak CD or Renewal [Guidant Corp.] or Insync III-CD or Marquis [Medtronic Inc.]). Two types of LV leads were used (Easytrak 4512-80 [Guidant Corp.] or Attain-SD 4189 [Medtronic Inc.]).
Clinical and Echocardiographic Response to CRT
At the 6-mo follow-up evaluation, the NYHA functional class was significantly improved (2.9 ± 0.4 to 2.0 ± 0.8 [P < 0.0001]). The 6-min walking distance increased significantly from 330 ± 109 to 395 ± 117 m (P < 0.0001). In addition, a decrease in the quality-of-life score was demonstrated (37 ± 18 to 22 ± 19 [P < 0.0001]), indicating a general improvement in the quality of life.
Moreover, reverse remodeling was observed on 2D echocardiography: The LVEDV and LVESV decreased significantly (LVEDV from 251 ± 87 to 218 ± 93 mL [P < 0.001] and LVESV from 193 ± 83 to 155 ± 87 mL [P < 0.0001]), whereas a significant improvement in LVEF was observed (from 24% ± 7% to 32% ± 10% [P < 0.0001]).
Responders and Nonresponders
After the 6-mo follow-up, 30 (71%) patients were classified as responders, according to an improvement of ≥1 NYHA functional class. On the other hand, 12 (29%) patients, of whom 2 died of worsening heart failure before the 6-mo follow-up, did not improve ≥1 NYHA functional class and were, therefore, classified as nonresponders.
At baseline, there were no significant differences in clinical characteristics between the responders and nonresponders (Table 2), except for the histogram bandwidth (175° ± 63° vs. 117° ± 51° [P < 0.01]) and phase SD (56.3° ± 19.9° vs. 37.1° ± 14.4° [P < 0.01]), which were significantly larger in responders as compared with nonresponders.
Baseline Characteristics of Responders (n = 30) vs. Nonresponders (n = 12) to CRT
The nonresponders tended to have smaller LV volumes at baseline, although these differences were not statistically significant. However, a statistically significant difference in the LV dyssynchrony variables derived from GMPS was observed.
In the responders, the mean NYHA functional class improved from 2.9 ± 0.3 to 1.7 ± 0.5, whereas it remained unchanged in the nonresponders (2.8 ± 0.6 vs. 3.0 ± 0.7, by definition).
The quality-of-life score improved from 35 ± 17 to 17 ± 16 (P < 0.0001), and the 6-min walking distance increased from 345 ± 104 to 428 ± 97 m (P < 0.0001) in the responder group, whereas no improvement in the quality-of-life score (43 ± 18 to 41 ± 18 [P = not statistically significant [NS]) or in 6-min walking distance (289 ± 117 to 284 ± 116 m [P = NS]) was noted in the nonresponders.
Moreover, a significant improvement in the echocardiographic variables was observed in the responders (Fig. 1). In particular, LVEDV decreased from 267 ± 88 to 225 ± 102 mL (P < 0.0001) and LVESV decreased from 209 ± 88 to 159 ± 97 mL (P < 0.0001); the LVEF increased significantly from 23% ± 7% to 33% ± 11% (P < 0.0001). In the nonresponders, the LVEF and LV volumes remained unchanged (Table 2; Fig. 1). An example of phase analysis in a nonresponder is shown in Figure 2A, whereas an example of phase analysis in a responder to CRT is provided in Figure 2B.
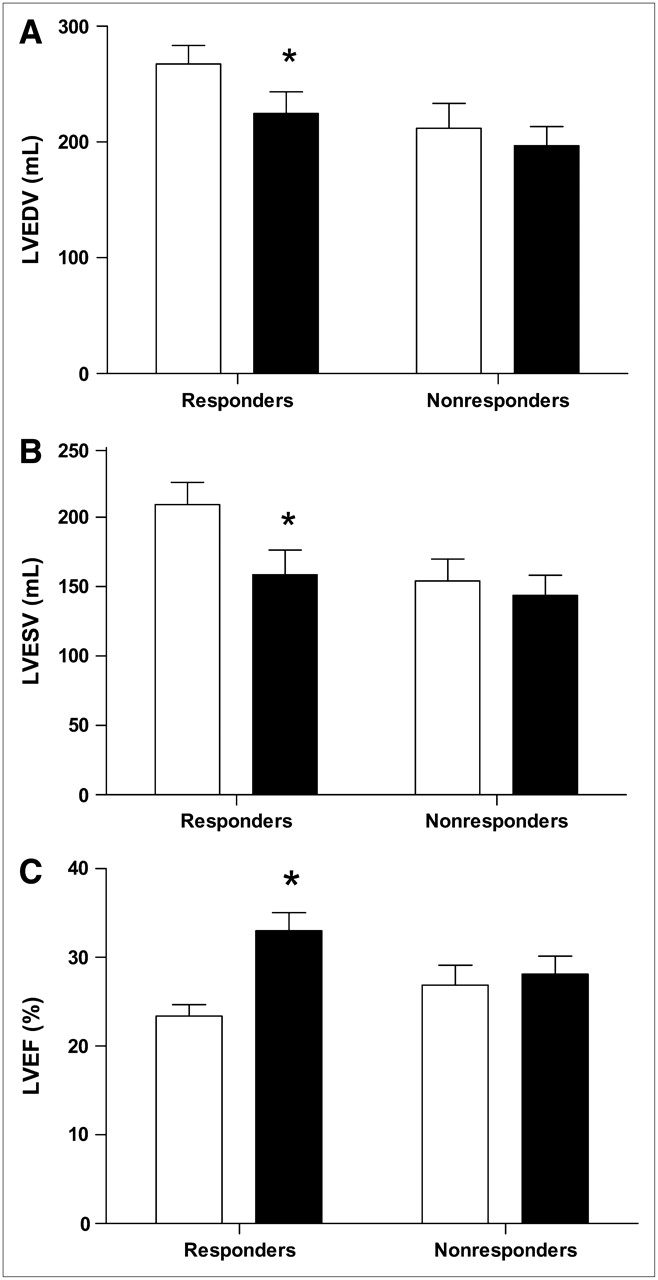
(A) Changes in LVEDV from baseline (white bars) to 6-mo follow-up (black bars) in responders and nonresponders to CRT. LVEDV decreased significantly in responders and remained unchanged in nonresponders. *P < 0.0001 baseline vs. 6-mo follow-up. (B) Changes in LVESV from baseline (white bars) to 6-mo follow-up (black bars) in responders and nonresponders to CRT. LVESV decreased significantly in responders and remained unchanged in nonresponders. *P < 0.0001 baseline vs. 6-mo follow-up. (C) Changes in LVEF from baseline (white bars) to 6-mo follow-up (black bars) in responders and nonresponders to CRT. LVEF increased significantly in responders and remained unchanged in nonresponders. *P < 0.0001 baseline vs. 6-mo follow-up.
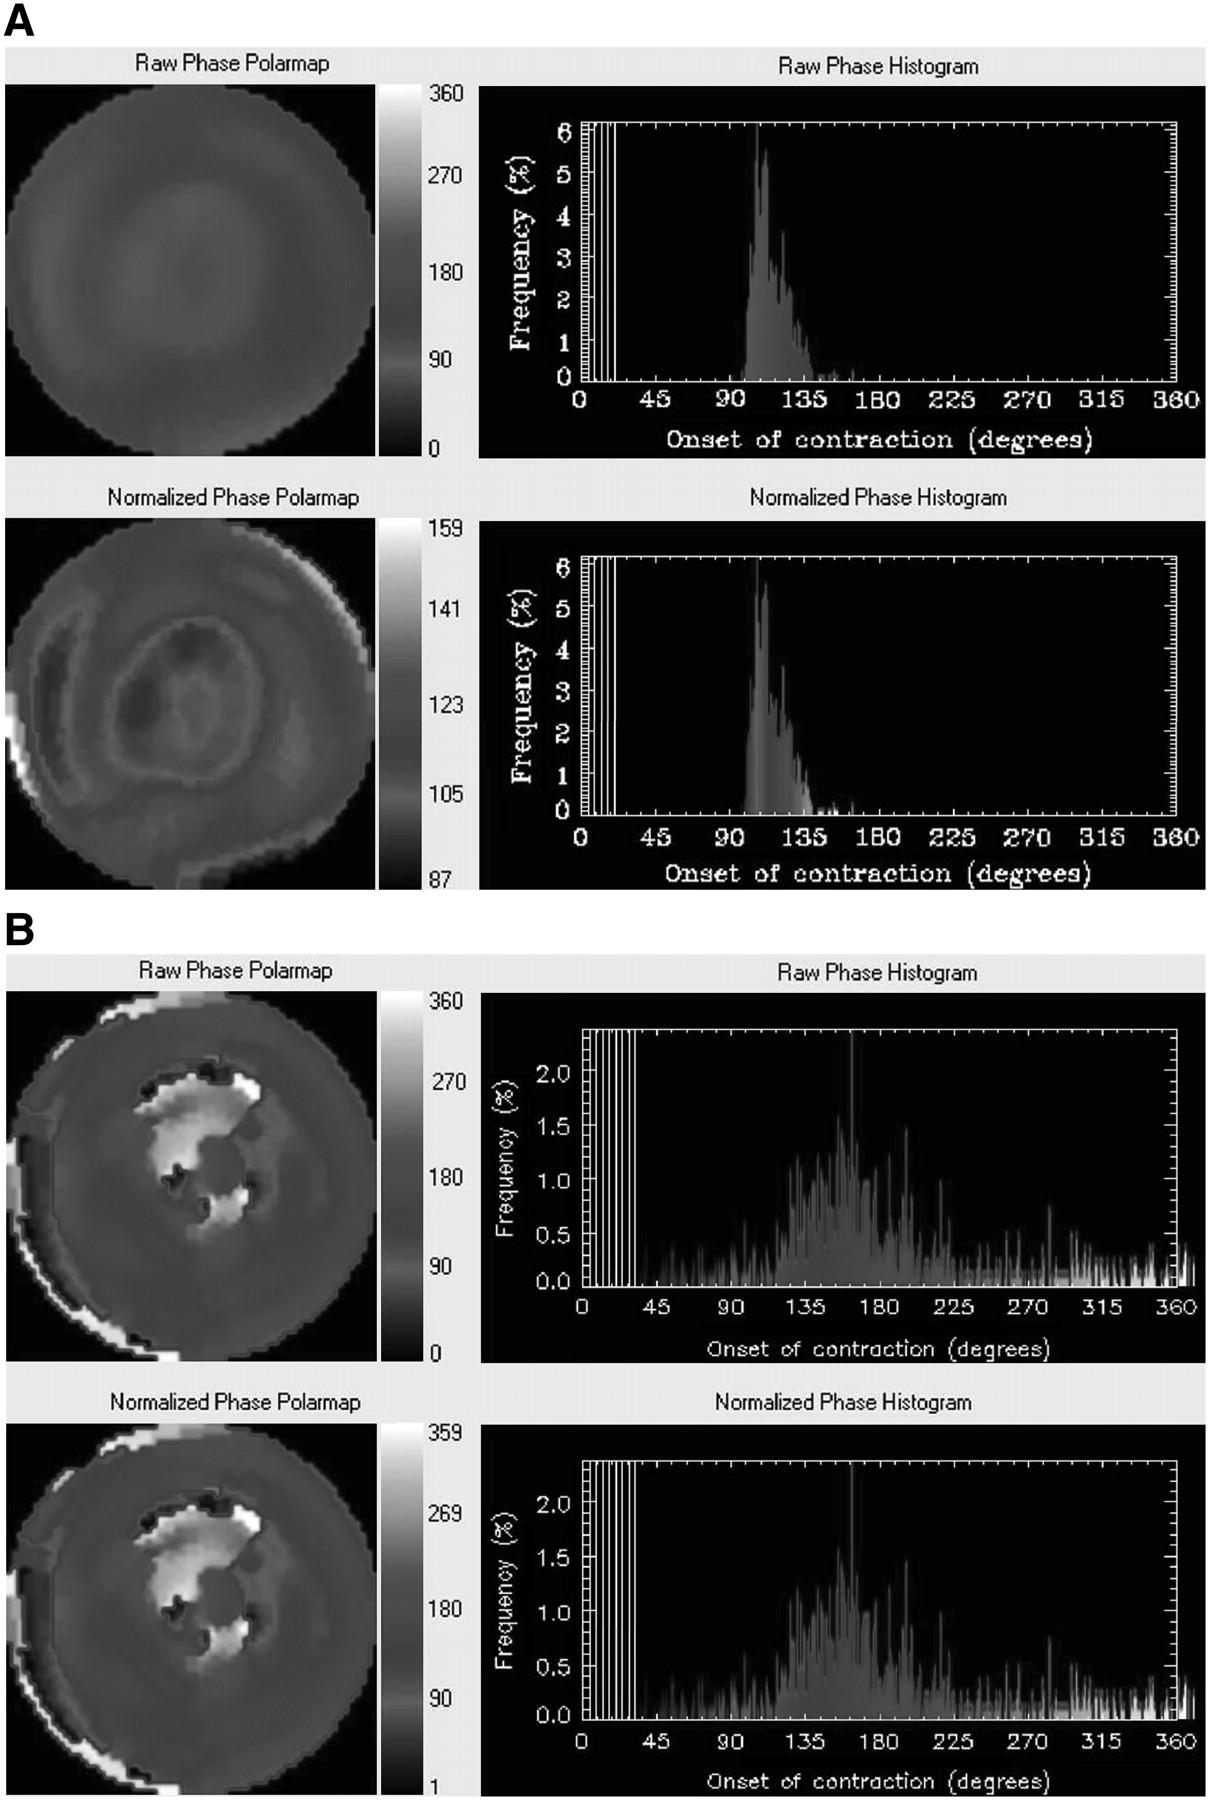
(A) Example of phase analysis in a nonresponder to CRT. At baseline, no LV dyssynchrony with phase analysis was present in this patient. Nonnormalized (top panel) and normalized (bottom panel) phase distributions are relatively uniform and the corresponding phase histograms are highly peaked, narrow distributions. After 6-mo follow-up, no response to CRT was observed, as reflected by deterioration in NYHA functional class from 3 to 4. In addition, LVEF remained unchanged (baseline [32%] vs. 6-mo follow-up [33%]). (B) Example of phase analysis in a responder to CRT. In this patient, LV dyssynchrony with phase analysis was present at baseline. Nonnormalized (top panel) and normalized (bottom panel) phase distributions show substantial nonuniformity, whereas the corresponding phase histograms are widely spread distributions. After 6-mo follow-up, this patient improved in NYHA functional class from 3 to 2, indicating response to CRT. In addition, LVEF increased from 27% at baseline to 33% at 6-mo follow-up.
Histogram Bandwidth and Phase SD for Prediction of Response to CRT
The only 2 variables at baseline that were significantly different between responders and nonresponders were the histogram bandwidth and the phase SD.
To define the optimal cutoff value for histogram bandwidth and phase SD to predict response to CRT, ROC curve analysis was performed. When defining responders as patients exhibiting an improvement in NYHA functional class of ≥1 score, an optimal sensitivity and specificity of 70% was obtained at a cutoff value of 135° (Fig. 3). The area under the curve was 0.78, which indicates good predictive value. ROC curve analysis was also performed to define the optimal cutoff value for phase SD to predict response to CRT. The area under the curve was 0.81, which also indicates good predictive value for the response to CRT. A cutoff value of 43° yielded a sensitivity and specificity of 74% to predict response to CRT (Fig. 4).

ROC analysis of histogram bandwidth demonstrated a sensitivity and specificity of 70% to predict response to CRT at cutoff level of 135° for histogram bandwidth.

ROC curve analysis of phase SD demonstrated a sensitivity and specificity of 74% to predict response to CRT at cutoff level of 43° for phase SD.
DISCUSSION
The results of the current study demonstrate that LV dyssynchrony assessed with phase analysis from GMPS is related to the clinical response to CRT. Except for the histogram bandwidth and the phase SD, all other baseline characteristics were comparable between the nonresponders and the responders to CRT. A cutoff value of 135° for histogram bandwidth can predict the clinical response to CRT with a sensitivity and specificity of 70%, whereas a cutoff value of 43° for phase SD yielded a sensitivity and specificity of 74% for prediction of the clinical response to CRT.
Heart failure is an important health care problem in the Western world, and the 5-y mortality exceeds 50% (19,20). CRT has been introduced as an adjuvant therapy for patients with end-stage heart failure, and promising results have been reported. Not only has acute improvement in hemodynamics been observed after CRT implantation, but also sustained clinical benefit (improvement in quality of life, exercise capacity, heart failure symptoms, and LV systolic function) at longer follow-up (1,2,21–23). However, it has been noted that approximately 20%–30% of the patients do not respond to CRT (21), and it has been demonstrated that LV dyssynchrony assessed with TDI can predict the clinical response to CRT with a sensitivity and specificity of 80% (5). Nuclear imaging techniques have been applied since the early 1980s for the evaluation of inter- and intraventricular dyssynchrony. Fauchier et al. (24) evaluated the prognostic value of inter- and intraventricular dyssynchrony in 103 patients with idiopathic dilated cardiomyopathy with equilibrium radionuclide angiography and Fourier phase analysis. It was shown that the intraventricular dyssynchrony was the only independent predictor of cardiac events.
The long-term effects of biventricular pacing have been investigated by Toussaint et al. (25). The authors evaluated 34 patients with radionuclide ventriculography. Patients were evaluated before CRT implantation, 8 d after implantation, and thereafter every 6 mo. It was noted that biventricular pacing reduced the electrical and mechanical dyssynchrony, associated with a significant improvement in LV function.
Tsurugaya et al. (26) have reported on quantitative gated SPECT before and after CRT in 10 heart failure patients. At a follow-up of 18 ± 6 mo, patients were classified as responders or nonresponders according to their clinical status and echocardiographic parameters. A significant improvement in LV synchrony was observed in the responders to CRT, whereas no improvement could be demonstrated in the nonresponders. Sciagrà et al. (27) investigated the use of gated perfusion SPECT for baseline evaluation and follow-up of patients referred for CRT. The authors showed that patients with extensive resting perfusion defects had limited response to CRT. Moreover, no significant reduction in LV volumes or improvement in LVEF could be observed in patients with extensive perfusion defects, whereas a significant improvement in LV systolic function and LV volumes was noted in patients without extensive perfusion defects.
Recently, a new technique has been developed to evaluate LV dyssynchrony with phase analysis from GMPS (15). The fully automated analysis has been shown to yield highly reproducible results, and the method can even be applied to severely hypoperfused myocardium (28). The information of LV dyssynchrony can be obtained from the same GMPS dataset as used for the evaluation of cardiac function and perfusion.
We have recently reported on the correlation between the different quantitative indices obtained by phase analysis with GMPS and the LV dyssynchrony as assessed with TDI in 75 patients with heart failure (29). The results indicated good correlations between TDI and histogram bandwidth/phase SD for assessment of LV dyssynchrony.
In the current study, 42 patients were included who underwent CRT implantation to evaluate whether the degree of LV dyssynchrony as assessed with GMPS could predict which patients will respond to CRT. In this study, the use of phase analysis from GMPS has been applied, to our knowledge for the first time, to predict response to CRT, yielding a sensitivity and specificity of 70% for histogram bandwidth and a sensitivity and specificity of 74% for phase SD to predict response to CRT.
Several limitations of this study must be considered. First, our research involved a relatively small study population, and the results must be confirmed in larger prospective patient populations. A more general limitation of GMPS is the radiation burden, which makes this technique less suitable for follow-up studies. However, considering the clinical circumstances of this specific patient population and the potential risk-to-benefit ratio in these patients, follow-up with GMPS could be justified in selected cases after CRT implantation. Also, follow-up studies with GMPS can provide valuable information on functional variables, including LV volumes and function. Also, the temporal resolution that gated-SPECT MPI provides is perceived to be relatively low compared with echocardiography. Nevertheless, it must be noted that the phase analysis tool uses the first harmonic Fourier approximation that can enhance its phase calculation when applied to the data with lower temporal resolution. It transforms the discrete data points into a continuous curve. Only the systolic portion of the data is used to determine the phase. By having this curve fit closely with the systolic data points, the artifactual phase difference resulting from low temporal resolution is greatly reduced. Figure 5 shows the small difference of the phases obtained from a patient when data are acquired at 8 frames per cardiac cycle compared with when data are acquired at 16 frames per cardiac cycle. This is consistent with previous work showing the value of Fourier temporal interpolation of data acquired at 8 frames per cycle by improving image quality without detrimental effects of quantitative parameters such as ejection fraction and left ventricular volumes (30).
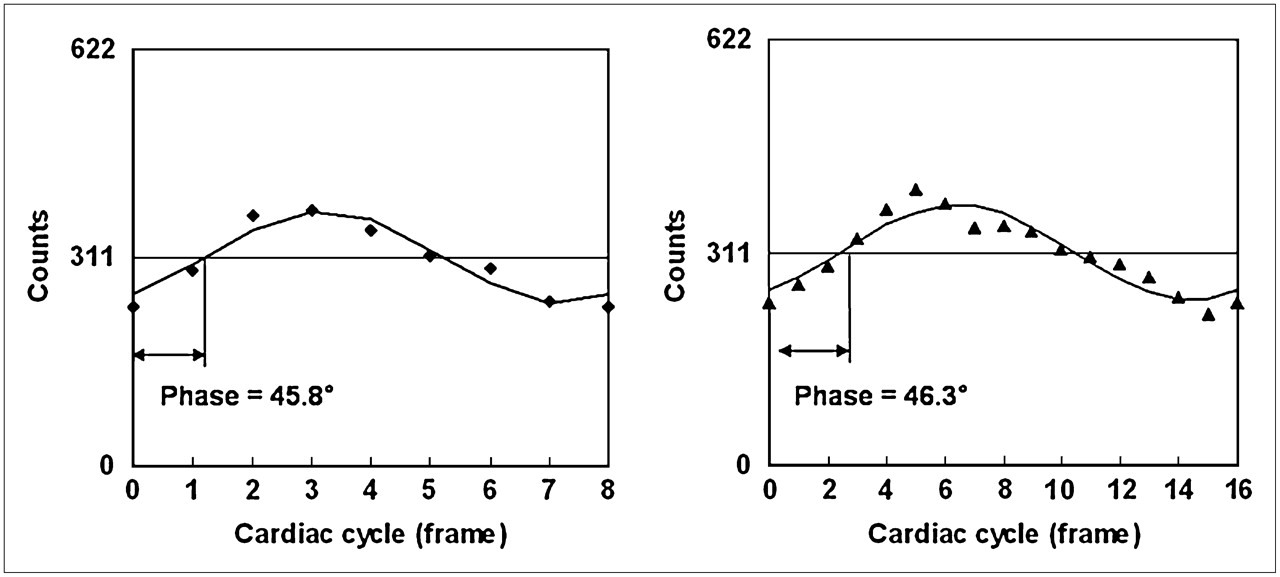
Comparison of difference of phases obtained when 8 frames per cycle (left panel) or 16 frames per cycle (right panel) data acquisition are used. Points in right panel are counts of a pixel arbitrarily chosen from the anterior region of polar maps given by a set of gated (16 frames per cycle) short-axis images. These points are regional maximum counts and their variations represent wall thickness changes at region over the cardiac cycle. Points in left panel are down-sampled from points in right panel. Curves are the first harmonics that approximate wall thickness changes during the cardiac cycle. With first harmonic approximation, phase difference between 8 frames per cycle and 16 frames per cycle is very small at −0.5° (360° corresponds to 1 cardiac cycle).
Recent studies have reported the presence of perfusion defects or scar tissue and the influence on the response to CRT (27,31). The aim of our study was to determine whether the presence of LV dyssynchrony, as assessed with phase analysis on GMPS, can predict response to CRT, and the influence of scar tissue (or perfusion defects) was not included in the current analysis.
However, other techniques also have important disadvantages. MRI is less suitable for patients with pacemakers and ICDs, and the prevalence of claustrophobia disqualifies another important percentage of the patients. TDI with echocardiography is highly operator dependent, and 20% of patients have a suboptimal acoustic window. Moreover, the phase analysis from GMPS has a major advantage in that this approach permits integrated assessment of LV function, perfusion (to identify ischemia and scar tissue), and dyssynchrony. All of this information may be of use in determining whether to implant a CRT device (32,33).
CONCLUSION
The clinical response to CRT is related to the presence of LV dyssynchrony assessed by phase analysis from GMPS. Both histogram bandwidth and phase SD can be used to predict response to CRT, with sensitivity and specificity of 70% and 74%, respectively. The current results need confirmation in larger patient populations.
Acknowledgments
Ernest V. Garcia receives royalties from the sale of the Emory Cardiac Toolbox. The terms of this arrangement have been reviewed and approved by Emory University in accordance with its conflict-of-interest practice. The other authors have indicated they have no financial or other conflicts of interest. Jeroen J. Bax has research grants from Guidant, Medtronic, GE Healthcare, and BMS Medical Imaging. Gabe B. Bleeker is supported by the Dutch Heart Foundation (grant 2002B109).
Footnotes
-
COPYRIGHT © 2007 by the Society of Nuclear Medicine, Inc.
References
- Received for publication January 17, 2007.
- Accepted for publication March 23, 2007.


Jump to section
Related Articles
Cited By...
- Quantitative clinical nuclear cardiology, part 2: Evolving/emerging applications
- The Prognostic Value of Diastolic and Systolic Mechanical Left Ventricular Dyssynchrony Among Patients With Coronary Heart Disease
- Utility of Equilibrium Radionuclide Angiogram-Derived Measures of Dyssynchrony to Predict Outcomes in Heart Failure Patients Undergoing Cardiac Resynchronization Therapy
- Presence of Postsystolic Shortening Increases the Likelihood of Coronary Artery Disease: A Rest Electrocardiography-Gated Myocardial Perfusion SPECT Study
- On the Importance of Image Gating for the Assay of Left Ventricular Mechanical Dyssynchrony Using SPECT
- Imaging for Planning of Cardiac Resynchronization Therapy
- A Prospective Pilot Study to Evaluate the Relationship Between Acute Change in Left Ventricular Synchrony After Cardiac Resynchronization Therapy and Patient Outcome Using a Single-Injection Gated SPECT Protocol
- Nonechocardiographic Imaging in Evaluation for Cardiac Resynchronization Therapy
- Left ventricular dyssynchrony assessment by phase analysis from gated myocardial perfusion SPECT: moving beyond conventional criteria
- Long-term prognostic value of left ventricular dyssynchrony assessment by phase analysis from myocardial perfusion imaging
- Agreement Is Poor Among Current Criteria Used to Define Response to Cardiac Resynchronization Therapy
- Echocardiography and Noninvasive Imaging in Cardiac Resynchronization Therapy: Results of the PROSPECT (Predictors of Response to Cardiac Resynchronization Therapy) Study in Perspective
- Quantitative Gated SPECT-Derived Phase Analysis on Gated Myocardial Perfusion SPECT Detects Left Ventricular Dyssynchrony and Predicts Response to Cardiac Resynchronization Therapy
- Imaging Cardiac Resynchronization Therapy
- The Year in Cardiac Imaging
- Automatic Global and Regional Phase Analysis from Gated Myocardial Perfusion SPECT Imaging: Application to the Characterization of Ventricular Contraction in Patients with Left Bundle Branch Block
- Reply: Can LV Dyssynchrony as Assessed with Phase Analysis on Gated Myocardial Perfusion SPECT Preferably Predict Response to CRT?
- Can LV Dyssynchrony as Assessed with Phase Analysis on Gated Myocardial Perfusion SPECT Preferably Predict Response to CRT?