


Abstract
We evaluated a novel scintigraphic method using new parameters of mechanical left ventricular (LV) dyssynchrony and correlated it with clinical outcomes in heart failure patients with reduced ejection fraction receiving cardiac resynchronization therapy (CRT). Methods: Sixty-six advanced heart failure patients referred for CRT with an LV ejection fraction (EF) of < 35% and QRS ≥ 120 ms were studied. We performed equilibrium radionuclide angiography (ERNA) before and 6 mo after CRT. We assessed ventricular dyssynchrony with parameters derived from the first harmonic phase (Ø) analysis of the ERNA time–activity curve and evaluated change in these parameters after 6 mo of CRT. These parameters include novel indices of synchrony (S), a measure of intraventricular contraction order, and entropy (E), a measure of intraventricular contraction disorder, and interventricular synchrony (IVS), a measure of synchronous biventricular function. Results: Forty-seven (71%) patients improved clinically (responders) at 6 mo after CRT whereas 19 (28.8%) showed no change in New York Heart Association class or worsened (nonresponders). The post-CRT changes in QRS duration (P = 0.006), echocardiographic (P = 0.03) and ERNA LVEF (P = 0.0007), LVS (P = 0.004), LVE (P = 0.006), LV standard deviation of ventricular phase (LVSDØ) (P = 0.004), and IVS (P = 0.05) were significantly different between responders and nonresponders. Sixty-two percent of responders had either an LVS < 0.84 or an IVS ≥ 18.8° as opposed to only 16% of nonresponders (P = 0.001). Twenty-nine of 32 (91%) patients with either of these measures responded to CRT (P < 0.01). Conclusion: LVS and IVS are novel measures of LV dyssynchrony derived from ERNA planar analysis. A baseline value of LVS < 0.84 or IVS ≥ 18.8° predicts a positive response to CRT.
Heart failure (HF) is the most frequent cause of cardiac hospitalization in the United States, affecting 5,000,000 patients, with 250,000 deaths yearly (1). Both ventricular systolic function and synchrony have been shown to have significant prognostic impact in HF (2,3). Cardiac resynchronization therapy (CRT) has been proven to reduce both the morbidity and the mortality of HF patients who become refractory to medications and present with a wide QRS (2–4). However, improvement of HF with CRT based on clinical and echocardiographic criteria is highly variable, with 30%–40% patients who do not improve or worsen with CRT (2–5).
Scintigraphic methods that image myocardial perfusion and function have been adapted for synchrony analysis (6,7). SPECT myocardial perfusion scintigraphy combines measures of both perfusion and function, and extracted parameters have been demonstrated to measure ventricular synchrony and even to predict CRT outcomes (8,9). Equilibrium radionuclide angiography (ERNA) has advantages of higher temporal resolution, greater reproducibility, and volumetric analysis of both ventricles that can be applied for analysis of intraventricular synchrony and interventricular synchrony (IVS) (7,10).
Novel, objective measures of regional contraction and global mechanical synchrony based on the first harmonic fit of the ERNA ventricular time versus radioactivity curve, the synchrony (S) and entropy (E) parameters, have been developed and are generated by in-house software. These parameters were demonstrated to be highly reproducible, with both intra- and interobserver variability in the range of 2% (11). Applied in a simulation model, S and E were observed to discriminate better the synchrony profiles among a spectrum of patterns of wall motion than left ventricular (LV) ejection fraction (EF) or the SD of LV phase angle (SDLVØ) measured on the phase histogram, which plots phase angle (Ø) on the abscissa versus its frequency on the ordinate within the LV region of interest (ROI) (11). The aim of this study was to correlate these novel parameters of S and E with clinical outcomes in patients with advanced HF undergoing CRT.
MATERIALS AND METHODS
Background
As previously reported from our laboratory (11), using ERNA, Ø and amplitude quantitate regional contraction timing and magnitude and are the basis for novel S and E parameters. S is the vector sum of all amplitudes based on the angular distribution of Ø divided by the scalar sum of the length of all vectors. Complete S equals 1, and its absence equals 0. E measures the disorder in the ROI, is 1 with random contraction and 0 with full synchrony, and differentiates among differing contraction patterns. S and E parameters were highly reproducible and well differentiated among patients with normal wall motion, aneurysm, diffuse dysfunction, and severe regional dysfunction. These novel indices of dyssynchrony were found superior to SD Ø (SD of ventricular phase), which failed to distinguish these groups of LV dysfunction (11).
Patient Population
All patients signed informed consent forms approved by the University of California San Francisco institutional review board. We evaluated 66 patients with systolic dysfunction, advanced HF (New York Heart Association [NYHA] class III or IV), echocardiographic LVEF ≤ 35%, and QRS duration > 120 ms, who were referred for CRT between February 2004 and October 2011. All patients received maximal tolerated medical therapy per their HF specialist (Table 1).
Baseline Clinical Characteristics
Study Protocol
ERNA was performed 1 mo or less before CRT implantation and after 6 mo of CRT (Table 2) to assess serial changes of ventricular volumes, function, and synchrony. As part of the CRT evaluation all patients had serial 2-dimensional echocardiograms within 1 mo before CRT implantation and after 6 mo of therapy with calculation of LVEF, LV end diastolic volume index (LVEDVI), and LV end systolic volume index (LVESVI). The NYHA class (12) of each patient before and after 6 mo of CRT was determined by consensus of the HF specialist and cardiac electrophysiologist who were masked to imaging results.
Baseline Parameters Compared with Clinical Outcome
ERNA
Patients were injected with red blood cells labeled with 99mTc by the in vitro method (13) with an activity of approximately 11 MBq/kg of body weight (20 mCi/70 kg). Rest, supine electrocardiogram (ECG)–gated anterior, best septal left anterior oblique, and left lateral planar images were acquired in 16 frames, before and after CRT, using a Forte camera (Philips Electronics, Inc.), processed by commercial software. LVS, LVE, SDLVØ, IVS, right ventricular (RV) S (RVS), right ventricular E (RVE), and SDRVØ were calculated, based on the phase image generated from the first harmonic fit of the ERNA time–activity curve displayed by standard laboratory protocols (11,14).
First Harmonic Analysis and Synchrony Measures
In each ERNA pixel, the first harmonic curve fit is characterized by its phase and amplitude, representing surrogates for the timing and magnitude of regional contraction, respectively. For each pixel, a harmonic vector can be drawn with direction representing its Ø from 0°; the ECG R wave gating signal, to 360°; and its length representing its amplitude (A). We developed the parameters of S and E, to express LV dyssynchrony, based on pixel Ø and A (11).
Definitions
Established Parameters
Each parameter was calculated from the first harmonic phase histogram in the ventricular ROIs: SDLVØ, SDRVØ, IVS (difference between mean LVS and RVS), LVS, and LVE are defined mathematically elsewhere (11,14,15).
Synchrony (S)
LVS is a measure of contraction efficiency within the ERNA LV ROI, LVS, and is the vector sum of all amplitudes divided by their arithmetic sum. S ranges from 0 to 1. With complete synchrony, vector numerator and arithmetic sum denominator are equal and S = 1. S estimates the contraction potential if the ROI were synchronized. The maximum potential functional gain with CRT is 1 − S.
Entropy (E)
LVE is a measure of contraction disorder in the same LV ROI. LVS can approach 0 when contraction is random or if the ROI consists of 2 subregions, each 180° delayed with respect to the other. To distinguish these possibilities, and determine the extent of each component, we divided the LV ROI S histogram into 30 adjacent 12° color blocks and formulated E as a measure of the distribution or randomness of Ø across these blocks, from 0, with synchronous motion and a single Ø, to 1 with fully dyssynchronous contraction and Ø distributed in all blocks.
Both RVS and RVE can be calculated for the right ventricular (RV) ROI. LVS and LVE calculated on planar ERNA in a group of 30 healthy patients studied for clinical indications were S = 0.99 ± 0.01 and E = 0.45 ± 0.02. Similarly, normal values for RVS and RVE were established (7), as well as that of IVS in those with normal conduction and those with right bundle branch block (RBBB) and left BBB (LBBB) in the absence of HF (9).
The primary endpoint was the clinical CRT response defined as any change in NYHA classification at 6 mo after implantation. Secondary analysis included the correlation of the NYHA class change with changes in synchrony parameters.
Statistics
Continuous variables are expressed as mean ± SD if normally distributed and as median and interquartile range if not normally distributed. The χ2 test compared categoric variables. The t test with welch P value was used to compare continuous variables given unequal responder and nonresponder group size and variance. Statistically significant change in NYHA class across the 3 outcomes groups was performed by the Kruskal–Wallis rank test. Optimal, statistically significant cut points for baseline variables between groups were made by an a priori value or by receiver-operator-curve analysis. STATA 10.0 (StataCorp.) was used for all statistical analyses.
RESULTS
We enrolled 66 patients, 51 men (77.3%), with a mean age ± SD of 62.9 ± 13.9 y, each in sinus rhythm, 36 (55%) with ischemic cardiomyopathy (Table 1). Fifty-five patients were NYHA III, and 11 patients were NYHA IV. At 6 mo after CRT implantation, 47 (71%) patients improved clinically. The 34 (51.5%) patients who improved by 1 NYHA class and the 13 (19.7%) who improved by 2 NYHA classes were designated as responders, and the 19 (28.8%) who showed no change or worsened were designated as nonresponders. Baseline age, sex, and cardiomyopathy etiology were not related to patient outcomes (Table 1).
Predictive Value of Pre-CRT Measures
Preimplantation QRS duration, echocardiographic LVEF, LVEDVI, LVSVI, and LVEF; and ERNA-derived LVE, LV standard deviation of ventricular phase (LVSDØ), RVSDØ, RVS, and RVE could not distinguish response to CRT in these patients with class III and IV HF and echocardiographic EF < 35%. Baseline LVS and IVS were the only parameters that predicted response to CRT (Table 2). CRT responders had lower group mean LVS (0.858 ± 0.12) than nonresponders (0.915 ± 0.04, P = 0.008) and higher IVS (18.3° ± 0.62° vs. 9.76° ± 9.69°, P = 0.009).
A lower baseline LVS and higher baseline IVS related to a higher rate and magnitude of improvement with CRT. Receiver-operator-curve analysis demonstrated an optimal discrimination LVS threshold of 0.84. Among patients with pre-CRT LVS ≤ 0.84, 15 of 16 (94%) improved versus 32 of 50 (64%) with LVS > 0.84 (P = 0.02).
Mean IVS previously established in patients with LBBB was 18.8° (14). Among patients with baseline IVS ≥ 18.8°, 21 of 23 (91%) responded to CRT versus 26 of 43 (60%) with IVS < 18.8° (P = 0.008). Among 32 responders with LVS > 0.84, 14 (44%) had IVS ≥ 18.8°. Patients with either LVS < 0.84 or IVS ≥ 18.8° had a higher response rate to CRT. Sixty-two percent of responders had either LVS < 0.84 or IVS ≥ 18.8° as opposed to only 16% of nonresponders (P = 0.001).
Serial Changes in Post-CRT Measures
The post-CRT change in QRS duration, echocardiographic and ERNA LVEF, LVS, LVE, LVSDØ, and IVS was significantly different between responders and nonresponders (Table 3). Responders who improved 2 NYHA classes revealed large improvements in these parameters. However, LVEF, LVSDØ, LVS, and LVE change but not change in IVS could differentiate the highest responders from the nonresponders and modest responders (Table 4). RVSDØ, RVS, and RVE showed no significant change after CRT.
Changes in Parameters Compared with Clinical Outcome
NYHA Change in Cardiac Functional Parameters Compared with Improvement in a Number of NYHA Classes Before and After 6 Months of CRT
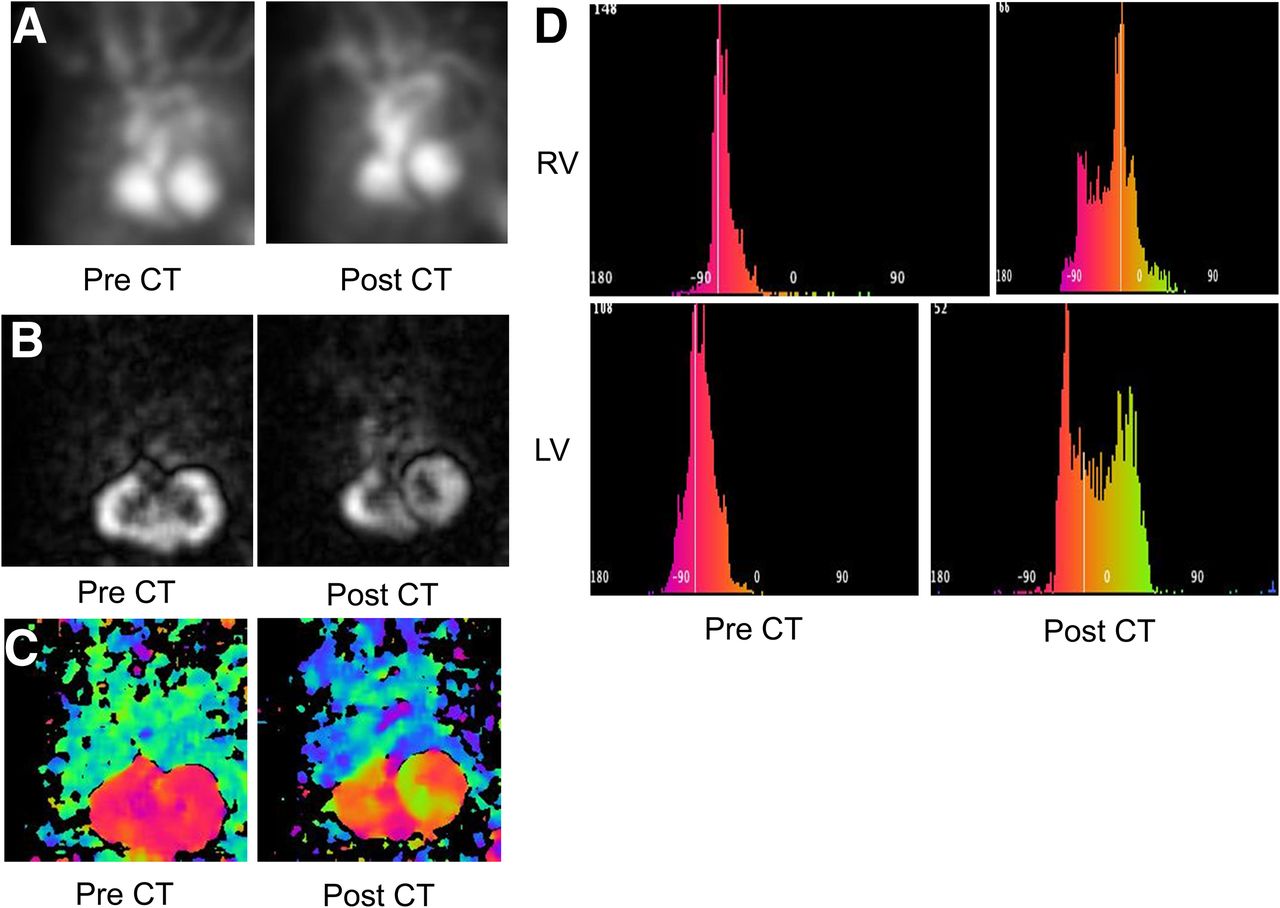
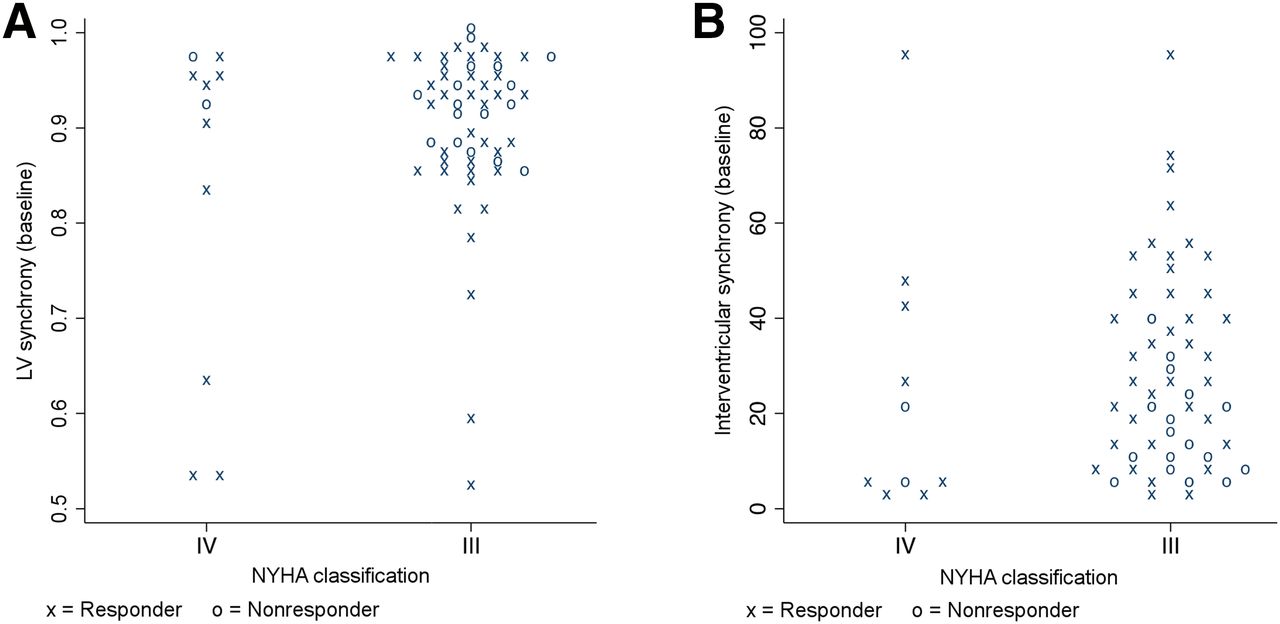
Figure 1 illustrates serial ERNA images in a CRT responder, and Figure 2 shows serial images in a nonresponder. Figure 3 shows the individual data points of baseline LVS and IVS in responders and nonresponders.
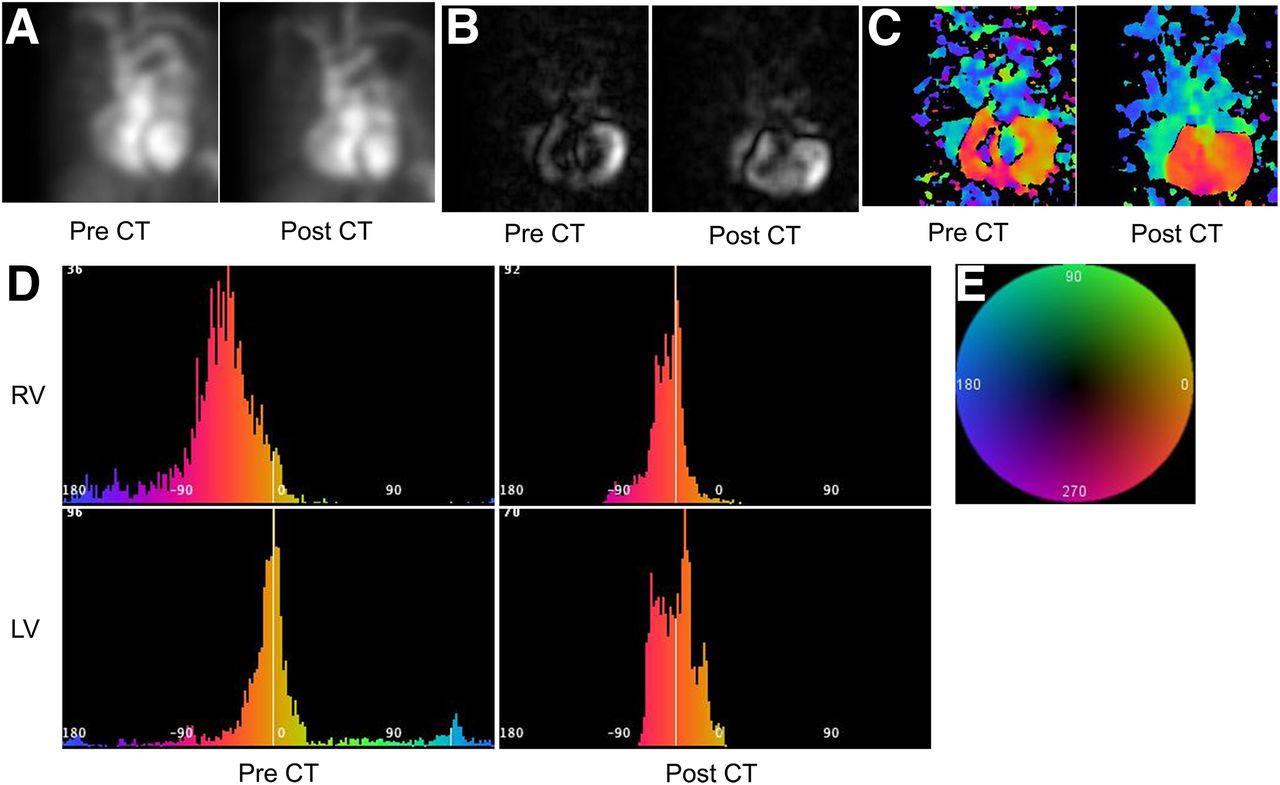
ERNA images of patient with excellent CRT outcome. (A) ERNA cines. Shown are best septal left anterior oblique projections of gated ERNA acquired in HF patient with excellent CRT outcome (before CRT, left; after CRT, right). NYHA class fell from III to I as ERNA LVEF increased from 22% to 35% with CRT. (B) Amplitude images. Shown are amplitude images with intensity proportional to amplitude, derived from cines in A (before CRT, left; after CRT, right). Note more complete appearance of post-CRT image. (C) Phase images. Shown are phase images derived from cines in A, color-coded for phase angle according to sequence on color wheel in E (before CRT, left; after CRT, right). Note more homogeneous color distribution across both ventricles after CRT. Improved intraventricular synchrony and IVS are evident and confirmed on related histograms (D). (D) Phase histograms. Shown are RV phase histograms (top) and LV phase histograms (bottom), derived from phase images shown in C, each plotting phase angle on abscissa and its frequency on ordinate, within respective ventricular ROI, color-coded for phase angle according to sequence as in E (before CRT, left; after CRT, right). Reduced width and baseline scatter in both histograms after CRT supports improved LVS, which increased from 0.84 to 0.97, whereas LVE decreased from 0.69 to 0.50, and LVSDØ decreased from 61.7 to 19.62, with CRT, whereas improved vertical alignment of LV and RV histograms after CRT supports improved IVS, which decreased from 41.2 to 6.92. (E) Color wheel. This is color code applied to serial phase angles in images and histograms, above and below, where earliest ventricular phase angle is at approximately 0°.

ERNA images of patient with poor CRT outcome. (A) ERNA cines. Shown are best septal left anterior oblique projections of gated ERNA acquired in HF patient with poor CRT outcome (before CRT, left; after CRT, right). NYHA class remained at III as pre-CRT LVEF of 35% fell to 30% after CRT. (B) Amplitude images. Shown are amplitude images derived from cines in A (before CRT, left; after CRT, right). Note more heterogeneous appearance of post-CRT image. (C) Phase images. Shown are phase images (before CRT, left; after CRT, right) derived from cines in A, color-coded for phase angle according to sequence on color wheel in Figure 1E. Note more heterogeneous and disparate phase distribution in each ventricle after CRT compared with homogeneous biventricular distribution before CRT. Color and Ø changes indicate worsening of intraventricular synchrony and IVS confirmed on related histograms (D). (D) LV phase histograms. Shown are RV phase histograms, above, and LV phase histograms, below (before CRT, left; after CRT, right), derived from phase images shown in C. Increased width and spectrum in both histograms after CRT indicates reduced intraventricular synchrony as LVS fell from 0.96 to 0.87, LVE increased from 0.36 to 0.66, and LVSDØ increased from 12.29 to 28.34, whereas vertical misalignment of LV and RV histograms, apparent after CRT, supports observed increased IVS from 1.97 to 45.19.

(A) Baseline LVS plot in patients with NYHA III and IV showing values in responders and nonresponders. (B) Baseline IVS plot in patients with NYHA III and IV showing values in responders and nonresponders.
DISCUSSION
Main Findings
Although CRT improves ventricular synchrony and symptoms in many HF patients, as in this study, 30%–40% do not benefit (2–5). In this study, we serially measured established and novel quantitative ERNA parameters of ventricular dyssynchrony and correlated them with clinical outcomes after CRT among 66 patients with advanced HF. Given the high failure rate of electrocardiographic and echocardiographic parameters to CRT predict response in patients with advanced HF, an accurate and reproducible method to identify patients who benefit from CRT is needed. In this study, pre-CRT IVS and LVS effectively identified CRT responders from nonresponders.
Serial ERNA studies showing improvement in LVEF, LVS, LVE, SDLVØ, and IVS differed significantly between responders and nonresponders. These characteristics show that both ventricular systolic function and synchrony improve with CRT. We present parameters for dyssynchrony measurement whose improvement correlates well with improved LVEF, supporting the belief that improved intraventricular LVS contributes to LVEF improvement after CRT.
In this initial effort to evaluate the method, we have excluded patients with atrial fibrillation, in whom the often rapid and irregular ventricular rates would produce artifacts in the data. However, scintigraphic methods could be applied to sample a limited fixed rate window, making the method applicable even in those with atrial fibrillation.
Comparison of Other Imaging Modalities
Imaging methods that capture the extent and sequence of ventricular contraction could have an important advantage for the measurement of synchrony. A variety of echocardiographic parameters have been used extensively to express LV mechanical dyssynchrony. Although early echocardiography reports seemed promising (16), the relationship of many echocardiographic derived measures of dyssynchrony and the outcomes of CRT are inconsistent and these echocardiographic methods lack reproducibility (17,18). New efforts to assess myocardial deformation by 3-dimensional echocardiography and MR techniques have been developed (19). However, MRI is costly, is not widely available, and is not generally recommended or widely applied to patients with implanted devices (19).
Gated myocardial perfusion scintigraphy (MPS), a novel, commercially available, count-based method, analyzes the curve generated from the variation of myocardial intensity with wall thickening on gated MPS. Repeatability, reproducibility, and temporal resolution of histogram-derived SDØ, bandwidth, skewness, and kurtosis have been demonstrated. LVS assessed by ECG-gated MPS correlates well with echocardiographic measures (18,19) in limited patient numbers (20,21) and appears to correlate well with HF outcomes (8). Technical limitations of ECG-gated MPS include the potential undersampling of conventional 8-frame acquisition protocols and the potentially reduced accuracy associated with limited assessment of regional thickening in poorly perfused, heavily scarred, ventricles of CRT patients as well as being potentially complicated by attenuation artifacts of ECG-gated MPS images. Both ERNA and ECG-gated SPECT MPI methods are associated with low radiation exposure (1–10 mSv). The assessment of planar ERNA measurements before CRT can potentially identify those most and least likely to benefit from the mechanical pacing therapy and potentially avoid unnecessary instrumentation in those least likely to respond to CRT.
In this study, we demonstrated the value of dyssynchrony derived from planar ERNA in predicting clinical outcomes after CRT implantation. Planar ERNA is relatively inexpensive, widely available, and widely applied with high accuracy in virtually all patients (22). The sampling rate is sufficient to accurately measure LVEF (23), and temporal resolution is digitally enhanced and objectified by the generation of parametric images. The phase image has successfully tracked the sequence of ventricular wall motion in a variety of conduction abnormalities (15,16,20–23). The ability of planar ERNA phase analysis to assess myocardial synchrony is recognized (8,12,20–22). The SDLVØ has demonstrated the influence of synchrony on HF and CRT outcomes and was the only parameter measured in sinus rhythm, which predicted ventricular tachycardia intolerance (8,20–23). ERNA is also the only imaging method that can evaluate adequately both LVS and IVS and their combined contribution to the CRT response in patients with advanced HF.
The potential value of SPECT ERNA was considered, and we have now begun to acquire these studies in both planar and SPECT modes. We are now developing methods to calculate dyssynchrony parameters and others for the SPECT method. SPECT imaging is also highly reproducible, repeatable, and widely available (7). However, unlike planar ERNA, SPECT ERNA may lose accuracy due to undersampling with 8-frame acquisition, and routine 16-frame acquisition is recommended.
Comparison with ECG
QRS duration and morphology have been shown to be predictors of response to CRT (22–25). The Cardiac Resynchronization in Heart Failure study showed mortality benefit with CRT pacing alone in patients with LBBB morphology and QRS duration > 150 ms (22–25). Recent meta-analysis of CRT studies has shown that baseline QRS duration > 150 ms was one of the best predictors of response to CRT (22–25). Baseline LBBB morphology is associated with significant improvement in HF events, ventricular tachyarrhythmia, and death (23–26). We believe planar ERNA measures of mechanical synchrony (LVS and IVS) provide incremental predictive value to CRT response in patients with advanced HF. We have shown that pre-CRT LVS and IVS identify high likelihood of clinical improvement of HF with CRT in patients with QRS duration 120–150 ms, and we believe patients with interventricular conduction delay/RBBB (class II indication as per the new CRT guidelines) will similarly benefit from LVS and IVS where ECG morphology alone is not predictive of CRT response.
There is much more that can be done in the effort to measure synchrony and optimize patient selection and clinical outcomes with CRT. The parameters of S and E are not suggested to be the final iteration but an initial approach to the objective measurement of synchrony. These measures do not consider improvement of function in ventricular segments without amplitude before CRT, as can be seen. Further study is needed to identify factors that explain the minority of patients with preserved synchrony who demonstrate clinical improvement of HF with CRT. Neither these parameters, nor this analysis, factor in the presence or location of scar, myocardial viability, the location of the pacing lead, and other yet unknown conditions that likely influence the response to CRT. There remains a need for yet more objective and reproducible methods to measure mechanical dyssynchrony. There is a clinical and economic necessity to identify those who will benefit from CRT and the synchrony imaging software is an effort in this direction (24–27). It would have been desirable to evaluate all the parameters used to assess the functional class of HF patients such as exercise duration and maximum volume of oxygen (VO2 max) consumption (6-min walk), and others, as we characterize the value of new imaging dyssynchrony parameters. Nonetheless, the NYHA class is a global clinical measure of HF status, relating to and influenced by all other measures of HF performance. In this initial test of new and promising imaging measures of synchrony, a masked evaluation of NYHA class was sufficient to demonstrate the proof of concept. A more detailed evaluation of the correlation between HF status and image synchrony parameters is important and will serve to add validity to this preliminary assessment.
CONCLUSION
We have found novel measures of LV dyssynchrony derived from ERNA planar analysis (LVS and IVS) that predict clinical outcomes in HF patients undergoing CRT. These parameters appear promising in the selection of patients most likely to respond to CRT with reduction of advanced HF over 6 mo. Further study is required to demonstrate the reproducibility and correlation of ERNA-derived measures of dyssynchrony on HF outcomes and the cost effectiveness of this approach on patient selection for CRT.
DISCLOSURE
The costs of publication of this article were defrayed in part by the payment of page charges. Therefore, and solely to indicate this fact, this article is hereby marked “advertisement” in accordance with 18 USC section 1734. This work was supported in part by a grant from Philips, Inc., Milpitas, California. No other potential conflict of interest relevant to this article was reported.
Acknowledgments
This work was presented at the Annual Meeting of the Society of Nuclear Medicine, Toronto, Canada, 2009.
Footnotes
Published online Jul. 14, 2016.
- © 2016 by the Society of Nuclear Medicine and Molecular Imaging, Inc.
REFERENCES
- Received for publication February 25, 2016.
- Accepted for publication April 19, 2016.


Jump to section
Related Articles
Cited By...
- No citing articles found.