
Main menu

  • Home
  • Content
    • Current
    • Ahead of print
    • Past Issues
    • JNM Supplement
    • SNMMI Annual Meeting Abstracts
    • Continuing Education
    • JNM Podcasts
  • Subscriptions
    • Subscribers
    • Institutional and Non-member
    • Rates
    • Journal Claims
    • Corporate & Special Sales
  • Authors
    • Submit to JNM
    • Information for Authors
    • Assignment of Copyright
    • AQARA requirements
  • Info
    • Reviewers
    • Permissions
    • Advertisers
  • About
    • About Us
    • Editorial Board
    • Contact Information
  • More
    • Alerts
    • Feedback
    • Help
    • SNMMI Journals
  • SNMMI
    • JNM
    • JNMT
    • SNMMI Journals
    • SNMMI

User menu

  • Subscribe
  • My alerts
  • Log in
  • Log out
  • My Cart

Search

  • Advanced search
Journal of Nuclear Medicine
  • SNMMI
    • JNM
    • JNMT
    • SNMMI Journals
    • SNMMI
  • Subscribe
  • My alerts
  • Log in
  • Log out
  • My Cart
Journal of Nuclear Medicine

Advanced Search

  • Home
  • Content
    • Current
    • Ahead of print
    • Past Issues
    • JNM Supplement
    • SNMMI Annual Meeting Abstracts
    • Continuing Education
    • JNM Podcasts
  • Subscriptions
    • Subscribers
    • Institutional and Non-member
    • Rates
    • Journal Claims
    • Corporate & Special Sales
  • Authors
    • Submit to JNM
    • Information for Authors
    • Assignment of Copyright
    • AQARA requirements
  • Info
    • Reviewers
    • Permissions
    • Advertisers
  • About
    • About Us
    • Editorial Board
    • Contact Information
  • More
    • Alerts
    • Feedback
    • Help
    • SNMMI Journals
  • View or Listen to JNM Podcast
  • Visit JNM on Facebook
  • Join JNM on LinkedIn
  • Follow JNM on Twitter
  • Subscribe to our RSS feeds
Research ArticleCLINICAL INVESTIGATIONS

Characterization of the SPECT 5-HT2A Receptor Ligand 123I-R91150 in Healthy Volunteers: Part 2—Ketanserin Displacement

Ana M. Catafau, Monica Danus, Santiago Bullich, Gianluca Nucci, Jordi Llop, Sergi Abanades, Vincent J. Cunningham, Jos L.H. Eersels, Javier Pavia and Magi Farre
Journal of Nuclear Medicine June 2006, 47 (6) 929-937;
Ana M. Catafau
  • Find this author on Google Scholar
  • Find this author on PubMed
  • Search for this author on this site
Monica Danus
  • Find this author on Google Scholar
  • Find this author on PubMed
  • Search for this author on this site
Santiago Bullich
  • Find this author on Google Scholar
  • Find this author on PubMed
  • Search for this author on this site
Gianluca Nucci
  • Find this author on Google Scholar
  • Find this author on PubMed
  • Search for this author on this site
Jordi Llop
  • Find this author on Google Scholar
  • Find this author on PubMed
  • Search for this author on this site
Sergi Abanades
  • Find this author on Google Scholar
  • Find this author on PubMed
  • Search for this author on this site
Vincent J. Cunningham
  • Find this author on Google Scholar
  • Find this author on PubMed
  • Search for this author on this site
Jos L.H. Eersels
  • Find this author on Google Scholar
  • Find this author on PubMed
  • Search for this author on this site
Javier Pavia
  • Find this author on Google Scholar
  • Find this author on PubMed
  • Search for this author on this site
Magi Farre
  • Find this author on Google Scholar
  • Find this author on PubMed
  • Search for this author on this site
  • Article
  • Figures & Data
  • Info & Metrics
  • PDF
Loading

Article Figures & Data

Figures

  • Tables
  • FIGURE 1. 
    • Download figure
    • Open in new tab
    • Download powerpoint
    FIGURE 1. 

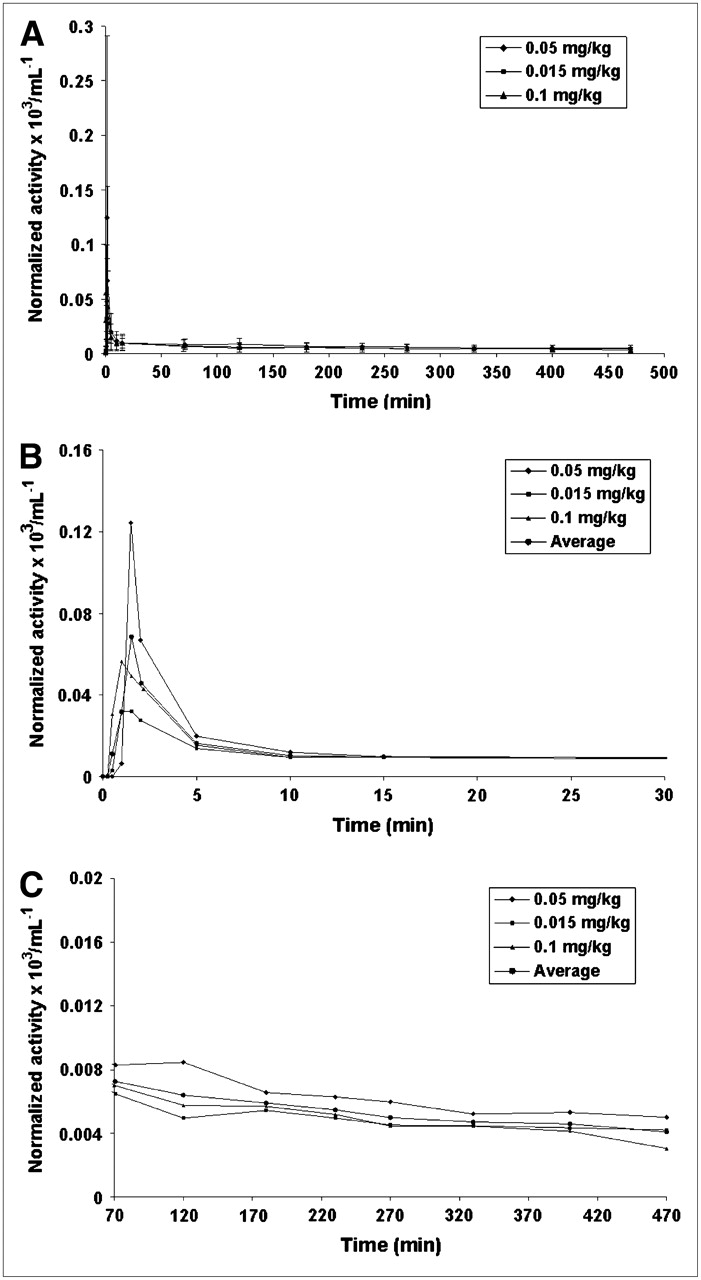
    Average values for activity corresponding to unmetabolized parent compound in plasma as function of time for 0.05, 0.015, and 0.1 mg of ketanserin per kilogram for entire study (A), first 30 min after injection (B), and 70–470 min after injection (C). All values are decay corrected to injection time and normalized with injected activity. Values in A include SD.
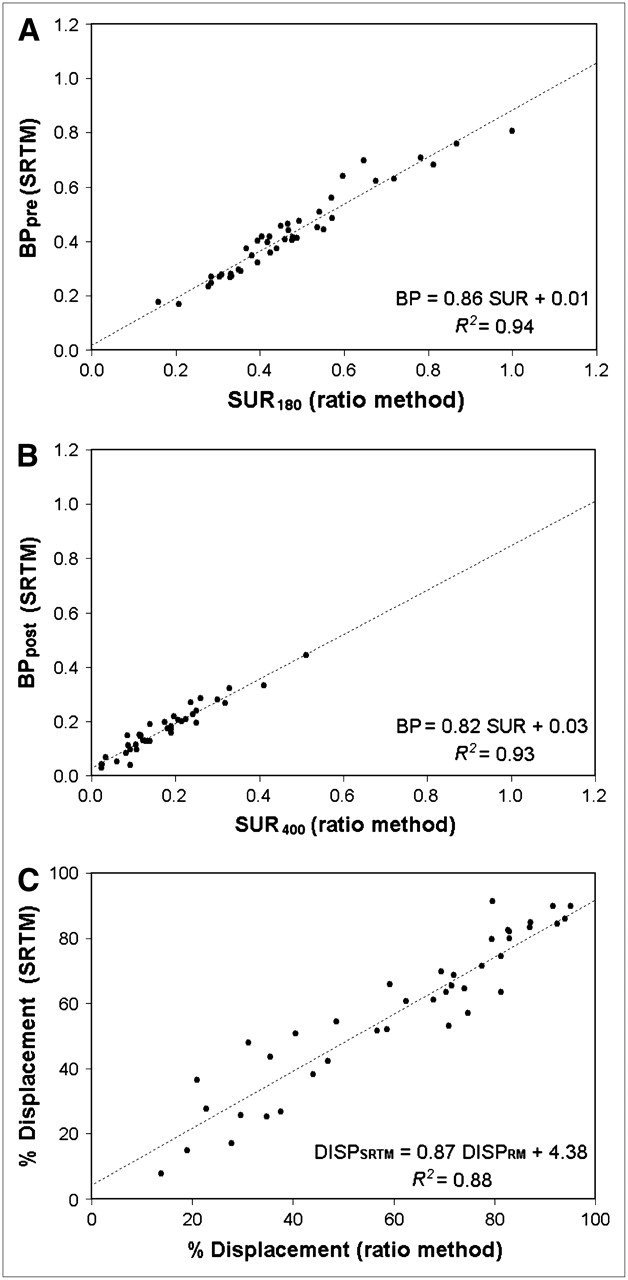
  • FIGURE 2. 
    • Download figure
    • Open in new tab
    • Download powerpoint
    FIGURE 2. 

    Scatterplots of SRTM vs. TR measurements: BPpre vs. SUR180 (A), BPpost vs. SUR400 (B), and %DisplSRTM vs. %DisplTR (C).
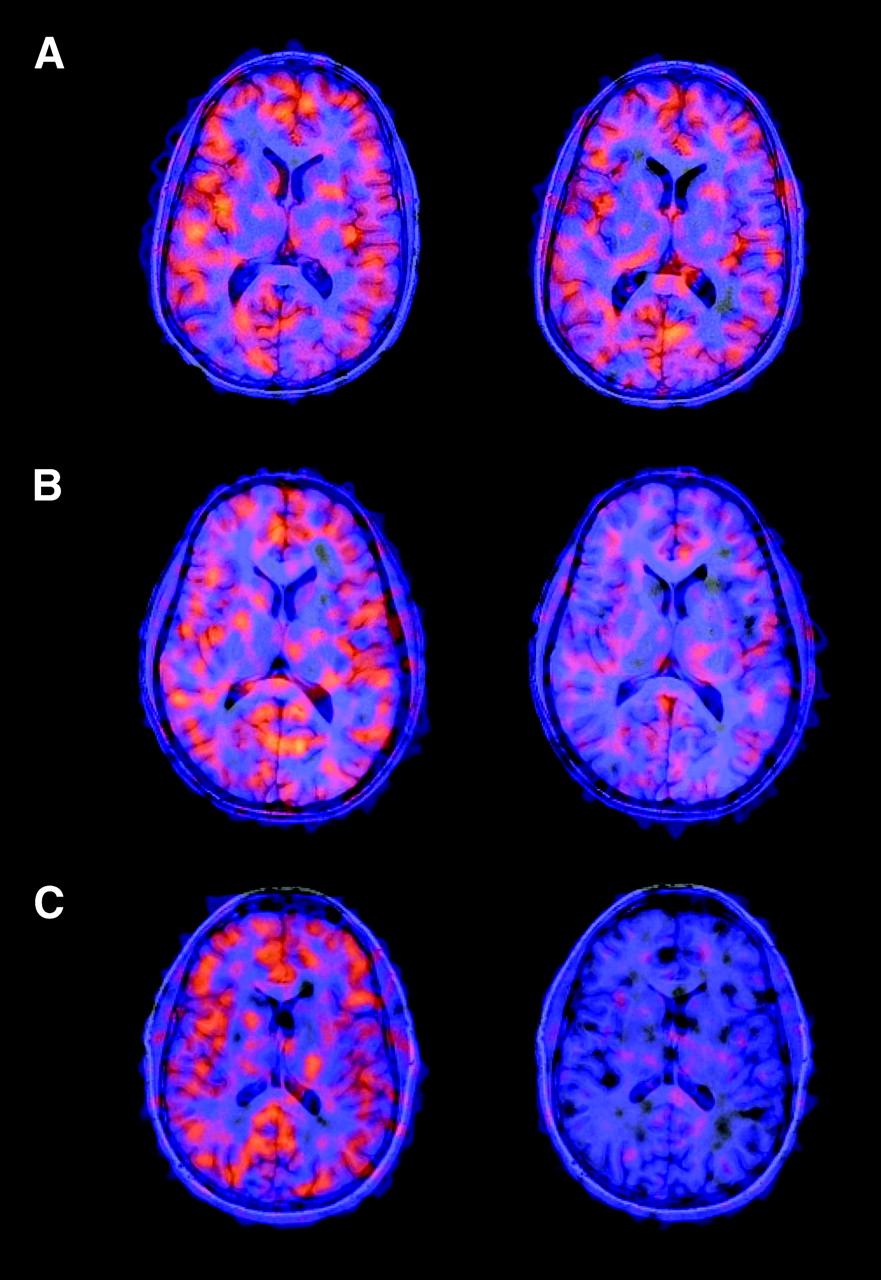
  • FIGURE 3. 
    • Download figure
    • Open in new tab
    • Download powerpoint
    FIGURE 3. 

    Coregistered MRI/SPECT images from 3 representative healthy volunteers, each receiving a different ketanserin dose. Baseline scans at 180 min after injection are on left; postketanserin scans at 400 min after injection are on right. Ketanserin doses are 0.015 mg/kg (A), 0.05 mg/kg (B), and 0.1 mg/kg (C). Gradual dose-dependent displacement is seen. (Reprinted from (9 [Fig. 19]) with the kind permission of Springer Science and Business Media.)
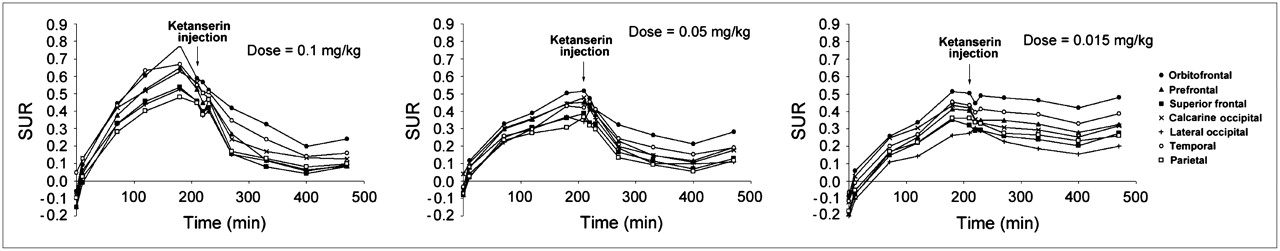
  • FIGURE 4. 
    • Download figure
    • Open in new tab
    • Download powerpoint
    FIGURE 4. 

    Mean SUR values over time for all cerebral regions studied from each pair of subjects on same ketanserin dose.

  • FIGURE 5. 
    • Download figure
    • Open in new tab
    • Download powerpoint
    FIGURE 5. 

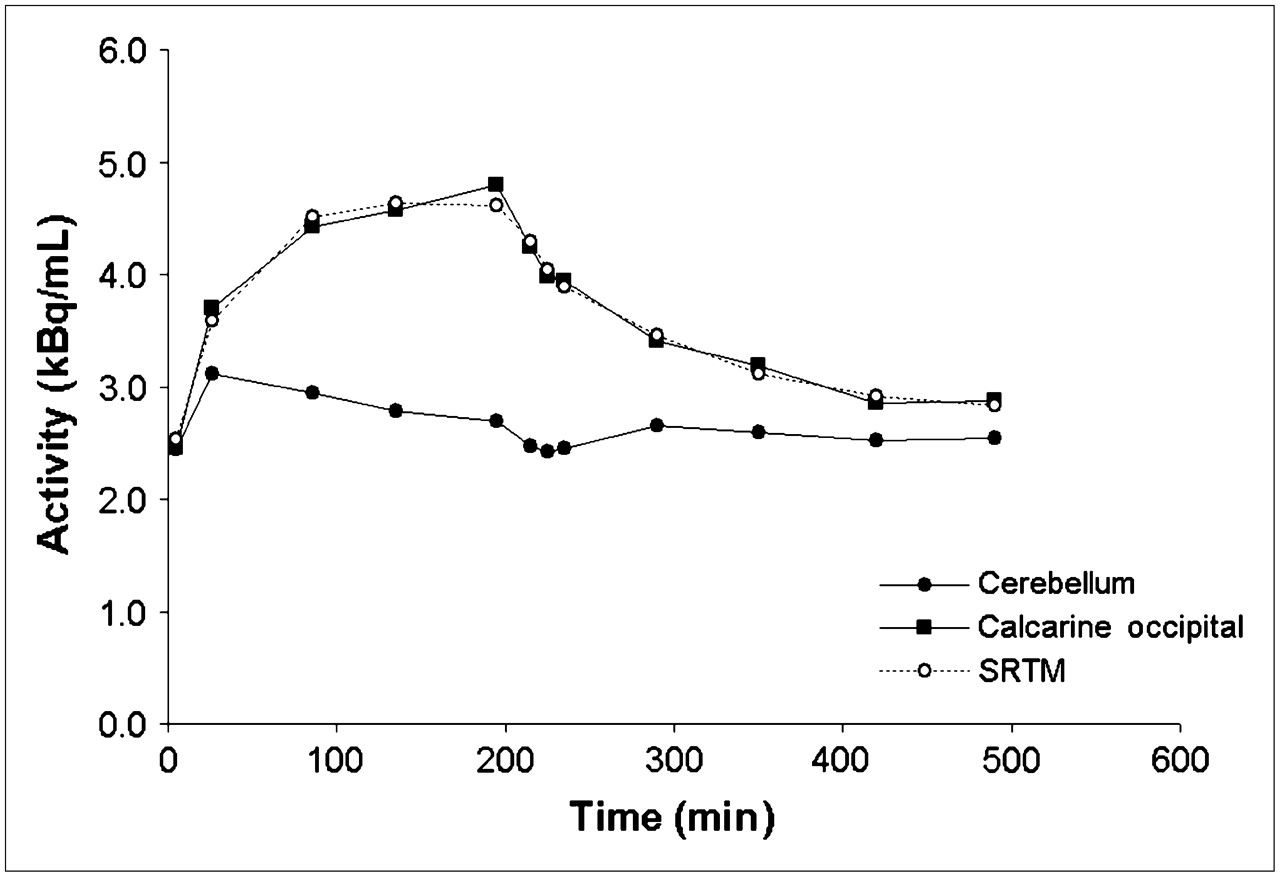
    Time–activity curves of cerebellum and occipital calcarine region, with corresponding SRTM fit, from subject receiving highest ketanserin dose, 0.1 mg/kg. Slight and transient decrease in cerebellum uptake is seen from 210 to 240 min, when largest decrease in cortical time–activity curve occurred. Cerebellum slope recovered completely by 270 min.

  • FIGURE 6. 
    • Download figure
    • Open in new tab
    • Download powerpoint
    FIGURE 6. 

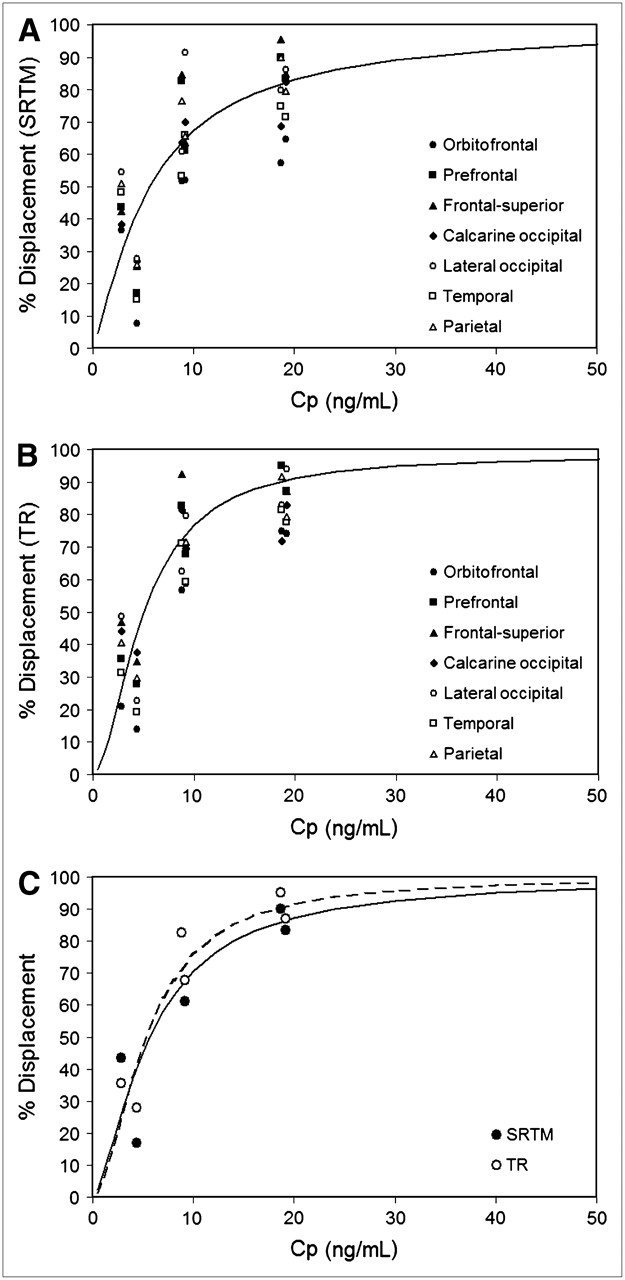
    Relationship between ketanserin plasma concentration and 123I-R91150 displacement using SRTM, for all cortical regions (A); using TR, for all cortical regions (B); and comparing model fit for both SRTM and TR in representative region (prefrontal cortex) (C).

Tables

  • Figures
    • View popup
    TABLE 1

    BP Values Calculated from SRTM, and SUR Calculated from TR, with Corresponding Percentages of 123I-R91150 Displacement for Each Region in Each Subject at the 3 Ketanserin Doses

    ROISubjectBPpreBPpostSUR180SUR400%DisplSRTM%DisplTR
    0.1 mg/kg
     Orbitofrontal10.440.190.550.1457.174.8
    20.810.291.000.2664.674.1
     Prefrontal10.410.040.490.0289.995.1
    20.680.110.810.1183.387.0
     Superior frontal10.290.010.350.0095.4101.2
    20.630.100.720.0984.987.2
     Calcarine occipital10.400.130.480.1368.771.9
    20.710.130.780.1382.282.9
     Lateral occipital10.420.080.480.0879.882.9
    20.490.070.570.0386.094.0
     Temporal10.440.110.470.0974.681.3
    20.760.220.870.2071.577.5
     Parietal10.270.030.280.0289.891.7
    20.620.130.670.1479.679.5
    0.05 mg/kg
     Orbitofrontal30.370.180.440.1951.756.7
    40.560.270.570.2452.058.6
     Prefrontal30.290.050.350.0682.582.6
    40.510.200.540.1761.167.8
     Superior frontal30.270.040.330.0284.592.5
    40.400.150.390.1263.570.4
     Calcarine occipital30.410.150.460.0963.581.4
    40.420.130.420.1369.869.4
     Lateral occipital30.250.100.280.1160.762.5
    40.460.040.450.0991.479.6
     Temporal30.320.150.390.1153.270.9
    40.460.160.470.1965.859.2
     Parietal30.170.040.21−0.0176.5102.8
    40.420.140.400.1265.571.5
    0.015 mg/kg
     Orbitofrontal50.350.320.380.337.713.8
    60.700.440.650.5136.420.9
     Prefrontal50.270.230.330.2417.027.8
    60.480.270.490.3243.635.4
     Superior frontal50.230.170.280.1825.334.8
    60.360.210.420.2342.447.0
     Calcarine occipital50.280.200.330.2126.837.6
    60.450.280.540.3038.244.0
     Lateral occipital50.180.130.160.1227.622.8
    60.370.170.370.1954.548.5
     Temporal50.280.240.310.2514.819.0
    60.640.330.600.4148.031.1
     Parietal50.270.200.300.2125.829.6
    60.400.200.420.2550.840.5
    • View popup
    TABLE 2

    Model Parameters Calculated for Each Region Using Both SRTM and TR

    SRTMTR
    ROIDisplmaxEC50γDisplmaxEC50γ
    Orbitofrontal827.11.2826.52.2
    Prefrontal1005.61.51005.31.8
    Superior frontal1005.11.61004.21.6
    Calcarine occipital925.11.3863.41.5
    Lateral occipital1004.21.11005.11.4
    Temporal1006.91.0926.01.7
    Parietal1004.81.2934.22.2
    Population means99.85.61.398.65.01.8
PreviousNext
Back to top

In this issue

Journal of Nuclear Medicine: 47 (6)
Journal of Nuclear Medicine
Vol. 47, Issue 6
June 2006
  • Table of Contents
  • Table of Contents (PDF)
  • About the Cover
  • Index by author
Print
Download PDF
Article Alerts
Sign In to Email Alerts with your Email Address
Email Article

Thank you for your interest in spreading the word on Journal of Nuclear Medicine.

NOTE: We only request your email address so that the person you are recommending the page to knows that you wanted them to see it, and that it is not junk mail. We do not capture any email address.

Enter multiple addresses on separate lines or separate them with commas.
Characterization of the SPECT 5-HT2A Receptor Ligand 123I-R91150 in Healthy Volunteers: Part 2—Ketanserin Displacement
(Your Name) has sent you a message from Journal of Nuclear Medicine
(Your Name) thought you would like to see the Journal of Nuclear Medicine web site.
Citation Tools
Characterization of the SPECT 5-HT2A Receptor Ligand 123I-R91150 in Healthy Volunteers: Part 2—Ketanserin Displacement
Ana M. Catafau, Monica Danus, Santiago Bullich, Gianluca Nucci, Jordi Llop, Sergi Abanades, Vincent J. Cunningham, Jos L.H. Eersels, Javier Pavia, Magi Farre
Journal of Nuclear Medicine Jun 2006, 47 (6) 929-937;

Citation Manager Formats

  • BibTeX
  • Bookends
  • EasyBib
  • EndNote (tagged)
  • EndNote 8 (xml)
  • Medlars
  • Mendeley
  • Papers
  • RefWorks Tagged
  • Ref Manager
  • RIS
  • Zotero
Share
Characterization of the SPECT 5-HT2A Receptor Ligand 123I-R91150 in Healthy Volunteers: Part 2—Ketanserin Displacement
Ana M. Catafau, Monica Danus, Santiago Bullich, Gianluca Nucci, Jordi Llop, Sergi Abanades, Vincent J. Cunningham, Jos L.H. Eersels, Javier Pavia, Magi Farre
Journal of Nuclear Medicine Jun 2006, 47 (6) 929-937;
Twitter logo Facebook logo LinkedIn logo Mendeley logo
  • Tweet Widget
  • Facebook Like
  • Google Plus One
Bookmark this article

Jump to section

  • Article
    • Abstract
    • MATERIALS AND METHODS
    • RESULTS
    • DISCUSSION
    • CONCLUSION
    • Acknowledgments
    • References
  • Figures & Data
  • Info & Metrics
  • PDF

Related Articles

  • This Month in JNM
  • PubMed
  • Google Scholar

Cited By...

  • The Influence of Morphine on Cerebral 5-HT2A Availability in Dogs: a SPECT Study
  • Contribution of SPECT Measurements of D2 and 5-HT2A Occupancy to the Clinical Development of the Antipsychotic SB-773812
  • Characterization of the SPECT 5-HT2A Receptor Ligand 123I-R91150 in Healthy Volunteers: Part 1--Pseudoequilibrium Interval and Quantification Methods
  • Google Scholar

More in this TOC Section

  • Feasibility of Ultra-Low-Activity 18F-FDG PET/CT Imaging Using a Long–Axial-Field-of-View PET/CT System
  • Cardiac Presynaptic Sympathetic Nervous Function Evaluated by Cardiac PET in Patients with Chronotropic Incompetence Without Heart Failure
  • Validation and Evaluation of a Vendor-Provided Head Motion Correction Algorithm on the uMI Panorama PET/CT System
Show more Clinical Investigations

Similar Articles

SNMMI

© 2025 SNMMI

Powered by HighWire