


Abstract
The aim of this study was to assess human striatal dopamine receptor 2 (D2) and cortical 5-hydroxytryptamine receptor 2A (5-HT2A) occupancy of SB-773812 to demonstrate brain penetration and binding to the target receptors and assess the pharmacokinetics–receptor occupancy relationship over time to aid dose selection and dosage regimen, in preparation for the phase II trials. Methods: D2 and 5-HT2A occupancy were measured over time (both at the time of maximum [Tmax; 6 ± 2 h] and at the time of minimum [Ttrough; 24 ± 4 h] plasma concentration after dosing) by means of 123I-iodobenzamide and 123I-4-amino-N-[1-[3-(4-fluorophenoxy)propyl]-4-methyl-4-piperidinyl]5-iodo-2-methoxybenzamide (123I-R91150) SPECT in 3 studies. Study A consisted of SB-773812 single doses in healthy volunteers—D2 occupancy measured at 48 (n = 9) and 56 mg (n = 9) and 5-HT2A occupancy at 56 mg (n = 9); study B consisted of D2 and 5-HT2A occupancy measured in 12 stabilized-schizophrenia patients on stable doses (16–18 d of 56 mg/d) after washout of previous medication; and study C included D2 occupancy measured in a double-blind study of patients with acutely exacerbated schizophrenia (n = 10) on stable doses (18–21 d) of SB-773812 (100 mg/d; n = 7) or risperidone (6 mg/d; n = 3). Results: Study A showed less than 30% D2 occupancy at Tmax, maintained at Ttrough. 5-HT2A occupancy was 74%–97% and also maintained over time. Study B revealed that 8 of the 12 schizophrenia patients showed more than 40% D2 occupancy. 5-HT2A occupancy ranged from 91% to 100%. In study C, SB-773812–induced D2 occupancy was 60.3% ± 13.3% at Tmax and 55.1% ± 4.9% at Ttrough. The pharmacokinetics–receptor occupancy relationship was assessed in each study and strengthened, combining all data to yield a concentration associated with 50% occupancy (EC50) of 92.7 ± 13.5 ng/mL for D2 and 2.11 ± 0.50 ng/mL for 5-HT2A. Conclusion: In all subjects, SB-773812 showed penetration into the brain, reaching its target receptors. In patients with schizophrenia, D2 occupancy levels induced by a single dose were maintained over time, indicating that once-daily dosing regimens are appropriate. Pharmacokinetics–receptor occupancy analysis provided guidance for the selection of a clinically effective dose, supporting progression in phase II.
The antipsychotics currently available for the treatment of schizophrenia predominantly are efficacious in ameliorating positive (psychotic) symptoms but less effective in treating negative symptoms and cognition. Additionally, these treatments may cause side effects (e.g., neurologic and metabolic), which often lead to noncompliance within the schizophrenia population (1). Thus, there is a high unmet need in this population, especially for treatments that may have increased efficacy against negative symptoms and cognition while reducing the side effect burden. SB-773812 has been specifically designed to target antagonism at those receptors believed to be associated with antipsychotic efficacy but to eliminate affinity at receptors suggested to be linked to the side effects of current antipsychotics. SB-773812 is a moderate-affinity antagonist at dopamine receptor 2 (D2) (–log expression of Ki, the inhibitor constant [pKi], 7.4) and a high-affinity antagonist at the dopamine receptor 3 (D3) (pKi, 8.5) and at the serotonin 5-hydroxytryptamine receptors 2A (5-HT2A) (pKi, 9.0), 2C (pKi, 8.1), and 6 (pKi, 8.1). It has no affinity for histamine receptor 1, muscarinic receptors 1–4, dopamine receptor 1, adrenergic receptor 1B, or adrenergic receptors 1–3. This unique receptor interaction profile is predicted to deliver efficacy against positive symptoms, with the potential for efficacy against the cognitive and negative or mood symptoms of the disease while minimizing side effects associated with other antipsychotics, including sedation, weight gain, cognitive impairment, dysphoria, and extrapyramidal symptoms. SB-773812 is characterized by a linear pharmacokinetics profile, oral clearance of approximately one third of the liver blood flow, and a large apparent volume of distribution conducive to an average terminal half-life of approximately 55 h. As such, steady state is generally achieved within 2 wk of dosing, and the steady-state pharmacokinetics profile is characterized by limited peak-to-trough fluctuations. The CYP450 isoform 3A4 appears to be a major metabolic pathway for SB-773812 (GlaxoSmithKline, unpublished data, April 2009).
Neurotransmission imaging techniques, such as PET and SPECT, play a significant role in the development process of drugs (2)—particularly relevant for drugs acting at the central nervous system, for which animal models are limited and translation to humans is extremely complicated. There are examples in the literature on how these technologies can provide evidence of drug–brain penetration and of drug action at the target and can contribute to dose selection based on the relationship between drug plasma concentrations (pharmacokinetics) and receptor occupancy in the brain (3). However, only few of these works have used SPECT. Moreover, published evidence of the contribution of these technologies to the whole development process of a particular single drug is still rare.
Independent of the imaging modality, it is important that the PET or SPECT ligand to be used in drug development trials is well characterized in humans to allow accurate interpretation of the data. SPECT ligands for 2 of the main SB-773812 targets, D2 (123I-iodobenzamide) and 5-HT2A (123I-iodobenzamide and 123I-4-amino-N-[1-[3-(4-fluorophenoxy)propyl]-4-methyl-4-piperidinyl]5-iodo-2-methoxybenzamide [123I-R91150]), were available at the time clinical development of this drug was being planned, and several benchmark studies were performed before SB-773812 was selected as a candidate for first-time-in-humans administration. First, 123I-R91150 was fully characterized in healthy volunteers (4) and shown to be a selective ligand for 5-HT2A measurements, demonstrating a dose-dependent displacement after ketanserin challenge (5). Second, the test–retest variability of a single bolus injection of 123I-iodobenzamide was reported for the first time (6). Finally, the D2 occupancy induced by marketed atypical antipsychotics was measured over time in stabilized patients to estimate the expected levels of D2 occupancy to achieve efficacy, using exactly the same methodology to be applied in the subsequent planned SPECT studies with SB-773812 (7).
The present work aimed to contribute to the development of the antipsychotic SB-773812 by investigating human brain penetration and confirming the target of action in early development as well as pharmacokinetics–receptor occupancy relationships in both healthy volunteers and patients with schizophrenia by means of 123I-iodobenzamide and 123I-R91150 SPECT.
MATERIALS AND METHODS
Three studies were performed on a group of healthy volunteers and a group of patients with schizophrenia to measure SB-773812–induced D2 occupancy, 5-HT2A occupancy, and their relationships with plasma concentration (Table 1). First, SB-773812–induced D2 and 5-HT2A occupancy was measured over time in healthy volunteers at the 2 highest doses (48 and 56 mg), previously shown to be safe and well tolerated in the first-time-in-humans single-dose escalation study (study A). Second, D2 and 5-HT2A occupancy was measured at a single time point at stable SB-773812 plasma levels after repeated administration of the 56-mg dose in patients with stable schizophrenia (study B). Finally, the D2 occupancy at stable SB-773812 plasma levels after repeated administration of 100 mg/d was measured over time in patients with acute schizophrenia (study C). All the studies were approved by the local Ethics Committees and the Spanish Ministry of Health. All subjects provided written informed consent before being included in the study.
Summary of Human SPECT Studies Performed to Contribute to SB-773812 Development
Study Subjects
All subjects had normal laboratory evaluations, including hematology; clinical chemistry; urinalysis; serology for HIV, hepatitis B, and hepatitis C; 12-lead electrocardiography; and 24-h Holter monitoring. All subjects had negative prestudy alcohol breath and urine drug screening for amphetamines, barbiturates, cocaine, opiates, cannabinoids, and benzodiazepines.
Twenty-seven healthy male volunteers (mean age ± SD, 26 ± 5 y), with no clinically significant abnormality identified on the medical and laboratory evaluations as specified, were included in the study. From the total of 26 patients with schizophrenia (24 men), 14 (mean age ± SD, 33 ± 7 y) were diagnosed with chronic schizophrenia by DSM-IV criteria (8) and were included in study B. The remaining 12 patients (mean age ± SD, 36 ± 8 y) were diagnosed with schizophrenia or schizophreniform disorder by DSM-IV criteria, showing moderate disease exacerbation with a positive and negative syndrome scale (PANSS) score of more than 70 and a score on the PANSS-positive scale of 25 or more, and were included in study C (Table 1).
Study Designs
Radiation exposure of the study subjects was kept below 10 mSv per the guidelines of the International Commission on Radiological Protection (ICRP) (category IIb in ICRP publication 62 (9)). For this reason, study designs were adapted so that a maximum of 2 SPECT scans were obtained for each subject, at least 48 h apart. A summary of the study designs is provided in Table 1.
Study A.
The whole sample of healthy volunteers (n = 27) was divided into 3 cohorts of 9 subjects each. Single SB-773812 doses were administered: 48 mg to subjects in cohort 1 and 56 mg to subjects in cohorts 2 and 3. To allow receptor occupancy estimates, each subject underwent 2 scans, one at baseline and another after drug administration. For each cohort, 5 subjects were scanned at 6 ± 2 h after drug administration (time of maximal plasma concentration, or Tmax), and 4 subjects were scanned at 24 ± 4 h after drug administration (time of minimal plasma concentration, or Ttrough). In cohorts 1 and 2, D2 occupancy was measured, and in cohort 3, 5-HT2A occupancy was measured. The selection of the time frame for scanning the subjects around Tmax was based on the pharmacokinetic characteristics of SB-773812 in previous studies on healthy volunteers and patients with schizophrenia (GlaxoSmithKline, unpublished data, April 2009), showing that SB-773812 peak plasma concentration appears to be independent of the dose or duration of dosing and is typically observed at 4–8 h after dosing. The ±2-h window allowed for some flexibility in the scanning execution and was deemed appropriate given the range of expected Tmax for SB-773812.
Study B.
After patients were included in the study and a washout of previous antipsychotic medication, they were hospitalized and received 56 mg of SB-773812 daily for 16–18 d to achieve steady-state plasma levels. SPECT scans for D2 and 5-HT2A occupancy assessments were then obtained for each subject at a single time point, 12 h after administration of the last dose. After scans were completed, patients underwent a 1-wk washout and restabilization hospitalized period and a follow-up visit 21 ± 3 d after the last SB-773812 dose.
Study C.
Patients with acute schizophrenia were hospitalized and randomized to receive either SB-773812 (100 mg/d; n = 9) or risperidone (6 mg/d; n = 3) until steady-state plasma concentration were achieved and SPECT scans acquired (18–21 d). The risperidone arm was included only to keep the investigators masked. A 1-wk washout and restabilization hospitalized period and a follow-up visit 21 ± 3 d after the last dose of study medication were conducted. D2 occupancy was calculated for each subject at Tmax and Ttrough.
Plasma Sampling
SB-773812 plasma concentrations were measured in all studies at different time points. On the day of the SPECT scan, additional samples were taken immediately before and after the SPECT scan. In study C, risperidone and its metabolite 9-hydroxyrisperidone plasma concentrations were also measured at the same time points as those for SB-773812. Plasma samples for SB-773812 were analyzed by Worldwide Bioanalysis, using validated analytic methods based on protein precipitation with acetonitrile, followed by high-performance liquid chromatography mass spectrometry or mass spectrometry analysis. Drug analysis for the determination of risperidone or 9-OH-risperidone was performed using a validated assay methodology (liquid chromatography mass spectrometry or mass spectrometry) by York Bioanalytical Solutions, under the guidance of Worldwide Bioanalysis, DMPK, GlaxoSmithKline.
SPECT Methodology
123I-iodobenzamide and 123I-R91150 SPECT scans were acquired as described elsewhere (4,10). A 3-head camera (Prism 3000S; Philips) fitted with ultra-high-resolution fanbeam collimators was used. Subject preparation included administration of potassium perchlorate (8 mg/kg) up to 20 min before ligand administration to minimize radiation exposure to the thyroid gland. Four multimodality SPECT/MRI markers (MM3003; IZI Medical Products Corp.), each filled with approximately 0.074 MBq of 123I, were firmly stuck to the subject's head on the mastoids and at the corners of the eyes and remained in the same position until both SPECT and MRI acquisitions were finalized. For D2 measurements, 60-min scan acquisitions started at 120 min after intravenous injection of 123I-iodobenzamide (153.8 ± 19.2 MBq). For 5-HT2A measurements, 60-min scan acquisitions started at 180 min after intravenous injection of 123I-R91150 (146.6 ± 18.6 MBq). Ligand injections were followed by a 20-mL saline serum flushing. In all the SPECT explorations, the following acquisition parameters were used: step-and-shoot mode, 360° circular orbit, 120 steps, 3°/step, and a 128 × 128 matrix.
All subjects underwent a T1-weighted 3-dimensional MRI scan on the same day as the SPECT scan using a superconductive 1.9-T system (Prestige 2T; GE Healthcare) equipped with a head coil. An axial 3-dimensional spoiled gradient-echo slab was positioned to include the entire head, and images were acquired with the following parameters: repetition time, 25 ms; echo time, 6 ms; flip angle, 28°; field of view, 25 × 25 cm; matrix size, 256 × 256; section thickness, 2 mm, with no interslice gap; and number of excitations, 1.
SPECT Image Reconstruction and Processing
Images were reconstructed using the filtered backprojection algorithm with the Odyssey-FX software (Philips), applying a 2-dimensional Butterworth filter (fifth order, 0.4 cycle per pixel). The Chang algorithm, with a manually fitted elliptic attenuation map on each slice (μ = 0.1 cm−1), was used for attenuation correction. SPECT and MRI scans were registered using fiducial markers with software implemented in-house. In short, the corresponding external markers were manually identified on the MRI and SPECT scans. Then, rigid-body transformation (3 translations and 3 rotations) was estimated automatically by minimizing the sum of the squared distances between the corresponding marker positions (11).
Regions of interest (ROIs), including the cerebral regions with specific and nonspecific uptake, were manually drawn on each subject's MR image and translated (copied) to the corresponding SPECT slices after coregistration. For 123I-iodobenzamide, ROIs were drawn on the whole striatum (S) and the occipital cortex (O). For 123I-R91150, ROIs were drawn on cortical regions (Ctx) and the cerebellum (C) (Fig. 1).

Selected MRI and coregistered SPECT slices at basal ganglia level (top and middle rows) and at cerebellum level (bottom row), showing representative ROIs drawn on basal ganglia and occipital cortex for D2 quantification (top row) and on cortical regions and cerebellum for 5-HT2A quantification (middle and bottom rows). IBZM = iodobenzamide.
The specific uptake ratio (SUR) was calculated as the ratio of specific-to-nondisplaceable activity according the following equations: for 123I-iodobenzamide, SUR = (S − O)/O; for 123I-R91150, SUR = (Ctx − C)/C. The proportion of receptors occupied by the drug (RO) was calculated using the following equation:
For both studies B and C, baseline values from the healthy volunteers in study A were used for receptor occupancy estimates. In all studies, plasma samples were drawn to allow a full pharmacokinetic profile.
Pharmacokinetics–Receptor Occupancy Relationships
The relationship between SB-773812 plasma concentration and D2 or 5-HT2A occupancy was assessed using a population pharmacokinetic pharmacodynamic approach as implemented in NONMEM (version VI; GloboMax). The data were analyzed with the classic hyperbolic equation (derived from the law of mass action):
RESULTS
Study A
Individual D2 and 5-HT2A occupancy data over SB-773812 plasma concentrations from study A are shown in Figure 2, and Figure 3 shows representative baseline and postdrug SPECT images. After single 48- and 56-mg SB-773812 doses, healthy volunteers showed low D2 occupancy (<30%) both at Tmax and Ttrough (Table 2), whereas a high 5-HT2A occupancy was measured at Tmax, ranging from 74.4% to 97.1% across the regions analyzed. This high receptor occupancy was maintained at Ttrough, ranging from 72.1% to 97.8% across regions.

Individual values of D2 and 5-HT2A occupancy from study A. 5-HT2A occupancy values are mean of all cortical regions.

Coregistered SPECT/MR images from representative healthy volunteers (study A, left) and patients with schizophrenia (studies B [right top] and C [right bottom]). Percentages of D2 and 5-HT2A occupancy values are shown for each individual case. 5-HT2A occupancy values are mean of all cortical regions.
Mean D2 Occupancy and Plasma Concentrations Measured Over Time in Studies A, B, and C
Study B
Only 12 of the 14 patients completed all the scans. Mean D2 occupancy in the 12 patients with chronic schizophrenia at stable plasma levels of SB-773812 (56 mg) measured 12 h after last dose administration was 42.7% ± 25.2% (range, 6%–81%) (Fig. 3). Eight patients showed more than 40% D2 occupancy. Only 10 of the 12 patients undergoing the first SPECT session with 123I-iodobenzamide underwent the second SPECT session with 123I-R91150. Mean values of 5-HT2A occupancy ranged from 91.4% to 100% across the cortical regions analyzed. D2 occupancy and 5-HT2A occupancy data from studies A and B were fitted to the corresponding Emax models as shown in Figures 4 and 5.

Individual 5-HT2A occupancy data from studies A and B and corresponding Emax model fitting. Dashed lines correspond to 95% confidence interval. 5-HT2A occupancy values are mean of all cortical regions.

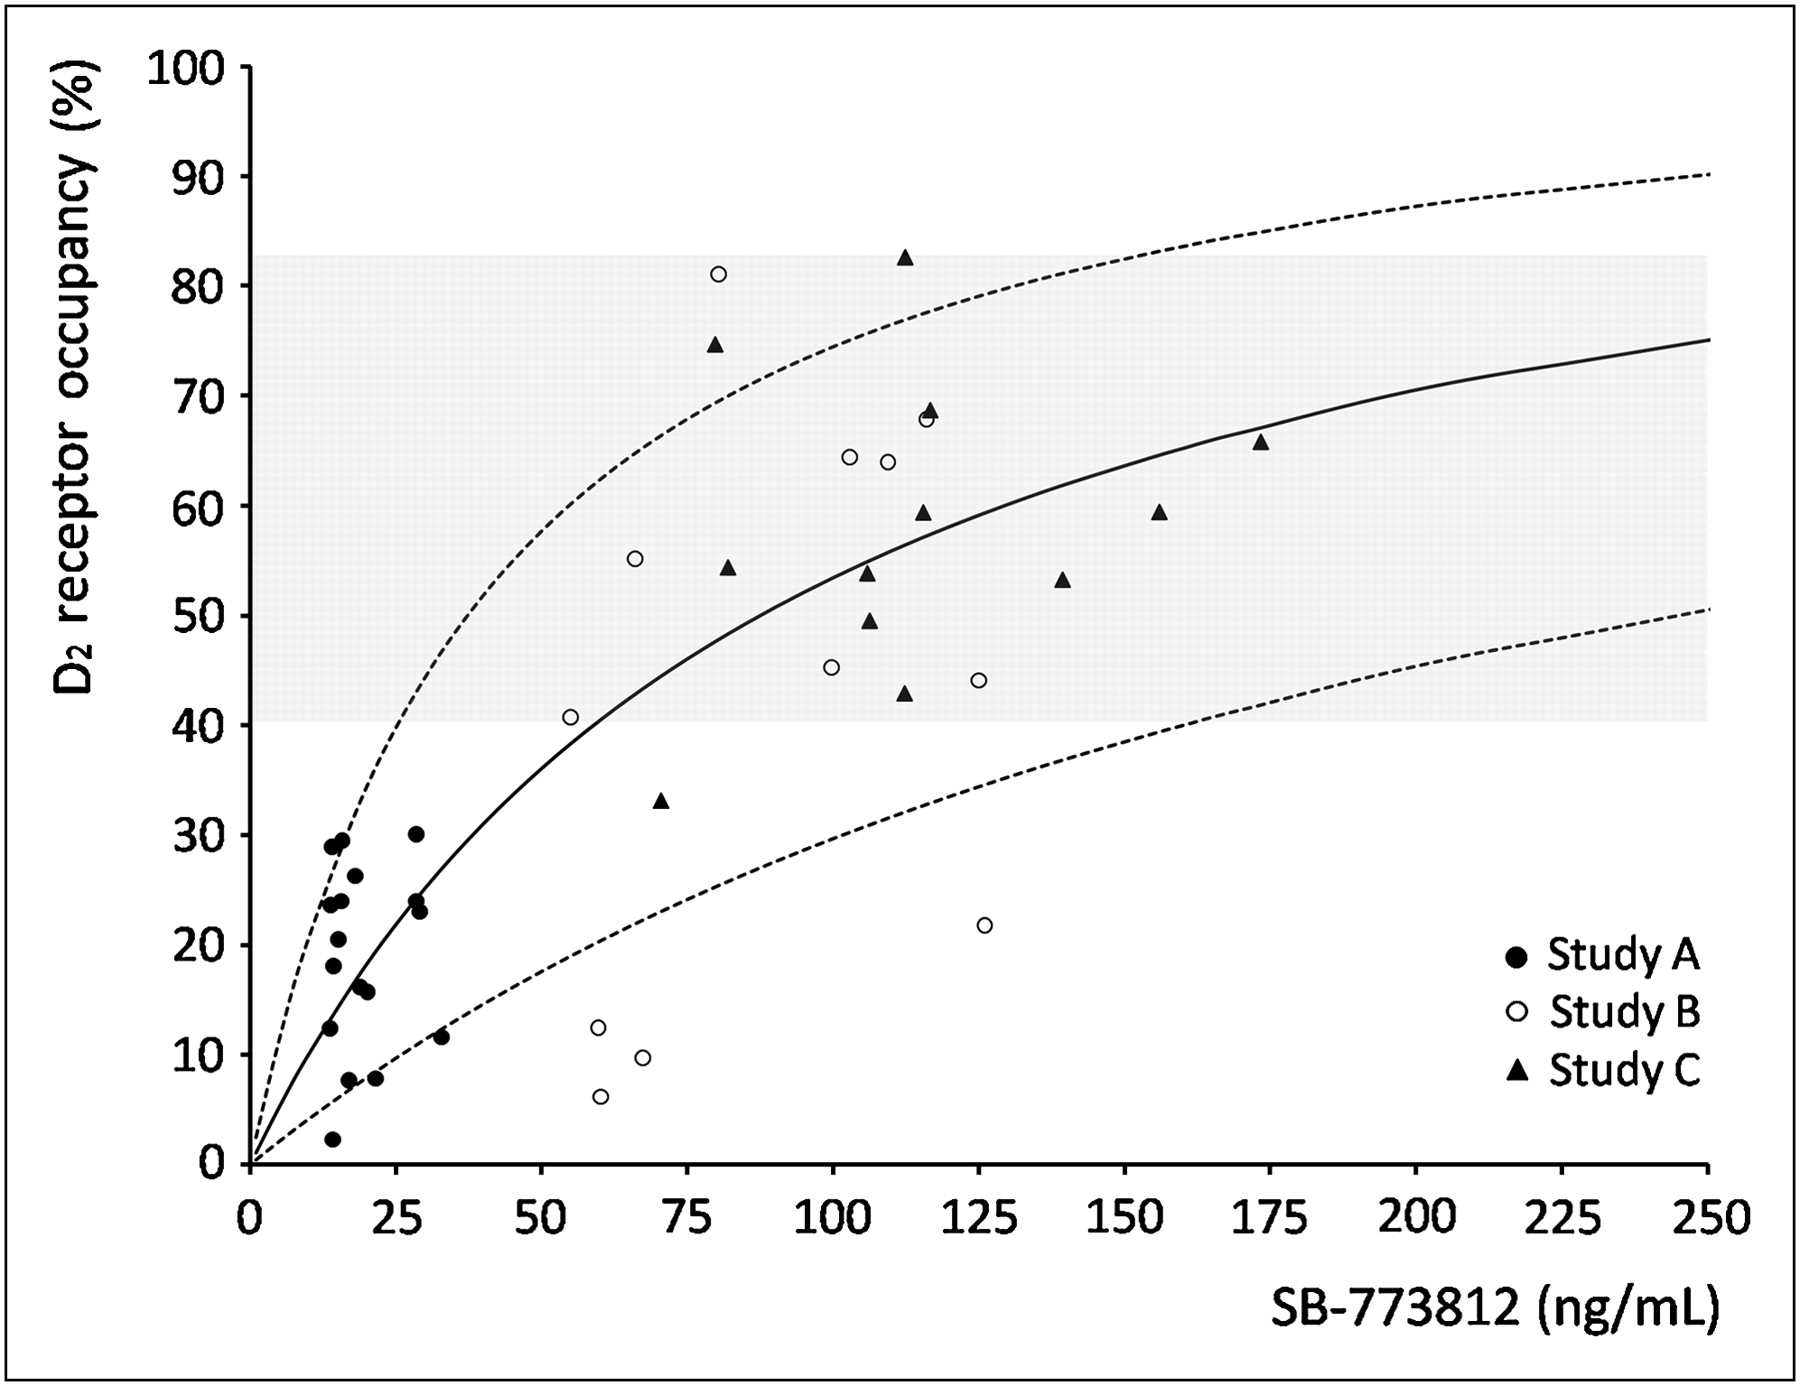
Individual D2 occupancy data from studies A, B, and C with corresponding Emax model fitting. Dashed lines correspond to 95% confidence interval.
Study C
Only 10 of the 12 subjects had SPECT scans completed, 7 on SB-773812 (n = 5 with Tmax and Ttrough scans completed), and 3 on risperidone (Table 1). D2 occupancy and plasma concentration results at Tmax and Ttrough from patients on repeated doses of SB-773812 (100 mg/d) or risperidone (6 mg/d) are presented in Table 2 and Figures 5 and 6. Data from the patients in this study were added to the previous D2 occupancy data from studies A and B to fit the Emax model with all the data together. At high plasma concentration, D2 occupancy values were lower for SB-773812 (range, 43%–83%) than for risperidone (range, 81%–88%). Furthermore, SB-773812 showed more stability over time (SB-773812 range, 33%–75%, vs. risperidone range, 60%–67%, at Ttrough) (Fig. 6).

Individual D2 occupancy values at Tmax and Ttrough from subjects in study C. Dashed lines correspond to patients on risperidone.
Pharmacokinetics–Receptor Occupancy Relationship
Although each individual study was analyzed separately, in all cases SB-773812 plasma concentrations and receptor occupancy were fitted using the classic hyperbolic equation (i.e., an Emax model), and the estimated drug potency was generally consistent across the studies (Table 3; Figs. 4 and 5). R2 of model fitting was 0.7 for D2 occupancy and 0.4 for 5-HT2A occupancy data. When all data were pooled and analyzed together, EC50 calculations were precise (SEE of estimated value, ∼15% [D2 occupancy] and 24% [5-HT2A occupancy]) but associated with a substantial predicted between-subject variability of around 70% (Table 3). The nonlinear mixed-effect approach was used to test for the potential effect of subject type on D2 drug potency and on scan time or day of dosing. None of these possible covariates resulted in a significant improvement in model fitting (P > 0.58 in all cases). Similarly, estimating Emax rather than fixing it to 100% did not improve significantly the D2 fitting (P = 0.18) because the Emax estimate was fairly close to 100% (93% ± 14%).
Estimated EC50 Values (Mean ± SE) for Both D2 and 5-HT2A Receptor Targets with Between-Subject Variability from Each Study and from All Studies Pooled Together
DISCUSSION
This paper shows how 123I-iodobenzamide and 123I-R91150 SPECT was used to contribute to the development of the antipsychotic SB-773812 from early phase I single-dose trials in healthy volunteers to phase II repeated-dose trials in patients with schizophrenia. To the best of our knowledge, this is the first time that SPECT has been used as a decision-making tool throughout the drug development process from first time in humans to proof of concept.
Despite the complexity and high cost of the PET technology, compared with SPECT, most neuroimaging studies for drug development have used PET because of its better imaging resolution, more accurate quantification, and lower variability. It is also more feasible to develop PET ligands than SPECT ligands for new target molecules. However, in those cases in which a SPECT ligand for a target is available, SPECT is a valuable alternative that provides the same information at a lower cost (11). Nevertheless, data on antipsychotic pharmacokinetics–receptor occupancy relationships are far more limited with SPECT than with PET. Sigmoidal Emax models using plasma concentration data are usually available in PET studies (12–17), whereas the most usual case in the SPECT literature is to use the antipsychotic dose as a variable for the study of pharmacokinetics–receptor occupancy relationships (18–23). To the best of our knowledge, only 2 SPECT studies have used plasma concentrations for pharmacokinetics–D2 occupancy relationship profiles (7,18). Similarly, the influence of the time of scanning after last antipsychotic dose intake on D2 occupancy variability has been reported using PET (24–26), but there is only 1 SPECT study reporting the importance of antipsychotic-induced D2 occupancy assessments over time to fully characterize the pharmacokinetics–receptor occupancy profiles (7). A carefully designed prospective within-subject comparison of the D2 occupancy values measured with 11C-raclopride PET and 123I-iodobenzamide SPECT was recently reported (10,28). Although D2 occupancy measurements with both techniques were well correlated, SPECT measurements were consistently 9%–14% lower than PET measurements. These data offer further evidence that both techniques provide the same information, but to compare D2 occupancy measurements, this bias should be considered.
D2 and 5-HT2A occupancy results after single doses of SB-773812 in healthy volunteers (study A) provided evidence of the compound brain penetrability in humans and confirmed its action at the 2 receptor targets. Moreover, a high 5-HT2A occupancy (>70%) was measured at a low exposure associated with a single 56-mg dose, supporting the in vitro profile of SB-773812 high affinity for this receptor. This high 5-HT2A occupancy was measured at both Tmax and Ttrough, independently of the fact that lower plasma concentrations were measured at Ttrough, thus suggesting that a 56-mg dose was nearly saturating 5-HT2A. Similar levels of D2 occupancy were found after single doses of both 48 and 56 mg, which were below 30% in all cases. Taken altogether, these data supported a go decision at this early stage of SB-773812 development, and the preliminary estimate of drug potency for D2 and 5-HT2A was used to design subsequent clinical exploration (including studies B and C).
A wide range of both D2 occupancy and D2 plasma concentrations was found in patients with schizophrenia from studies B and C (repeated administration of SB-773812, 56 and 100 mg/d, respectively), but most showed a D2 occupancy between 40% and 80%. A wide range of both D2 occupancy and plasma concentrations was also found in our benchmark study in stabilized patients with schizophrenia on marketed antipsychotics (risperidone, olanzapine, clozapine, and quetiapine) (7). That study also showed that at therapeutic doses of those antipsychotics, clinical response may be maintained, with SPECT-measured D2 occupancy values below 65% D2 occupancy (7), in agreement with data from Frankle et al. (29), showing D2 occupancy levels of 55% ± 11% induced by olanzapine (10 mg/d) and of 69% ± 8% induced by risperidone (6 mg/d), measured by 123I-iodobenzamide SPECT. Evidence of 40%–80% D2 occupancy in schizophrenic patients from studies B and C gave confidence about the likelihood of proving efficacy in later development phases at both 56- and 100-mg/d doses, thus minimizing risk of dose selection for phases II and III.
The estimated EC50 for 5-HT2A occupancy (2.11 ± 0.50 ng/mL) was about 45-fold lower than that for D2 occupancy (mean, 92.7 ± 13.5 ng/mL), confirming in vivo the much higher affinity of SB-773812 for 5-HT2A blockade than for D2 blockade (as per in vitro design, GlaxoSmithKline, unpublished data, April 2009). Therefore, at expected therapeutic SB-773812 doses (i.e., doses delivering at least 50% D2 occupancy) 5-HT2A was predicted to be fully blocked. Nonlinear mixed-effect models were used as the natural approach for analyzing the sparse SPECT receptor occupancy measurements (collected at different scan times in different populations and with different dosing regimens), allowing the assessment of between-subject variability in drug potency, which was found to be moderate to high for both targets (Table 3). Potential covariates were tested to explain variability, but none yielded a significant improvement in model fitting. These covariates included subject type (healthy volunteer, acute or chronic patient), chronic versus acute experiment, and timing of SPECT scan. Timing supported the fact that SB-773812 showed stable plasma concentrations and D2 occupancy over time.
The high variability found for D2 occupancy values is a limitation of this study. A higher variability in D2 occupancy estimates has been reported using SPECT than PET (10). Moreover, the use of a healthy volunteer group for receptor occupancy estimations in patients with schizophrenia may have contributed to this variability, given the reported differences in D2 density between the 2 groups (30). These differences have not been found in 5-HT2A availability (31), supporting the lower variability found in 5-HT2A occupancy estimations. Age-related differences between the healthy volunteer and patient groups might also account for the high D2 occupancy variability. An approximately 5% decrease per decade in D2 R availability above the age of 30 y has been reported (32). In our study, the mean age of the healthy volunteer group was lower than that of the patient groups (Table 1). However, the latter were still on their third decade, so the effect of age in the D2 occupancy estimations was predicted to be minimal.
A risperidone arm was included in this study to keep the investigators masked, and D2 occupancy comparisons between SB-773812 and risperidone were not planned. Subjects administered risperidone were scanned at the same time frames as subjects administered SB-773812 to keep the study masked, although risperidone Tmax has been reported to be around 1.5 h (7,33). Therefore, the D2 occupancy values at 6 ± 2 h are representative of high plasma levels for both drugs, but risperidone peak D2 occupancy values would probably be higher than those observed in our study at approximately 6 h after dosing, as previously reported (7). Nevertheless, the D2 occupancy profiles from 6 to 24 h after dosing showed that SB-773812–induced occupancy was more stable with time. This stability is likely driven by the SB-773812 stable plasma profile, which, coupled with its moderate D2 affinity, makes excessively high D2 blockade in patients an unlikely achievement. Data and modeling results from studies B and C further supported progression of the development of SB-773812, contributed to the proof of concept, and helped in the dose selection for phase II trials.
CONCLUSION
SPECT is a valuable tool for drug development when the appropriate radioligands are available and well characterized. The single-dose study in healthy volunteers demonstrated SB-773812 brain penetration and binding to target receptors in humans, supporting a go decision at early stages of development and providing preliminary estimates of target plasma concentrations and doses for further clinical development. Subsequent studies in patients with schizophrenia at repeated doses confirmed a high 5-HT2A occupancy, with moderate D2 occupancy maintained over time, supporting a once-a-day dose regimen. Finally, the pharmacokinetics–receptor occupancy predictions were in reasonable agreement across studies and provided guidance for the selection of therapeutic doses to be tested in the clinical setting.
APPENDIX
Barcelona Clinical Imaging in Psychiatry Group (BCIPG) Members
Ana M. Catafau, Discovery Medicine, Neurosciences Centre of Excellence for Drug Discovery, GlaxoSmithKline, Barcelona, Spain, and Verona, Italy; María M. Penengo, Santiago Bullich, Marina Suarez, Vanessa Gomez, Jordi Llop, and Carlos Trampal, CRC Corporation, Barcelona, Spain; Iluminada Corripio, Víctor Pérez, and Enric Álvarez, Psychiatry Department, Red de Enfermedades Mentales-Trastornos Afectivos y Psicoticos (REM-TAP Network) Hospital de Sant Pau, Barcelona, Spain; Magí Farré, Grupo Farmacología Humana y Neurociencias, IMIM-Hospital del Mar, Universitat Autónoma de Barcelona; Edith Pomarol and Salvador Sarró, Benito Menni, Complex Assitencial en Salut Mental, CIBER en Salud Mental (CIBERSAM); Enrique Del Moral, Nicolás Ramirez, Josep Salavert, and Luis San, Psychiatry Department, Hospital San Rafael, Barcelona, Spain; Carles Garcia-Ribera, Purificación Salgado, Alfonso Rodríguez, and Salvador Ros, Mental Health and Drug Addiction Department, Hospital del Mar and Psychiatry Institute, IMAS, Barcelona, Spain; and Javier Perich, Magnetic Resonance Department, CRC-MAR, Hospital del Mar, Barcelona.
Acknowledgments
We thank all the CRC staff who participated in the SPECT scanning; the Medical Department from GlaxoSmithKline Spain, particularly Juan Lahuerta and Luis Guardiola-Gómez for their support; and all the subjects participating in the studies. This study was funded by GlaxoSmithKline. Ana M. Catafau, Gianluca Nucci, Clare Burgess, Frank Gray, and Emilio Merlo-Pich were GlaxoSmithKline employees at the time these studies were designed, executed, and analyzed.
- © 2011 by Society of Nuclear Medicine
REFERENCES
- Received for publication August 5, 2010.
- Accepted for publication December 20, 2010.


Jump to section
Related Articles
Cited By...
- No citing articles found.