


Abstract
With the aim of characterizing radioiodinated 4-amino-N-1-[3-(4-fluorophenoxy)propyl]-4-methyl-4-piperidinyl]5-iodo-2-methoxybenzamide (123I-R91150) as a SPECT ligand for subtype 2A of the 5-hydroxytryptamine receptor (5-HT2A), tracer kinetic compartmental analyses were compared with the tissue ratio method (TR). The pseudoequilibrium interval after a single bolus injection was identified, and a reference database of specific uptake ratio (SUR) values was obtained. Within-scan and between-subject variability was also assessed. Methods: Nineteen healthy men (mean age ± SD, 24.4 ± 3.3 y) were included and separated into 2 groups. Dynamic scans with venous blood sampling from 0 to 470 min after a single bolus injection of 123I-R91150 was completed for 7 of the 9 subjects included in group A, and in one of them compartmental modeling was performed with an arterial blood input function using 1-tissue-compartment (1TC) and 2-tissue-compartment (2TC) models. Binding potential (BP) using the simplified reference tissue model (SRTM) (BPSRTM) and SUR values using TR over time were also calculated. The 10 remaining subjects (group B) underwent a single scan at pseudoequilibrium with the aim of improving the precision of mean normal SUR estimates. Regions of interest in cortical regions and basal ganglia for specific uptake, and in cerebellum for nonspecific uptake, were manually drawn on each subject's MR images and translated to the corresponding SPECT slices after coregistration. Results: The 1TC model correlated well with the 2TC model (BP2TC = 1.04·BP1TC – 0.01, R2 = 0.98), and both methods correlated with BPSRTM and SUR with little bias (BP1TC = 1.10 BPSRTM + 0.03, R2 = 0.98; BP2TC = 1.15 BPSRTM + 0.01, R2 = 0.98; BPSRTM = 0.99 SURmean + 0.01, R2 = 0.98). SUR values stabilized from 180 min after injection in most cortical regions, ranging from 0.51 ± 0.10 in the orbitofrontal region to 0.27 ± 0.09 in the parietal region. Within-scan and between-subject variability among regions ranged from 10% to 14.8%, and from 18.3% to 35.4%, respectively. Conclusion: 123I-R91150 distribution agrees with autoradiography results, showing highly specific binding in cortical regions. The correlations found among 1TC, 2TC, SRTM, and TR outcome measurements support the use of TR for quantification of 5-HT2A receptor binding with 123I-R91150 SPECT and a simple protocol avoiding arterial blood sampling and serial scanning over time.
Radioiodinated 4-amino-N-1-[3-(4-fluorophenoxy)propyl]-4-methyl-4-piperidinyl]5-iodo-2-methoxybenzamide (123I-R91150) is a suitable ligand for SPECT imaging of subtype 2A of the 5-hydroxytryptamine receptor (5-HT2A) in the human brain. 123I-R91150 SPECT has been used to investigate several psychiatric disorders (1–6) and to measure drug-induced 5-HT2A receptor occupancy (7–10). In these previous studies, a single SPECT acquisition after bolus injection was used to calculate the specific uptake ratio (SUR) using the simple tissue ratio method (TR) at pseudoequilibrium. Because of its simplicity, this method optimizes scanning feasibility and the subject's compliance. However, validation of TR against kinetic compartmental analysis in humans is still needed.
The present study aimed to characterize 123I-R91150 as a SPECT radioligand for assessment of cerebral 5-HT2A receptors in healthy volunteers. Tracer kinetic compartmental analyses based on dynamic time-course data with an arterial plasma input function and the simplified reference tissue model (SRTM) were compared using TR. The pseudoequilibrium interval after a single bolus injection was identified, and a reference database of SUR values was obtained. Moreover, within-scan variability at pseudoequilibrium, between-subject variability, and 123I-R91150 behavior in plasma were assessed. The specificity of ligand binding to the 5-HT2A receptor and confirmation of the cerebellum as a reference region for SUR calculations was investigated by means of a ketanserin displacement study reported separately (11).
MATERIALS AND METHODS
Subjects
Nineteen men (mean age ± SD, 24.4 ± 3.3 y) determined through the Structured Clinical Interview for DSM-IV to be healthy were enrolled in this study. None had a history of psychiatric treatment or significant medical events. None was taking psychotropic drugs or other relevant medication. Absence of illegal drug abuse was assessed by questioning and supported by urine drug screening (InstaCheck Drug Screen Test; Applied Biotech/Forefront Diagnostics). Subjects had to withdraw from caffeine and alcohol 24 h before the study day and were not allowed to take any drugs during the 7 d before the study day. All had normal findings on physical examination, 12-lead electrocardiography, clinical chemistry, and hematology. The study was approved by the local Ethics Committees and the Spanish Ministry of Health, and written informed consent was obtained from all subjects before inclusion in the study.
Synthesis of 123I-R91150
Radioiodination by direct electrophilic substitution was performed on the 5-position of the methoxybenzamide group of 4-amino-N-[1-[3-(4-fluorophenoxy)propyl]-4-methyl-4-piperidinyl]-2-methoxybenzamide by means of in situ–prepared peracetic acid and no-carrier-added Na123I (Tyco Healthcare) to obtain 123I-R91150, as reported previously (12). Briefly, 500 μL of no-carrier-added Na123I (+ carrier; 0.532 nmol of sodium iodide per 37 MBq of 123I) were added to a V-vial containing 40 μg of R91150 in 300 μL of glacial acetic acid. To this solution, 100 μL of H2O2 (30% solution) were added in 4 steps at 0, 10, 20, and 25 min. The reaction was stopped at 30 min with 0.5 mL of a 0.5 mol/L solution of sodium sulfite in a 4.5 mol/L solution of NaOH. After labeling, the reaction mixture (volume, 1–2 mL) was injected into a guard column (C-1035, 10 × 10 mm; Upchurch England) filled with Perisorb RP-8 resin [Merck] and further purified by means of high-performance liquid chromatography (HPLC) (RP Select B, [Merck] 250 × 4 mm, 10 μm with an isotonic ethanol/acetate solution as eluent). The collected 123I-R91150 fraction was further diluted with an isotonic citrate/acetate buffer (end pH, 6.0–6.4), filtered through a Millex-FG filter (Millipore), and autoclaved. The filter was pretreated with ethanol and rinsed with diluent to avoid stickiness. A trace of o-iodo-hippuric acid (1 mg/mL of diluent) was added to the diluent to prevent deiodination during autoclaving and transportation. The specific activity of the autoclaved 123I-R91150 was approximately 300 TBq/mmol. Radiochemical purity at the time of administration (i.e., 24 h after synthesis) was higher than 96%.
Subject Preparation and SPECT Procedure
SPECT was performed using a 3-head Prism 3000S camera (Philips) fitted with ultra-high-resolution fanbeam collimators. The preparation of each subject included administration of potassium perchlorate (8 mg/kg) up to 20 min before 123I-R91150 injection to minimize exposure of the thyroid gland to radiation. Four multimodality SPECT/MRI markers (MM3003; IZI Medical Products Corp.), each filled with approximately 0.074 MBq of 123I, were firmly attached to the subject's head at the level of the mastoids and the corners of the eyes and remained in the same position until both the SPECT and the MRI acquisitions were finalized.
The subjects were separated into 2 groups. Group A consisted of 9 healthy men (mean age, 24.4 ± 3.2 y; range, 20–29 y) who underwent sequential SPECT over time with blood sampling. Scanning sessions consisted of one 10-min, five 30-min, and three 40-min frames collected using a 360° circular orbit, step-and-shoot mode every 30°, on a matrix size of 128 × 128 pixels, starting at 0, 11, 71, 120, 180, 240, 330, 400, and 470 min after injection. The subjects were allowed to rest outside the SPECT camera during breaks between acquisitions. A venous catheter for blood sampling was inserted in the arm opposite the radioligand injection in all subjects. An additional catheter for arterial blood sampling (Leader Cath Arteriel 18 G; Laboratoires Pharmaceutiques) was placed in the radial artery after local anesthesia with lidocaine 2% in 1 subject. 123I-R91150 (148–222 MBq) was injected intravenously when the acquisition began and was flushed with 20 mL of saline serum. Two of the 9 subjects in group A could not complete the entire scan session because of a camera breakdown, but venous blood samples were drawn for radioligand analysis up to 470 min after injection. Therefore, in a total of 7 subjects (mean age, 23.4 ± 2.6 y; range, 20–27 y), the entire scanning session was completed.
Group B consisted of 10 healthy men (mean age, 24.3 ± 3.6 y; range, 20–29 y) who underwent a 30-min scan starting at 180 min after injection.
MRI
All subjects underwent T1-weighted 3-dimensional MRI on the same day as the SPECT scan using a superconductive 1.9-T system (Prestige 2T; GE Healthcare) equipped with a head coil. An axial 3-dimensional spoiled gradient-echo slab was positioned to include the entire head, and images were acquired with the following parameters: repetition time, 25 ms; echo time, 6 ms; flip angle, 28°; field of view, 25 × 25 cm; matrix, 256 × 256; section thickness, 2 mm with no interslice gap; and number of excitations, 1.
Image Processing
Images were reconstructed using a filtered-backprojection algorithm with a Butterworth filter (exponent, 5.0; cutoff frequency, 0.4 cycle/pixel). Pixel sizes were between 2.44 and 2.52 mm on each slice and 3.6 mm in the axial direction. Attenuation correction was performed using the Chang algorithm and a manually fitted elliptic attenuation map on each slice (μ = 0.1 cm−1). SPECT and MRI scans were registered using in-house software implemented in C language. First, the corresponding external markers were manually identified on the MRI and SPECT scans. Then, rigid-body transformation (3 translations and 3 rotations) was estimated automatically by minimizing the sum of the squared distances between the corresponding marker positions (13).
Regions of interest (ROIs) were drawn manually by the same investigator on the MR image of the frontal, temporal, occipital, and parietal lobes and the thalamus, striatum, and cerebellum. The frontal lobe was divided into orbitofrontal, prefrontal, and superior frontal regions. The temporal lobe was divided into mesial (including amygdala and hippocampus) and lateral (temporal cortex) regions, and the occipital lobe was divided into calcarine and lateral regions.
Data Analysis
Tracer kinetic modeling including 1TC and 2TC analysis and SRTM were used for data analysis, and the results were compared with those obtained with TR.
The 1TC and 2TC analyses were applied to the subject who provided arterial blood samples. The 2TC model assumes that the activity in tissue can be separated into 2 compartments: Free and nonspecifically bound compartments are considered a single compartment, and specifically bound tracer is considered another compartment. The 1TC model assumes that the free, nonspecifically bound, and specifically bound compartments all equilibrate rapidly and may be considered a single compartment. The set of regional time–activity curves was fitted to the 1TC and 2TC models using the metabolite-corrected plasma input curves, and the total volume of distribution (VD) was calculated for both models (the blood volume component was fixed to 5%). Equations used to calculate VD are described in Erlandsson et al. (14). Binding potential (BP) in 1TC (BP1TC) and 2TC (BP2TC) models was calculated as (VDSp – VDRef)/VDRef, where VDSp and VDRef were the VDs in the region with specific uptake and in the reference region (cerebellum). The VDRef was always calculated using 1TC.
Quantification using the SRTM was applied to all subjects from group A who underwent the entire SPECT session (n = 7). Cerebellum time–activity curves were used to provide the input function to the kinetic model. BP using SRTM (BPSRTM) was the outcome measurement, as described in Lammertsma et al. (15). TR was applied to all subjects (groups A and B, n = 17). SUR values were calculated as ([Creg − Ccer]/Ccer), where Creg and Ccer were the mean counts at pseudoequilibrium in the studied cerebral region and in the cerebellum, respectively. SUR curves over time were obtained from group A, and the pseudoequilibrium interval was defined as the period during which SUR values were stable.
Plasma Analysis
Plasma analysis of 123I-R91150 was performed for 9 subjects. A total of 16 venous blood samples were collected manually, at −1 (baseline), 0.25, 0.5, 1, 1.5, 2, 5, 10, 15, 71, 120, 180, 240, 330, 400, and 470 min after injection, in all subjects. In 1 subject, venous and arterial blood samples were collected simultaneously. Arterial and venous blood samples were processed by the same procedure. The first blood sample (at −1 min), which contained no activity, was extracted as a reference. Samples 2–16 were separated into 2 fractions (1 mL each), introduced into 1.5-mL flasks with a micropipette, and centrifuged at 2,000g for 4 min. The plasma fraction was separated, and both the plasma and the residue fractions were counted in a γ-counter (2200 Scaler Ratemeter; Ludlum Measurements Inc.) for 30 s. All samples were further processed by analytic HPLC to determine the fraction of plasma activity representing unmetabolized radiotracer. For this purpose, 1 mL of pure acetonitrile was added to the plasma fraction, and after being mixed for 20 s, the samples were centrifuged at 2,000g for 4 min. The liquid phase was separated from the precipitate by decantation, and both fractions were counted in the γ-counter. For HPLC analysis, both liquid phase fractions corresponding to the same blood sample were joined, and the resulting solution was evaporated at 40°C under a continuous flow of helium. The residue was diluted in 100 μL of mobile phase and injected into the HPLC system. The HPLC system consisted of an 1100 series chromatograph (Agilent Technologies) equipped with a 1100 series isocratic pump, a Rheodyne injector with a 20-μL loop, a temperature-controlled column compartment (temperature set-point, 25°C), and a ZORBAX Eclipse XDB-C8 column (4.6 × 150 mm, 15 μm; Agilent Technologies) and a γ-detection system (GABI; Raytest) equipped with a 250-μL flow cell. The whole system was controlled by Gina-Star software (Raytest), with decay correction in real time. The detection energy window was adjusted to 159 ± 50 keV. A 65:35 mixture of acetonitrile:water was used as the mobile phase. The chromatographic runs were performed under isocratic conditions, at a flow of 1 mL/min, with a total chromatographic time of 12 min.
From the first blood sample (extracted before radiotracer injection), two 1-mL samples were separated and introduced into 1.5-mL flasks, and 100 μL of 123I-R91150 reference solution (∼370 kBq/mL, measured with a dose calibrator [Pet Dose; Comecer]) were added to each. The resulting solutions were submitted to the same experimental procedure as described for samples 2–16 (or, eventually, 2–17). Sample 1 was used to determine the retention time of the parent compound under chromatographic conditions and to calculate the relationship between activity concentration in plasma and obtained counts in the γ-counter. All samples were processed within 60 min after blood sampling.
Statistical Analysis
The SAS, version 8.02, system (SAS Institute Inc.) and procedures for Windows (Microsoft) were used for all statistical analyses. In group A, the pseudoequilibrium interval was assessed on the time profile of SUR values. Over the time during which the SUR curves were expected to be at steady state on the basis of visual inspection of the SUR–time curves, a mixed-model regression analysis was fit for each region separately, with time as a continuous covariate and subject as a random effect. The slopes and corresponding 95% confidence intervals were estimated for each brain region. Within-scan variability at pseudoequilibrium was estimated by the regression model and was provided along with between-subject variability over the time at pseudoequilibrium. The relationship between BP (using 1TC, 2TC, and SRTM) and SUR was analyzed by means of Pearson correlations.
RESULTS
123I-R91150 Cerebral Distribution and Brain Kinetics
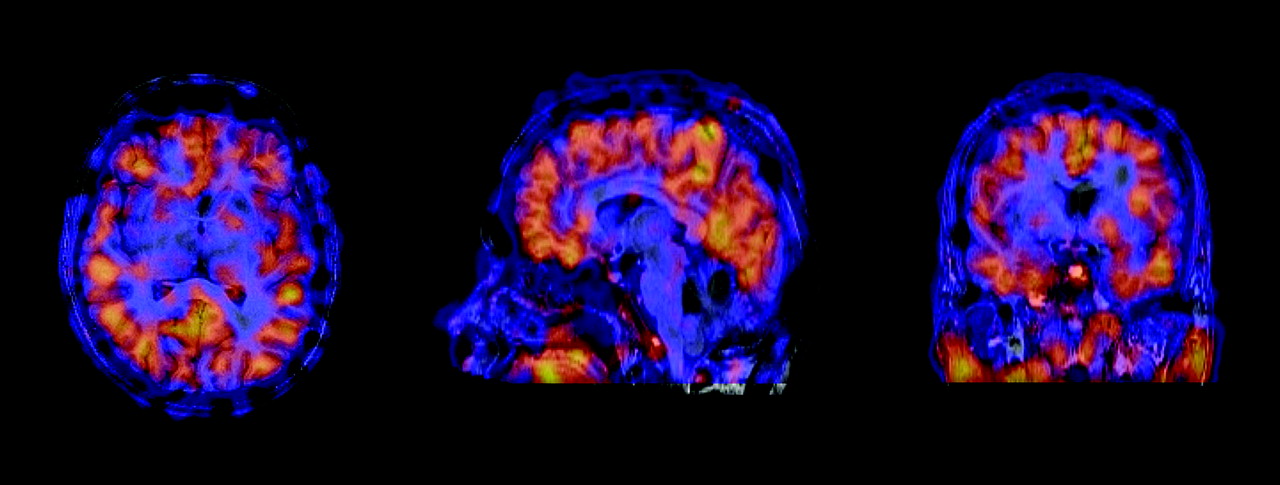
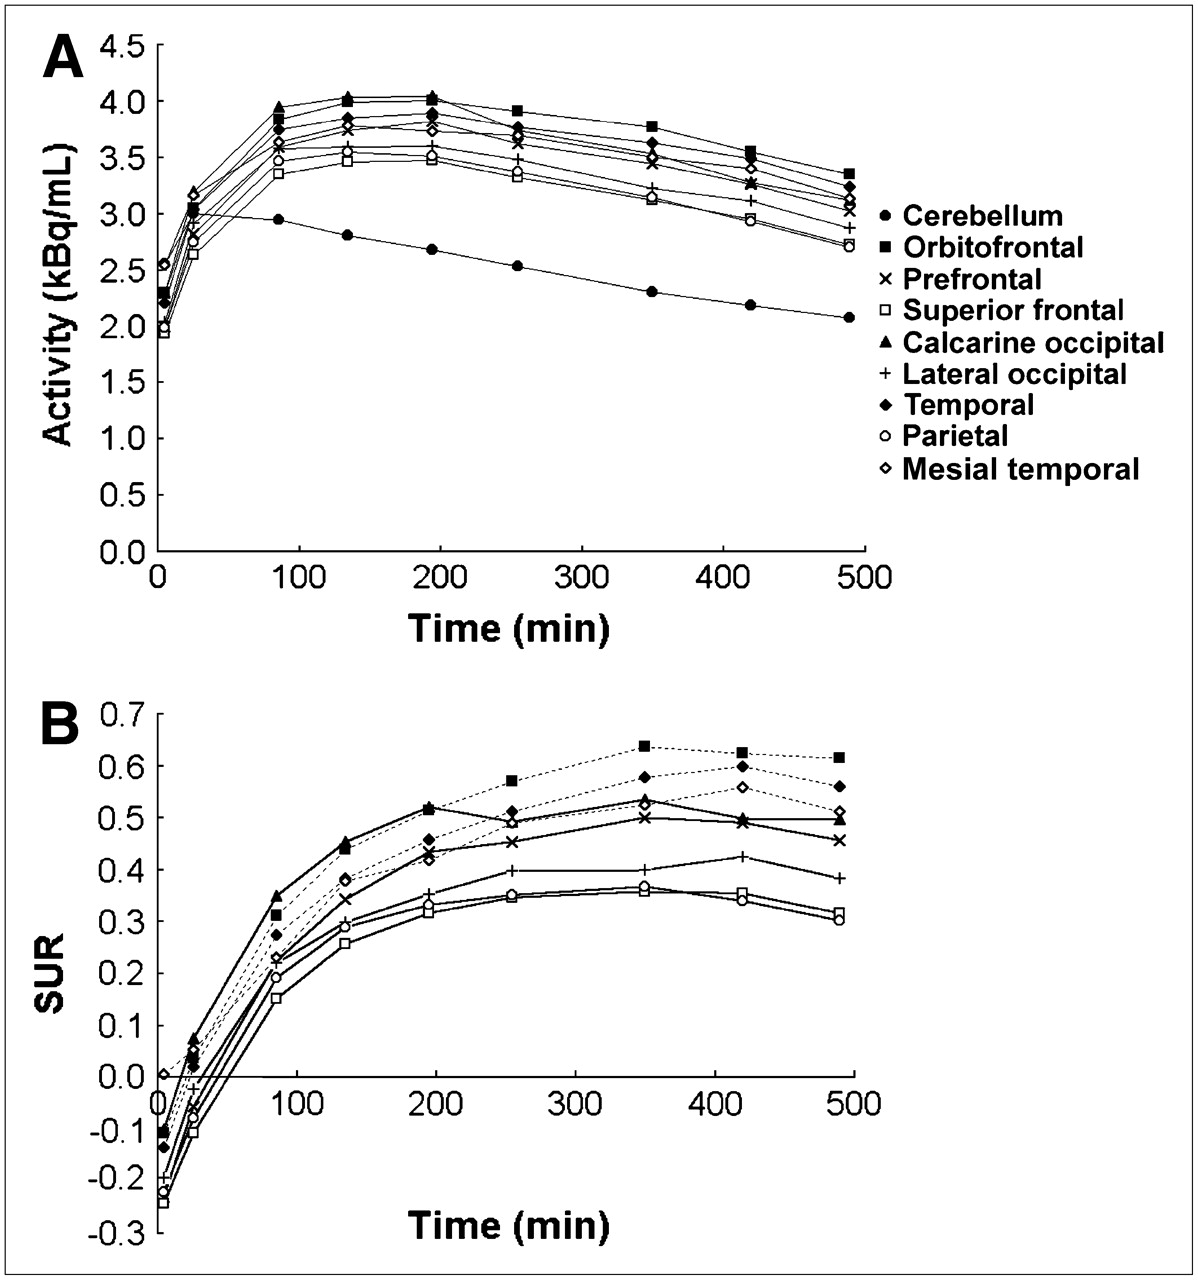
123I-R91150 showed the highest accumulation in cerebral cortex, with low uptake in striatum and thalamus and negligible uptake in cerebellum (Fig. 1). Given the low uptake in basal ganglia, only cortical regions were considered for the graphical representation of results. Mean decay-corrected regional time–activity curves (Fig. 2) showed the cerebellum as the region with the earliest peak (10–40 min after injection) and lowest activity. Cortical regions showed specific binding and peaked later, between 120 and 180 min after injection.

Transverse (left), sagittal (center), and coronal (right) views of coregistered MRI/SPECT images showing cerebral distribution of 123I-R91150 in healthy volunteer. Added SPECT images were obtained from 180 to 270 min after injection. Uptake is predominant in cortex and negligible in cerebellum.

(A) Decay-corrected mean time–activity curves in cerebellum and cortical regions. (B) SUR values over time for all cortical regions studied.
Tracer Kinetic Modeling
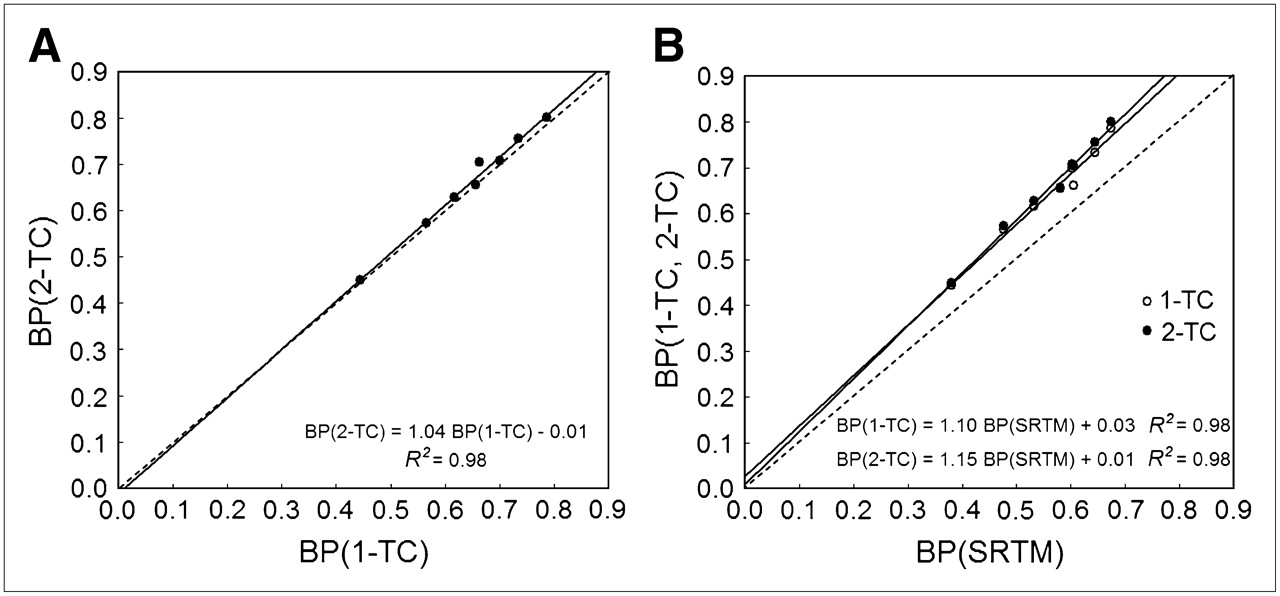
Full kinetic modeling with arterial sampling yielded similar BP values using either 1TC or 2TC, which correlated strongly (BP2TC = 1.04 BP1TC – 0.01, R2 = 0.98) (Fig. 3A). BPSRTM correlated with BP1TC and BP2TC with a small bias (BP1TC = 1.10 BPSRTM + 0.03, R2 = 0.98; BP2TC = 1.15 BPSRTM + 0.01, R2 = 0.98) (Fig. 3B). With all methods, the highest BP from the cortical regions corresponded to the orbitofrontal region (BP1TC = 0.79, BP2TC = 0.80, BPSRTM = 0.67) and the lowest to the parietal region (BP1TC = 0.44, BP2TC = 0.45, BPSRTM = 0.38).

(A) Scatter plot of BP1TC vs. BP2TC. (B) Scatter plot of BPSRTM vs. BP1TC and BP2TC.
TR and Pseudoequilibrium Interval
Plots of mean SUR values over time (group A) for all regions studied are shown in Figure 2. In all regions, uptake progressively increased until 180–240 min after injection and then stabilized until the end of the scanning session. The pseudoequilibrium interval was determined by analyzing the slopes of SUR values over time during the visually identified steady state, that is, from 180 to 470 min after injection and from 240 to 470 min after injection. Slopes and corresponding 95% confidence intervals are reported in Table 1. The 95% confidence interval of the slope of the fitted regression line lacked significance from 180 min after injection until the end of the study in all regions except the orbitofrontal and temporal (lateral and mesial) cortices, which reached steady state at 240 min after injection. In these regions, the SUR values were consistently lower at 180 min after injection (SUR180) than at their pseudoequilibrium time (SUR240). The average differences between SUR180 and SUR240 were 9.5% ± 8.1% for the orbitofrontal region, 14.8% ± 16.4% for the temporal, and 21.1% ± 12.4% for the mesial temporal.
Linear Regression Analysis Slopes and 95% Confidence Intervals for Group A (n = 7) at 180–470 and 240–470 Minutes After Injection
SRTM Versus TR
BPSRTM, mean SUR180, within-scan variability, and between-subject variability are shown in Table 2. Striatum and thalamus showed faint uptake. In the cortex, the highest BP and SUR values corresponded to the orbitofrontal and temporal (lateral and mesial) regions, followed by the calcarine occipital and prefrontal regions. Moderate specific binding was found in the remaining cortical regions (lateral occipital, superior frontal), and the lowest corresponded to the parietal lobe.
Mean (±SD) SUR180 and BPSRTM, Between-Subject Variability, and Within-Scan Variability for Group A (n = 7)
Scatter plots comparing BPSRTM and SUR are shown in Figure 4. The best correlation was found when the mean SUR values of the whole pseudoequilibrium interval for each region (SURmean) were considered—that is, 240–470 min after injection for the orbitofrontal and temporal regions and 180–470 min after injection for all the remaining regions (BPSRTM = 0.99 SURmean + 0.01, r = 0.98) (Fig. 4A). Good correlations were also found when a single SUR value at pseudoequilibrium for each region was used—that is, SUR240 for the orbitofrontal and temporal regions and SUR180 for all remaining regions (BPSRTM = 0.85 SUR180/240 + 0.09, r = 0.88) (Fig. 4B). Finally, SUR180 was considered for all regions (BPSRTM = 0.89 SUR180 + 0.09, r = 0.79). In that case, the orbitofrontal and temporal regions showed the most underestimated SUR values with respect to the BPSRTM values (Fig. 4C).
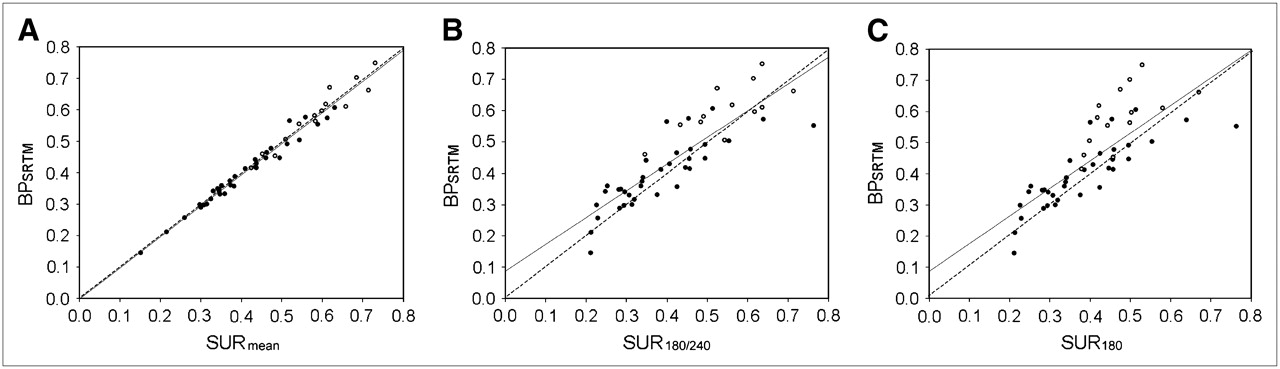
Scatter plots comparing BPSRTM and SUR in orbitofrontal and temporal regions (○) and remaining cortical regions (•). (A) In this plot, mean SUR values of entire pseudoequilibrium interval (SURmean) were considered (i.e., from 240 to 470 min after injection for orbitofrontal and temporal regions and from 180 to 470 min after injection for all remaining regions). (B) In this plot, single SUR value at pseudoequilibrium for each region was considered (i.e., SUR240 for orbitofrontal and temporal regions and SUR180 for all remaining regions). (C) In this plot, SUR180 was considered for all regions.
The within-scan variability of the SUR values obtained throughout the entire pseudoequilibrium interval (180–470 min after injection, group A) ranged from 10% to 14.8% across all cortical regions (Table 2). The prefrontal and lateral temporal cortices showed the lowest within-scan variability, and the superior frontal and parietal showed the highest. Between-subject variability over the pseudoequilibrium period ranged from 18.3% to 35.4% in the cortex. The temporal cortex (both lateral and mesial) was the least variable area (18.3%–18.9%), and the superior frontal was the most variable (35%) (Table 2). The basal ganglia showed high variability, both within scans (>33%) and between subjects (>40%).
Plasma Analysis
Average total activity and unmetabolized parent-compound activity in plasma curves obtained from venous samples of the 9 subjects plateaued after a rapid distribution phase (Figs. 5A and 5B). Figures 5C and 5D show the fraction of the activity corresponding to unmetabolized parent compound in plasma (arterial and venous blood) as a function of time for the subject who provided arterial blood samples. Activity peaks were found at 0.8 and 2 min for arterial and venous curves, respectively. The maximum activity reached in the venous blood curve was around 12 times lower than that reached in the arterial blood curve. Both curves were almost identical 10 min after injection.
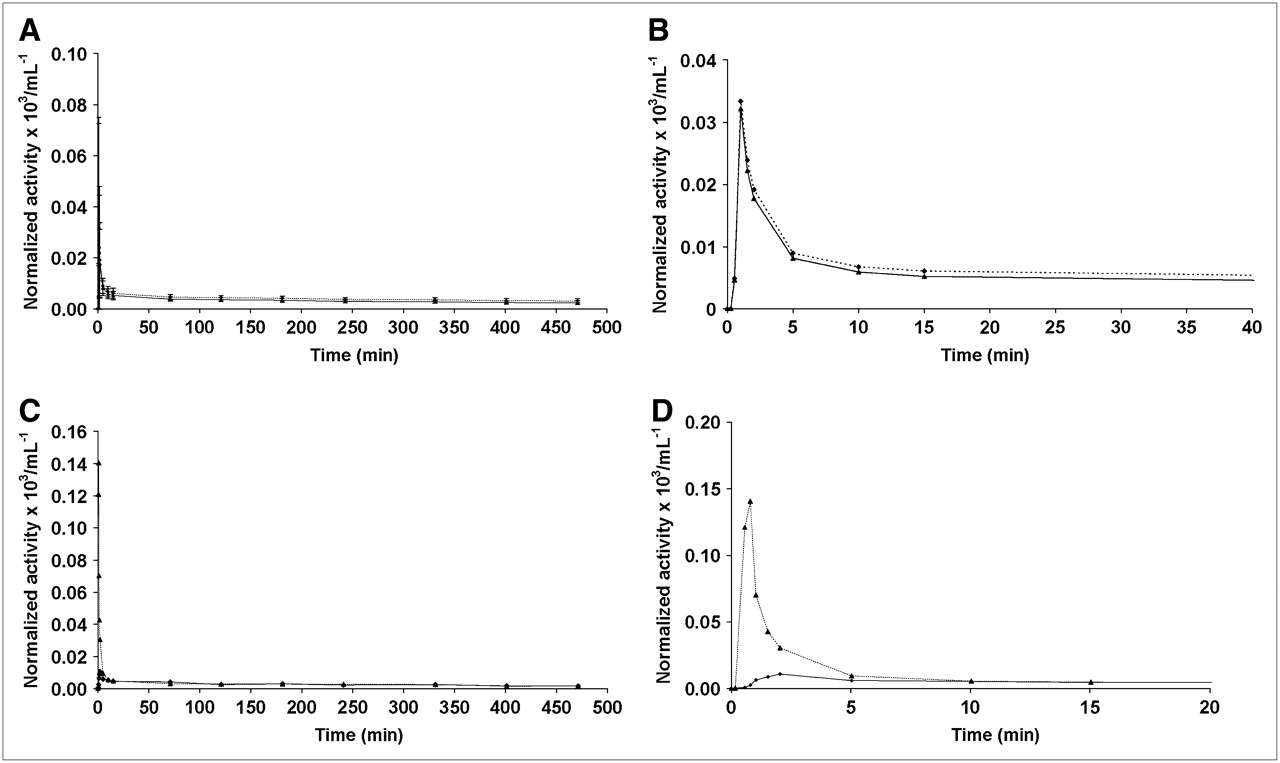
(A and B) Averages obtained from data of 9 subjects in group A. Total plasma activity (dotted line) and activity corresponding to unmetabolized parent compound (solid line) in plasma are shown as function of time for entire study (A) and for first 40 min after injection (B). (C and D) Data of subject who provided arterial blood samples. Activity corresponding to unmetabolized parent compound in plasma is shown as function of time for venous (solid line) and arterial (dotted line) blood samples for entire study (C) and for first 20 min after injection (D). All values are decay corrected to injection time and normalized with injected activity.
The percentage of unmetabolized parent compound over time is presented in Figure 6A (average values for venous blood samples, n = 9). Ten minutes after injection, the fraction of activity corresponding to unmetabolized parent compound in plasma dropped from the initial value of 97% ± 2% to 88% ± 3%. Afterward, a slow decrease was observed until its final level (76% ± 8%) was reached. The chromatograms obtained for samples drawn from 1 subject at −1, 2, and 240 min after injection of the radiotracer are depicted in Figure 6B. Only 1 species more hydrophilic than the parent compound (lower retention time) could be detected in all chromatograms. Comparison of the chromatograms evidenced that the relative size of the peak with a retention time of approximately 1.5 min increased with time, whereas the peak with a retention time of approximately 6 min (corresponding to unmetabolized parent compound) decreased with time, reaching a relative size of 76% ± 8% of total activity in the plasma fraction at 470 min after injection. Although there is no experimental evidence of the structure of the radioactive species, coinjection with free 123I-iodine showed the same retention time as for the first peak (∼1.5).

(A) Percentage of unmetabolized parent compound in plasma as function of time. (B) Chromatograms obtained for samples extracted at −1, 2, and 240 min after injection.
The fraction of activity in plasma over time (referred to as total blood activity) is shown in Figure 7 (average values for venous blood samples, n = 9). The fraction of activity in plasma decreased quickly (<15 min), reaching a plateau of around 80% at 15 min after injection.

Fraction of activity in plasma vs. time, referred to as total blood activity.
DISCUSSION
123I-R91150 Cerebral Distribution and Brain Kinetics
Serotonin receptors are broadly distributed in the brain. Using human brain autoradiography, the highest densities of 5-HT2 receptors have been reported in the cerebral cortex and the lowest in the thalamus, striatum, and cerebellum (16). These findings agree with the predominantly cortical distribution and corresponding 123I-R91150 BP and SUR values shown in the present study.
The brain kinetics of 123I-R91150 were previously described in 2 subjects (17). In that study, the cerebellum was found to peak at 5 min after injection and the frontal cortex at 100–120 min after injection. The present study showed slightly slower kinetics. Although the acquisition times in the present study did not allow accurate identification of the time at peak for these regions, the cerebellum was shown to peak between 10 and 40 min after injection and cortical regions between 120 and 180 min after injection (Fig. 2). The larger sample size in the present study may account for such a difference in timing of the peaks.
Tracer Kinetic Modeling and TR
The TR method, because it does not require either blood sampling or long scanning sessions over time, is desirable but may lead to a biased estimation of BP. The present study compared tracer kinetic compartmental analyses based on dynamic time-course data and an arterial plasma input function with TR to validate the specific binding measurements obtained using the simplest methodology.
An excellent correlation was found between BP1TC and BP2TC, thus validating and supporting the use of SRTM for quantification of 123I-R91150 SPECT. BPSRTM was shown to be approximately 10% lower than BP1TC and approximately 15% lower than BP2TC (Fig. 3). Furthermore, BPSRTM values also correlated with SUR values. Although the best correlation was found when the whole pseudoequilibrium interval was used for SUR calculations, a good correlation was still found when a single SUR value at pseudoequilibrium was used (Fig. 4). This finding suggests that TR can be applied for quantification of 5-HT2A receptor binding using 123I-R91150 SPECT with a simple protocol avoiding arterial blood sampling and serial scanning over time.
In this study, the cerebellum was used as a reference region for both SRTM and SUR quantification. The cerebellum is virtually free of 5-HT2 receptors (18) and has consistently been chosen as a reference region for SUR calculations (1–6,19,20). The appropriateness of the cerebellum as a reference region was previously supported by the lack of 123I-R91150 displacement induced by ketanserin in the cerebellum in a preliminary study (21,22), as well as in our own experience (11). The excellent correlation found between BP values calculated with full kinetic modeling (1TC and 2TC) and SRTM in the present study also supports the suitability of the cerebellum as a reference region for 123I-R91150 SPECT quantification.
Pseudoequilibrium Interval for TR
Despite the importance of accurate identification of the pseudoequilibrium interval for SUR calculations after a single radioligand injection, to the best of our knowledge 123I-R91150 SUR values over time have been reported for a total of only 3 healthy volunteers from 2 different groups. Busatto et al. (17) scanned 2 healthy volunteers over time, one up to 880 min after injection and another up to 200 min after injection. These subjects showed stable frontal–cerebellar activity ratios from 100 min after injection. Audenaert et al. (2) reported the presence of a frontal–cerebellar ratio curve up to 168 min after injection in an additional healthy volunteer and proposed 110–140 min after injection as the appropriate scanning time. Besides the limitations arising from the small sample sizes, assessment of the pseudoequilibrium interval was limited by being performed visually from the time–activity curves in both cases. Therefore, further evaluation was needed. Data from the present study for 7 healthy volunteers scanned up to 470 min after injection showed that in most cortical regions, SUR values progressively increased until 180 min after injection and then remained stable through the end of the scanning session. This stability was confirmed by linear regression analysis showing that for most cortical regions, the slope within this interval did not significantly differ from 0. We therefore suggest that 180 min after injection be selected as the earliest time for 123I-R91150 SPECT acquisition after a single radioligand injection. Identification of the earliest time at which the radioligand reaches pseudoequilibrium is important because minimizing the length of the exploration improves patient compliance and economics in the clinical setting. When measurements in the orbitofrontal and temporal regions are of particular interest, an approximately 10%–20% underestimation in the SUR180 should be considered. Although stable SUR values were maintained up to 470 min after injection in all regions, late frames are not recommended for quantification given the lower counting rate due to isotope decay.
Normal Database of SUR180 and Variability of Measurements
The present study showed the highest SUR180 to be in the orbitofrontal and temporal regions, followed by the remaining cortical regions from occipital calcarine to parietal in descending order (Table 2). The basal ganglia showed the lowest SUR180 and the highest variability. A summary of previously reported mean cortical SUR values in healthy volunteers by other groups is presented in Table 3. Busatto et al. (17) and Travis et al. (7), both from the same group in London, reported values from 0.40 to 0.44 in different cortical regions when scanning at 250 min after injection (17) and lower values (0.30–0.38) when scanning at 120 min (7). Audenaert et al. (2,19), van Heeringen et al. (1), and Versjipt et al. (3), from the same group in Ghent, performed a 40-min scan starting between 110 and 140 min after injection and reported higher values overall, ranging from 0.52 to 1.03 depending on the cerebral region and the study (Table 3). Finally, Reneman et al. (5,20) and Baeken et al. (24), using different acquisition protocols but starting the acquisition at the same time (120 min) after injection, found intermediate SUR values, ranging from 0.74 (20) to 0.87 (24). Differences in methodology can account for the variation among reported SUR values. The time of scanning is an important factor. The SUR–time curves obtained in the present study showed that SUR values were underestimated when calculated before the pseudoequilibrium interval had been reached (Fig. 2). Other factors include scanner resolution and sensitivity, reconstruction parameters, and the ROI method used (e.g., MRI–SPECT coregistration vs. the drawing of ROIs directly on SPECT images), including ROI size and location. Most authors have used a single ROI for each cerebral lobe. In the present study, several regions within the frontal, temporal, and occipital lobes were independently quantified on the basis of the differences, found on autoradiography, in 5-HT2 receptor densities in different regions of the same lobe. The differences in 123I-R91150 specific binding among the frontal and occipital subregions, with substantially higher SUR values in the orbitofrontal and calcarine regions, respectively, were consistent with the autoradiography findings (16). In the only published study with 123I-R91150 in which subregions were independently analyzed, the orbitofrontal region also showed the highest SUR within the frontal lobe (3). The orbitofrontal cortex presents the highest SUR among all cerebral regions and reaches pseudoequilibrium later than do the remaining frontal regions studied. The fact that regions with higher receptor density may reach later equilibrium has been reported (25,26). These particularities of different parts of the same cerebral lobe should be considered in 123I-R91150 quantification.
Reference 123I-R91150 SUR Values Reported in the Literature
The potential influence of age, sex, and interhemispheric asymmetry on the final quantification deserves mention. Previous studies of 123I-R91150 in humans showed a decrement of ±1.1% per year (24) and 11.6% per decade (3). The SUR values found in the present study came from 17 subjects in their twenties; therefore, age was not expected to influence the mean SUR values. However, this possibility has to be considered when one is interpreting mean SUR values reported in the literature (Table 3), because some studies have included patients ranging widely in age. Further experience is needed to determine the pseudoequilibrium interval in aged populations, because pseudoequilibrium might be achieved earlier in aged subjects with a low 5-HT2A receptor density than in young subjects. However, given the long pseudoequilibrium interval shown in this study for 123I-R91150, image acquisitions starting at 180–240 min after injection would most likely be within the pseudoequilibrium interval in aged populations as well. Given the reported evidence of lack of differences in 123I-R91150 uptake according to sex, and to avoid radiation exposure in young women, we excluded women from this study (3,24). Finally, because previous studies did not find any significant differences in 123I-R91150 uptake between the left and right hemispheres, averaged values from both hemispheres were used in this study.
The within-scan variability in SUR measurements obtained at different times throughout the pseudoequilibrium interval was acceptable, ranging from 10% to 15%. This variability was in line with the 10%–17% test–retest variability reported using different radioligands for neurotransmission SPECT (26–31). As expected, between-subject variability was higher, ranging from 15% to 35%, therefore suggesting that a within-subject SPECT design be planned whenever possible. The highest within-scan and between-subject variability was found in the superior frontal region, whereas the lowest was in the temporal lobe. These data could be of interest for selecting cortical regions for quantification in particular studies.
Plasma Analysis
No studies of 123I-R91150 stability in plasma or of 123I-R91150 metabolite analysis have been reported. Thus, all samples were processed as soon as possible after blood sampling, and always within 60 min after extraction. Peremans et al. (32) obtained venous blood samples from a dog at different times after 123I-R91150 administration but did not further analyze the samples, calculating only total radioactivity in blood as a function of time. A sharp decrease in radioactivity was found 3 min after injection. At 20 min, a decrease in radioactivity to 2% of the injected dose was noted, and a stable plateau was reached from 20–40 min onward. This finding is consistent with our finding of a sharp decrease in radioactivity after a short time. However, in our case, this decrease occurred 1 min after injection but the plateau occurred 15 min after injection.
Busatto et al. (17) reported total radioactivity in blood over time, relative distribution between plasma and cell compartments, and the protein-bound fraction in plasma in humans. A sharp decrease in radioactivity was noted during the first 20–30 min after injection, after which radioactivity reached a stable plateau. In the present study, the plateau was reached after 15 min after injection (Figs. 4A and 4B). In addition, Busatto (17) et al. reported that more than 90% of the activity was in the plasma after 30 min after injection, and 62% of the activity bound to proteins after 150 min after injection. Our results showed that the percentage of activity in plasma reached a plateau at 80% (Fig. 6), whereas the fraction of activity linked to protein could not be determined because protein fraction is removed by precipitation of protein with acetonitrile, leading to denaturalization of the protein and thus modifying the binding fraction.
CONCLUSION
123I-R91150 is a useful ligand for SPECT assessment of the 5-HT2A receptor in humans. Cerebral distribution, BP, and SUR180 values obtained by this method in healthy volunteers agree with autoradiography results, showing the highest specific binding in cortical regions and low specific binding in subcortical gray matter. BP measured using the full kinetic compartmental model with arterial sampling correlated strongly with BP measured by SRTM and with SUR values measured by TR. These findings suggest that TR can be used for 123I-R91150 SPECT quantification of 5-HT2A receptor binding with a simple protocol avoiding arterial blood sampling and serial scanning over time.
Acknowledgments
The authors thank Roger N. Gunn, Javier Pavia, Michael Travis, and Emilio Merlo-Pich for meaningful discussions; Eugenii Rabiner, Magi Farre, Fernando Escolano, and Clare Burgess for useful contributions to the design and execution of the protocol; Nuria Merino and Vanessa Gómez for excellent technical assistance; and all the volunteers who participated in the study. This study was supported by the Psychiatry Centre of Excellence for Drug Discovery, Clinical Pharmacology Discovery Medicine/Experimental Medical Sciences, GlaxoSmithKline.
References
- Received for publication December 23, 2005.
- Accepted for publication March 1, 2006.


