


Abstract
As part of the radioiodinated 4-amino-N-1-[3-(4-fluorophenoxy)propyl]-4-methyl-4-piperidinyl]5-iodo-2-methoxybenzamide (123I-R91150) characterization study, ketanserin challenges were performed on healthy volunteers with the aim of assessing the specificity of 123I-R91150 binding to subtype 2A of the 5-hydroxytryptamine receptor (5-HT2A), the sensitivity of 123I-R91150 SPECT in measuring ligand displacement, the relationship between ketanserin plasma concentrations and 123I-R91150 displacement, and the suitability of the cerebellum as a reference region for quantification. Methods: Dynamic SPECT was performed on 6 healthy men (mean age ± SD, 21 ± 0.89 y) from the time of 123I-R91150 injection until 470 min afterward. Ketanserin was administered intravenously at 210 min after injection at 3 doses: 0.1 mg/kg (n = 2), 0.05 mg/kg (n = 2), and 0.015 mg/kg (n = 2). Blood samples for measurement of ketanserin plasma concentrations were drawn. MRI was performed on all subjects and coregistered to the SPECT data for region-of-interest drawing on cortical regions and cerebellum. The simplified reference tissue model (SRTM) was considered the gold standard for quantification, and results were compared with those obtained with the tissue ratio method (TR). The percentage 123I-R91150 displacement was calculated with both methods as the percentage difference between baseline and postketanserin scans. Results: Depending on the cerebral regions with the maximum ketanserin dose studied, SRTM and TR mean displacements were 57.1%–95.4% and 71.9%–101.2%, respectively, for the 0.1 mg/kg dose; 51.7%–91.4% and 56.7%–102.8%, respectively, for the 0.05 mg/kg dose; and 7.7%–54.5% and 13.8%–47.0%, respectively, for the lowest dose, 0.015 mg/kg. A good correlation was found between the 2 methods. No ketanserin-induced displacement was observed in the cerebellum time–activity curves, supporting the use of the cerebellum as a reference region. The relationship between displacement and ketanserin plasma concentration fit with a rectangular hyperbola, with a 5.6 ng/mL concentration associated with 50% of the maximum displacement (EC50). EC50 values calculated using occupancies derived both with SRTM and with TR were in good agreement. Conclusion: 123I-R91150 SPECT is sensitive enough to measure ketanserin dose-dependent displacement in cerebral regions rich in 5-HT2A receptors. These results support the selectivity of 123I-R91150 for 5-HT2A receptors and its use as a SPECT ligand for measurements of drug-induced 5-HT2A receptor occupancy in humans.
Brain kinetics, plasma behavior, and the accuracy of quantification methods have been reported in healthy volunteers for subtype 2A of the 5-hydroxytryptamine receptor (5-HT2A) SPECT ligand radioiodinated 4-amino-N-1-[3-(4-fluorophenoxy)propyl]-4-methyl-4-piperidinyl]5-iodo-2-methoxybenzamide (123I-R91150) (1). The specificity of 123I-R91150 binding to the 5-HT2A receptor site has previously been suggested by preclinical displacement studies. 123I-R91150 displacement induced by the potent 5-HT2A antagonist ketanserin has been reported in both dogs (2) and baboons (3), with lack of effect of the selective dopamine D2 receptor antagonist raclopride in the latter (3). However, experience with the effects of ketanserin on 123I-R91150 binding in humans is limited. Preliminary results showed full 123I-R91150 displacement in cortical brain regions, with no effect on cerebellar uptake in 3 healthy volunteers at a ketanserin dose of 0.1 mg/kg (4), which was previously found to be a saturating dose in primates (5).
The present study was part of the 123I-R91150 characterization study (1). Ketanserin challenges at different doses in healthy volunteers were used to assess the specificity of 123I-R91150 binding to 5-HT2A receptors, the sensitivity of the 123I-R91150 SPECT technique in measuring ligand displacement, the relationship between ketanserin plasma concentrations and 123I-R91150 displacement, and the suitability of the cerebellum as a reference region for quantification.
MATERIALS AND METHODS
Subjects
Six men (mean age ± SD, 21 ± 0.89 y; range, 20–22 y) determined through the Structured Clinical Interview for DSM-IV to be healthy were enrolled in this study. None had a history of psychiatric treatment or significant medical events. None was taking psychotropic drugs or other relevant medication. Absence of illegal drug abuse was assessed by questioning and supported by urine drug screening (InstaCheck Drug Screen Test; Applied Biotech/Forefront Diagnostics). Subjects had to withdraw from caffeine and alcohol 24 h before the study day and were not allowed to take any drugs during the 7 d before the study day. All had normal findings on physical examination, 12-lead electrocardiography, clinical chemistry, and hematology. The study was approved by the local Ethics Committees and the Spanish Ministry of Health, and written informed consent was obtained from all subjects before inclusion in the study.
Synthesis of 123I-R91150
The synthesis of 123I-R91150 was previously described (1,6). Briefly: 4-amino-N-[1-[3-(4-fluorophenoxy)propyl]-4-methyl-4-piperidinyl]-2-methoxybenzamide (40 μg) was dissolved in glacial acetic acid (300 μL). The addition of Na123I (370–740 MBq) and H2O2 (30% solution, 100 μL in 4 steps, 25 μL each) yielded 123I-R91150. The reaction was stopped with 0.5 mL of a 0.5 mol/L solution of sodium sulfite in a 4.5 mol/L solution of NaOH, and the mixture was purified by high-performance liquid chromatography. The collected 123I-R91150 fraction was further diluted with an isotonic citrate/acetate buffer (end pH, 6.0–6.4), filtered through a Millex-FG filter (Millipore), stabilized with a trace of o-iodo-hippuric acid (1 mg/mL of diluent), and autoclaved. The specific activity of the autoclaved 123I-R91150 was approximately 300 TBq/mmol. Radiochemical purity at the time of administration (i.e., 24 h after synthesis) was higher than 96%.
Subject Preparation and SPECT Procedure
SPECT was performed using a 3-head Prism 3000S camera (Philips) fitted with ultra-high-resolution fanbeam collimators. The preparation of each subject included administration of potassium perchlorate (8 mg/kg) up to 20 min before the 123I-R91150 injection to minimize exposure of the thyroid gland to radiation. Four multimodality SPECT/MRI markers (MM3003; IZI Medical Products Corp.), each filled with approximately 0.074 MBq of 123I, were firmly attached to the subject's head at the level of the mastoids and the corners of the eyes. A dynamic scan sequence of one 10-min, four 30-min, three 10-min, and three 40-min frames was acquired starting at 0, 11, 71, 120, 180, 210, 220, 230, 330, 400, and 470 min after injection. Ketanserin was administered at 210 min after injection in a slow intravenous injection (over 30 s) at 3 different doses—0.1, 0.05, and 0.015 mg/kg—each administered to a different subgroup of 2 subjects. The subjects were allowed to rest outside the SPECT camera during breaks between scans until the time of the ketanserin injection; then, for safety reasons, the subjects rested lying on the SPECT bed with continuous monitoring of electrocardiography, blood pressure, and heart rate until the end of the scanning session.
Ketanserin Analysis
Blood samples for analysis of ketanserin levels were drawn at 180, 230, 270, 330, 400, and 470 min after the 123I-R91150 injection and were centrifuged for 10 min at 3,000 rpm and 25°C to separate the plasma. Plasma samples were analyzed for ketanserin using a validated analytic method based on protein precipitation, followed by high-performance liquid chromatography–mass spectrometry/mass spectrometry analysis. The limit of detection for ketanserin was 1 ng/mL, using a 300-μL aliquot of human plasma with a higher limit of quantification, 100 ng/mL. Quality control samples, prepared at 3 different analyte concentrations and stored with the study samples, were analyzed with each batch of samples against separately prepared calibration standards. For the analysis to be acceptable, no more than one third of the quality control results were to deviate from the nominal concentration by more than 15%, and at least 50% of the results from each quality control concentration were within 15% of nominal.
123I-R91150 Plasma Analysis
A total of 17 venous blood samples were collected manually from all subjects, at −1 (baseline), 0.25, 0.5, 1, 1.5, 2, 5, 10, 15, 71, 120, 180, 230, 270, 330, 400, and 470 min after injection. Plasma analysis of 123I-R91150 was previously described. Briefly: Samples 2–17 were centrifuged at 2,000g for 4 min, and plasma and residue fractions were counted in a γ-counter. For determination of the metabolite profile, 1 mL of pure acetonitrile was added to the plasma fraction, and after centrifugation (2,000g, 4 min), the supernatant was separated and evaporated at 40°C under a continuous flow of helium, and the residue was diluted in 100 μL of mobile phase and injected into the high-performance liquid chromatography system. To the first blood sample (extracted before radiotracer injection), 100 μL of 123I-R91150 reference solution (∼370 kBq/mL) were added, and the resulting solution underwent the same experimental procedure as described for samples 2–17. All samples were processed within 60 min after they had been collected.
Image Processing
Images were reconstructed using a filtered-backprojection algorithm with a Butterworth filter (exponent, 5.0; cutoff frequency, 0.4 cycle/pixel). Pixel sizes were between 2.45 and 2.51 mm on each slice and 3.56 mm in the axial direction. Attenuation correction was performed using the Chang algorithm and a manually fitted elliptic attenuation map on each slice (μ = 0.1 cm−1). SPECT and MRI scans were registered using in-house software implemented in C language. First, the corresponding external markers were manually identified on the MRI and SPECT scans. Then, rigid-body transformation (3 translations and 3 rotations) was estimated automatically by minimizing the sum of the squared distances between the corresponding marker positions (7).
Regions of interest (ROIs) were drawn manually and individually by the same investigator on the MR images of each subject. To control for ROI volumes across subjects, care was taken that approximately the same number of MRI slices was used in drawing the ROIs for each region across subjects. Moreover, anatomic landmarks were defined a priori in order to standardize the first (lower) and last (upper) brain slice within which each ROI was drawn. ROIs were drawn in the frontal, temporal, occipital, and parietal lobes and the cerebellum. The frontal lobe was divided into orbitofrontal, prefrontal, and superior frontal regions, and the occipital lobe was divided into calcarine and lateral regions.
Quantification of 123I-R91150 Displacement
The simplified reference tissue model (SRTM) (8) and the tissue ratio method (TR) were applied for quantification. SRTM was used as the gold standard for quantification, and the cerebellum time–activity curve was used to provide the input function to the kinetic model. A changing binding potential (BP) value at the moment of ketanserin injection was included in the model to fit the SRTM to both parts of the curve, that is, before and after ketanserin. BP before ketanserin (BPpre) and after ketanserin (BPpost) were the SRTM outcome measurements. Radioligand displacement measured using SRTM was compared with the displacement calculated using TR at pseudoequilibrium. For the TR, specific uptake ratios (SUR) were calculated as ([Creg − Ccer]/Ccer), where Creg and Ccer were the mean counts in the studied cortical region and in the cerebellum, respectively. For displacement measures, SUR values from 2 scans were used: the baseline scan frame at 180 min after injection (SUR180) and the scan frame starting at 400 min after injection, that is, 190 min after ketanserin administration (SUR400). This allowed pseudoequilibrium to be achieved again after ketanserin administration. Displacement was then calculated as the percentage change between the BP or SUR values before and after ketanserin: %DisplSRTM = 100 × (BPpre − BPpost)/BPpre, and %DisplTR = 100 × (SUR180 − SUR400)/SUR180.
The relationship between ketanserin plasma concentration and 123I-R91150 displacement in the different ROIs was modeled according to the Hill equation: where percentage displacement is 5-HT2A receptor displacement (i.e., 123I-R91150 displacement), Displmax is the theoretic maximum displacement for the particular ROI, Cp is the ketanserin plasma concentration (and is used as a functional surrogate of the ketanserin concentration at the synaptic level), γ is the slope factor, and EC50 is the concentration associated with 50% of the maximum displacement (a measure of drug potency in blocking 5-HT2A receptors). Because, in this study, we aimed at characterizing ketanserin displacement of our 5-HT2A receptor ligand, we decided neither to fix the slope factor to 1 (i.e., to assume that ketanserin interacts with a single 5-HT2A binding site in the brain) nor to fix Displmax to 100% (i.e., to assume that 123I-R91150 can be completely displaced by ketanserin). Nonlinear mixed-effect modeling was used as implemented in NONMEM (version 5; GloboMax). Because the scan obtained 400 min after injection was applied for displacement calculations using TR, the ketanserin plasma concentrations at 400 min were used to build up the relationship between displacement and plasma concentration for this method.
RESULTS
Safety
Safety data recorded at the beginning and end of the scanning session, including heart rate, blood pressure, and QTc intervals, showed that these parameters remained within reference ranges during the entire scanning period. At baseline, the ranges were 100–133 (systolic)/54–69 (diastolic) mm Hg for blood pressure, 371–416 ms for QTc, and 55–96 bpm for heart rate. At the end of the experiment, the respective ranges were 99–140 (systolic)/51–65 (diastolic) mm Hg, 378–422 ms, and 52–80 bpm.
123I-R91150 Plasma Analysis
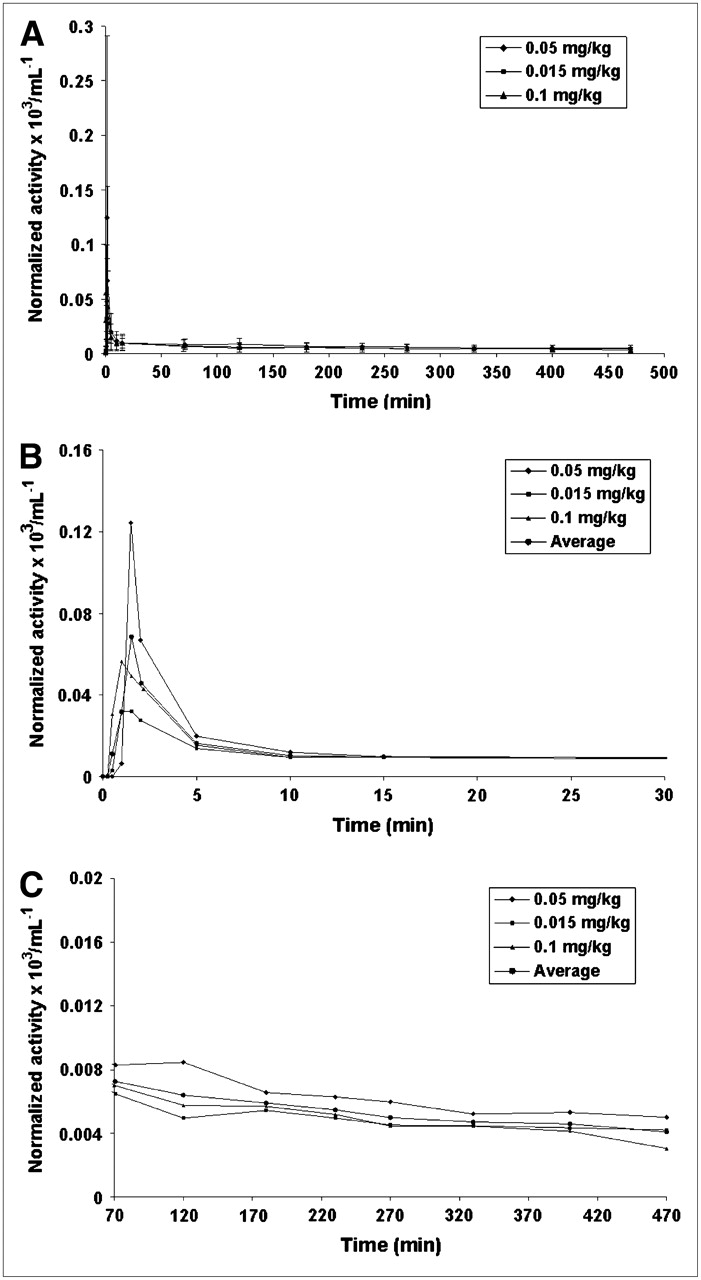
The average activities of unmetabolized parent compound in plasma from venous samples at each ketanserin dose are presented in Figures 1A (entire study), 1B (0–30 min), and 1C (70–470 min). Figures 1B and 1C also present the average values for the 6 subjects. As can be seen in Figure 1B, the 3 curves reached a plateau after a rapid distribution phase. Activity peaked at 1.5, 1, and 1 min after injection of 0.05, 0.015, and 0.1 mg, respectively, of ketanserin per kilogram. The maximum normalized activities were 0.123, 0.032, and 0.056 × 10³ mL−1, respectively.

Average values for activity corresponding to unmetabolized parent compound in plasma as function of time for 0.05, 0.015, and 0.1 mg of ketanserin per kilogram for entire study (A), first 30 min after injection (B), and 70–470 min after injection (C). All values are decay corrected to injection time and normalized with injected activity. Values in A include SD.
Attention to the percentage of unmetabolized parent compound in plasma over time at each of the tested ketanserin doses revealed that this fraction dropped from initial values of 96% ± 2%, 95% ± 3%, and 94% ± 3% to final values of 71% ± 5%, 81% ± 10%, and 69% ± 3% for 0.05, 0.015, and 0.1 mg, respectively, of ketanserin per kilogram. As previously found (1), only one species more hydrophilic than the parent compound (lower retention time) could be detected in all chromatograms. Coinjection of the samples with free 123I-iodine showed the same retention time as for the first peak (∼1.5 min).
The fraction of activity in plasma over time (referred to as total blood activity, average value for 2 venous blood samples) showed a quick decrease (<10 min), reaching a plateau of around 80% at 15 min after injection for all ketanserin doses.
Ketanserin-Induced Displacement of 123I-R91150
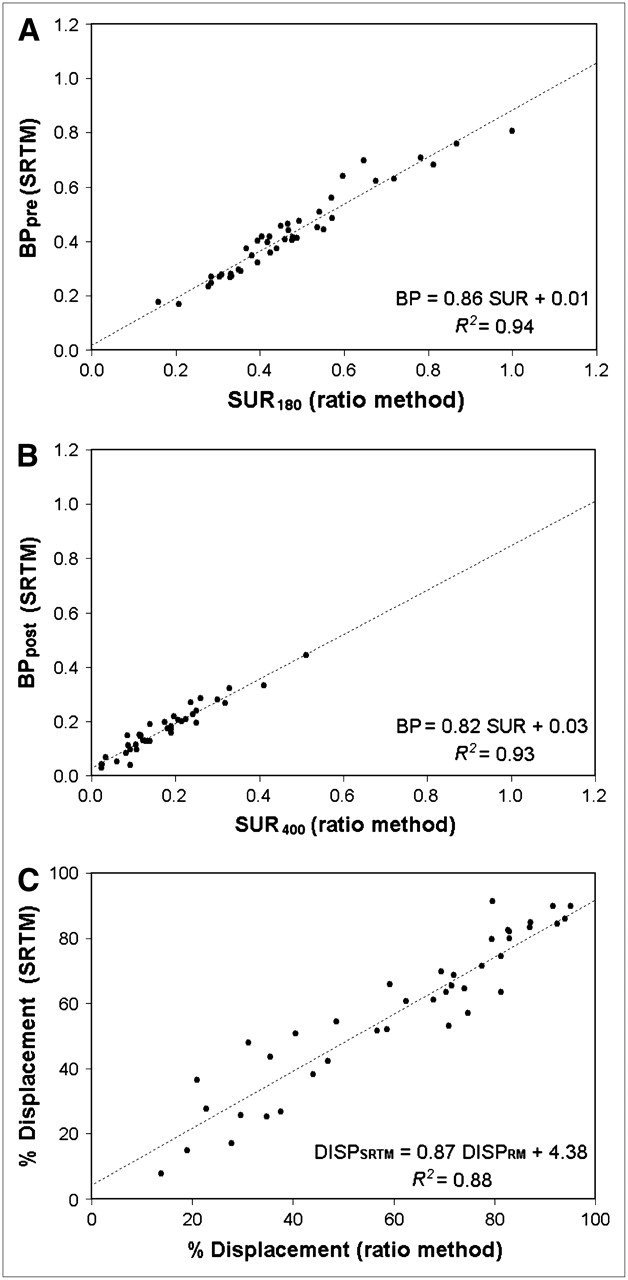
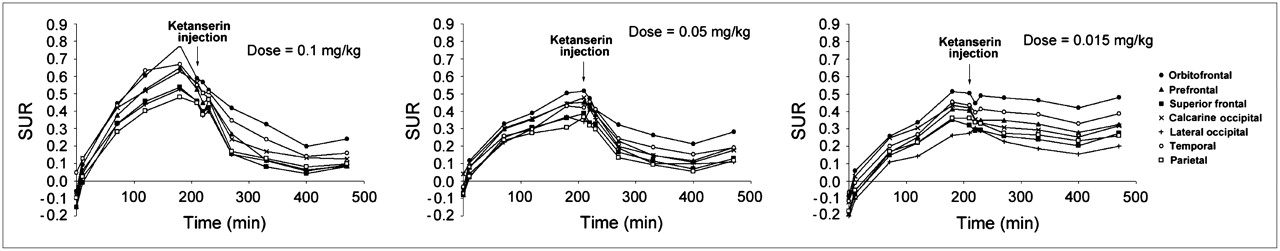
Table 1 shows the individual BP and SUR values used for displacement calculations, as well as the percentage displacement calculated using SRTM (%DisplSRTM) and TR (%DisplTR) for each cerebral region at each ketanserin dose studied. SRTM and TR results correlated well, with R2 values of 0.94 (BPpre vs. SUR180), 0.93 (BPpost vs. SUR400), and 0.88 (%DisplSRTM vs. %DisplTR) (Fig. 2). Depending on the cerebral regions with the maximum ketanserin dose studied, SRTM/TR mean displacement ranges were 57.1%–95.4%/71.9%–101.2% for the 0.1 mg/kg dose, 51.7%–91.4%/56.7%–102.8% for the 0.05 mg/kg dose, and 7.7%–54.5%/13.8%–47.0% for the lowest dose, 0.015 mg/kg. The gradual dose-dependent displacement was also seen in all cortical regions (Fig. 3). Independently of the dose or degree of displacement, the behavior of each cerebral region was the same. The highest displacements were measured in the superior frontal, prefrontal, and lateral occipital regions, and the lowest displacements were measured in the orbitofrontal region. The effects of ketanserin on the time course of SUR values are shown in Figure 4. All subjects showed increasing cortical uptake up to the first pseudoequilibrium time point (180 min after injection), as reported previously (1). In all cases, 123I-R91150 cortical uptake immediately decreased after ketanserin injection at 210 min, showing the largest decrease within the first 30 min. From 210 to 240 min, when the cortical time–activity curve decreased the most, a small decrease in the slope of the cerebellum time–activity curve was observed but was transient and recovered quickly. Thus, at 270 min after injection, the slope of the cerebellum time–activity curve recovered to a steady decline indicative of tracer washout, with no indication of tracer displacement (Fig. 5).

Scatterplots of SRTM vs. TR measurements: BPpre vs. SUR180 (A), BPpost vs. SUR400 (B), and %DisplSRTM vs. %DisplTR (C).

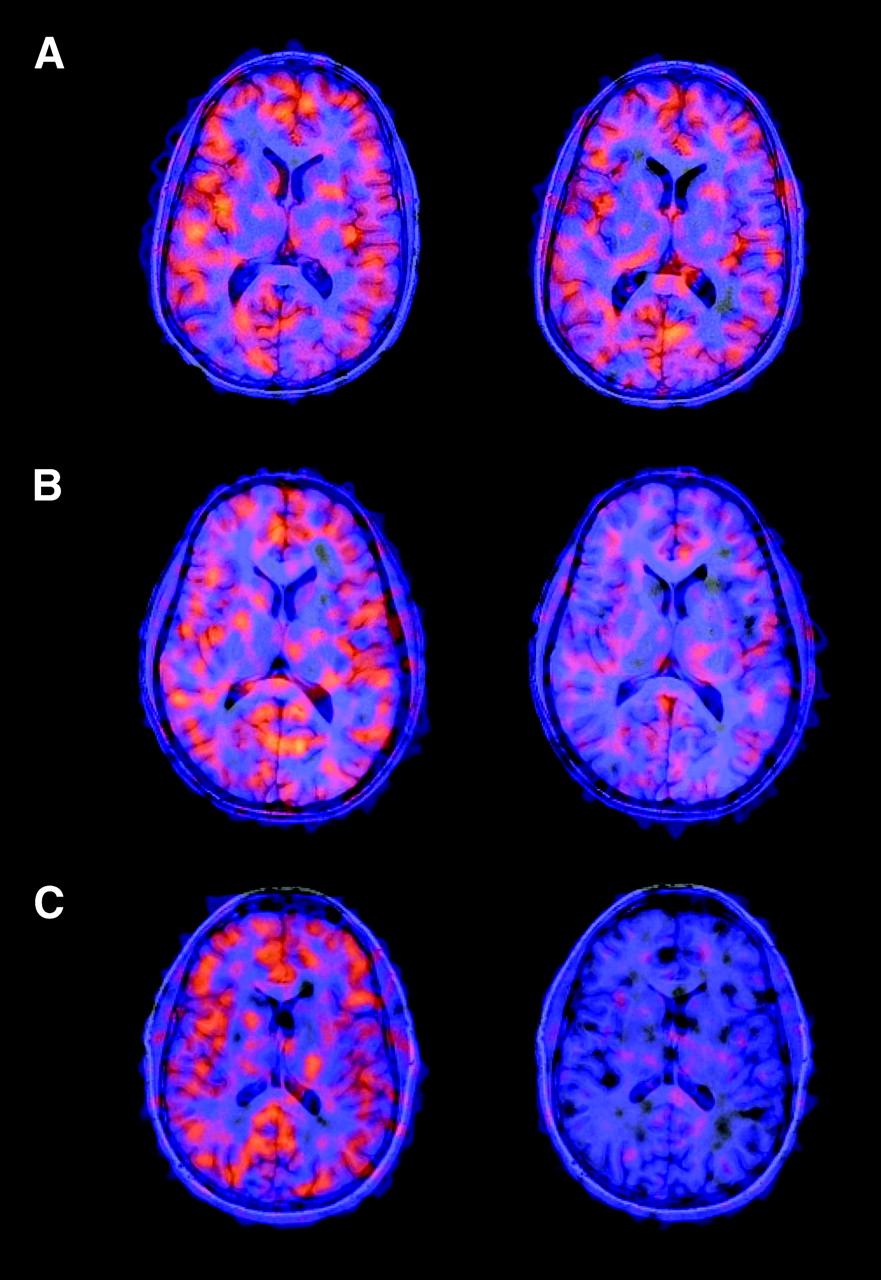
Coregistered MRI/SPECT images from 3 representative healthy volunteers, each receiving a different ketanserin dose. Baseline scans at 180 min after injection are on left; postketanserin scans at 400 min after injection are on right. Ketanserin doses are 0.015 mg/kg (A), 0.05 mg/kg (B), and 0.1 mg/kg (C). Gradual dose-dependent displacement is seen. (Reprinted from (9 [Fig. 19]) with the kind permission of Springer Science and Business Media.)

Mean SUR values over time for all cerebral regions studied from each pair of subjects on same ketanserin dose.
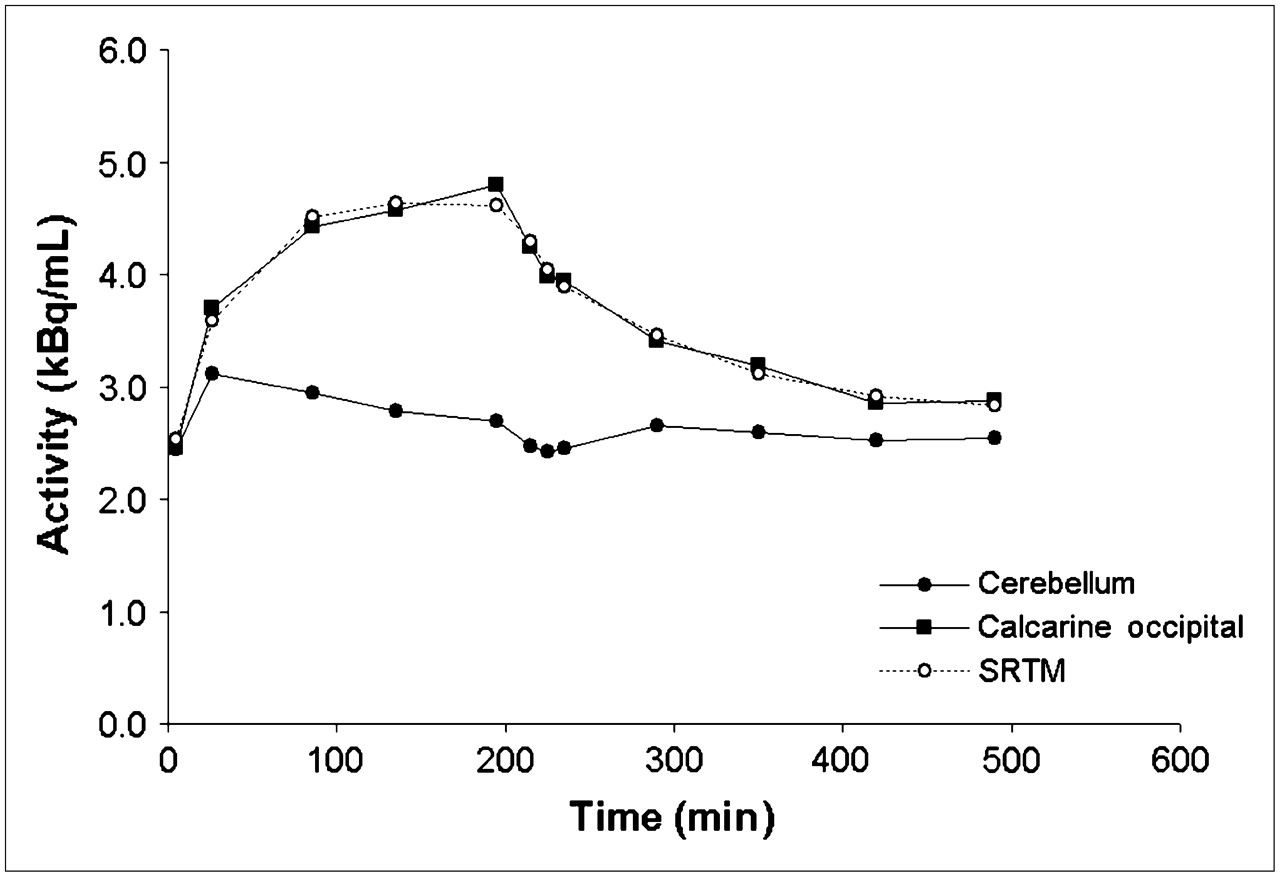
Time–activity curves of cerebellum and occipital calcarine region, with corresponding SRTM fit, from subject receiving highest ketanserin dose, 0.1 mg/kg. Slight and transient decrease in cerebellum uptake is seen from 210 to 240 min, when largest decrease in cortical time–activity curve occurred. Cerebellum slope recovered completely by 270 min.
BP Values Calculated from SRTM, and SUR Calculated from TR, with Corresponding Percentages of 123I-R91150 Displacement for Each Region in Each Subject at the 3 Ketanserin Doses
Ketanserin Plasma Concentration and Relationship with 123I-R91150 Displacement
Mean ketanserin plasma levels at the times used for displacement calculations with TR (400–440 min after injection of 123I-R91150) were 18.9 ± 0.35 ng/mL for the 0.1 mg/kg dose, 9.00 ± 0.27 ng/mL for the 0.05 mg/kg dose, and 3.60 ± 1.10 ng/mL for the 0.015 mg/kg dose. Given the limited time over which ketanserin plasma levels were observed, no formal pharmacokinetic analysis was run.
The Hill equation fitted the displacement data adequately in all regions both when the displacement was calculated with SRTM and when the displacement was calculated with TR (Fig. 6). The model parameters calculated for each region (Table 2) showed that Displmax was close or equal to 100% in all regions, indicating that ketanserin can completely displace 123I-R91150. EC50 ranged from 4.2 to 7.1 ng/mL using SRTM data (population mean, 5.6 ng/mL) and from 3.4 to 6.5 ng/mL using TR data (population mean, 5.0 ng/mL). Estimates of the Hill slope factor were closer to 1 with SRTM data (population mean, 1.3) than with TR data (population mean, 1.8).
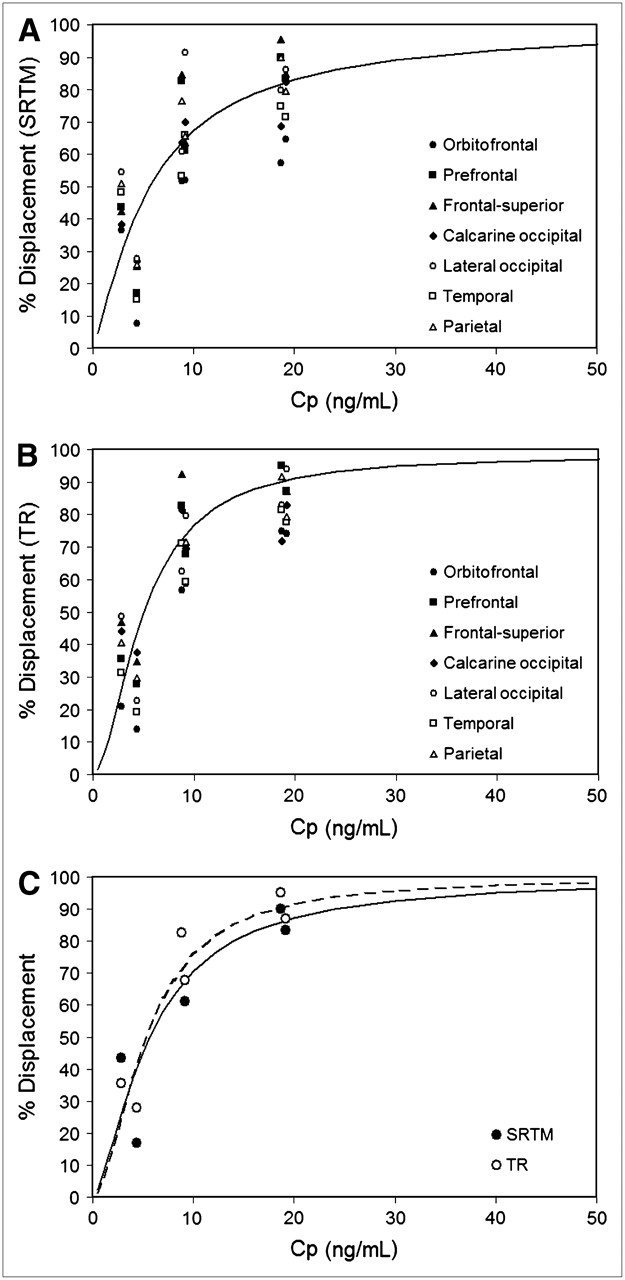
Relationship between ketanserin plasma concentration and 123I-R91150 displacement using SRTM, for all cortical regions (A); using TR, for all cortical regions (B); and comparing model fit for both SRTM and TR in representative region (prefrontal cortex) (C).
Model Parameters Calculated for Each Region Using Both SRTM and TR
DISCUSSION
This study reports for, what is to our knowledge, the first time the effect of different intravenous doses of ketanserin on cerebral uptake of 123I-R91150 in humans. Ketanserin is a potent 5-HT2A receptor antagonist (inhibition constant, 0.38 nmol/L), with less affinity for 5-HT2C receptors (inhibition constant, 14.5 nmol/L) (10). Ketanserin has also an affinity for α1-adrenergic receptors and histamine 1H receptors (11). Ketanserin lowers blood pressure in patients with hypertension, likely because of its α1-adrenergic antagonism. The compound has been shown to be tolerable, and severe side effects after treatment have not been reported (12). The clinical oral dose for hypertension is 20–80 mg/day. The maximum ketanserin doses administered in this study were 7.47 and 7.72 mg (subjects 1 and 2, respectively). An intravenous dose of 10 mg has been reported effective in the treatment of postanesthetic shivering in humans (13). The present study showed that large 5-HT2A receptor occupancies were achieved even with subtherapeutic doses of ketanserin. In the preliminary SPECT study using the 0.1 mg/kg dose as a challenge for 123I-R91150 in humans, no changes were observed in blood pressure, temperature, or pulse up to 12 h after administration (4). Similarly, no safety issues were found in the present study with any of the doses tested. Blood pressure, heart rate, and the electrocardiogram, including QTc interval, were maintained within reference ranges for the entire scanning period.
123I-R91150 Plasma Analysis
The activity corresponding to unmetabolized parent compound versus time (average value for 9 venous blood samples) was previously reported (1). As shown in the present work, during the basal state (before ketanserin administration), results similar to those previously reported (1) were found. Taking into account average values (n = 6), we can state that a peak is found at 1.5 min after injection and that a quick decrease in activity ending in a plateau is found at less than 15 min after injection. The activity value at maximum (1.5 min) was 0.068 × 10³ mL−1, which differs from that previously reported, 0.035 × 10³ mL−1 (1). Variability between subjects at short times has proven to be important (Fig. 1A, in which the SD for each group is shown).
One aim of analyzing plasma metabolites in the present work was to find out whether displacement of radioligand 123I-R91150 by ketanserin could be detected as an increase in the concentration of free parent compound in plasma. As Figure 1 shows, no conclusions could be drawn on this point. With only 2 subjects included in each group, differences between subjects of the same group were often greater than differences between subjects of different groups. The expected increase in the concentration of free parent compound in plasma after administration of ketanserin (210 min after injection) is not detected as an increase in the amount of radioactivity (corresponding to unmetabolized parent compound) in plasma.
Ketanserin-Induced Displacement of 123I-R91150
This study found a ketanserin dose–dependent displacement of 123I-R91150, supporting the specificity of 123I-R91150 binding to 5-HT2A receptor. A ketanserin dose of 0.1 mg/kg was previously reported to be a saturation dose, that is, a dose inducing more than 90% displacement, using 18F-altanserin in monkeys (5). The present study showed that this dose induced a 123I-R91150 displacement in the human brain that varied depending on the cortical region studied, ranging from 57.1% to 95.4% using SRTM values or from 71.9% to 101.2% using TR values. This finding agrees with the preliminary results of Travis et al. (4), who reported fast and intense displacement of 123I-R91150 to levels similar to those in the cerebellum in 3 healthy volunteers. The present study showed, in addition, intermediate (SRTM, 51.7%–91.4%/TR, 56.7%–102.8%) and low (SRTM, 7.7%–54.5%/TR, 13.8%–47.0%) 123I-R91150 displacements induced by, respectively, the subtherapeutic intermediate (0.05 mg/kg) and lowest (0.015 mg/kg) ketanserin doses tested, indicating that the SPECT technique is sensitive in detecting drug-induced occupancy of the 5-HT2A receptor. SRTM was used as the gold standard quantification method because the TR method may introduce errors in the determination of displacement. A good correlation was found between displacement measures using BP values (SRTM) and displacement measures using SUR values (TR). This finding supports the use of a single acquisition at pseudoequilibrium after bolus injection of 123I-R91150 and quantification using TR for measurement of drug-induced occupancy of the 5-HT2A receptor. The simplicity of this technique makes it suitable for most SPECT centers and increases patient compliance.
In previous SPECT studies with 123I-R91150 (2–4,14), and PET studies of the 5-HT2A receptor (15–17), the cerebellum was used as a reference region for quantification. In this study, a fast and transient decrease in the cerebellum time–activity curve was observed from 210 to 240 min after injection, that is, during the first 30 min after ketanserin administration, when the largest decrease in specific cortical binding occurred. This finding was also reported in a bolus/infusion study using 18F-altanserin (15), from which the cerebellum was concluded to be a valid representation of free and nonspecifically bound ligand and brain radiolabeled metabolites. This conclusion was based on, first, the fact that although a small amount of 5-HT2A receptor is detectable by autoradiography, it may be difficult to detect by means of PET/SPECT and ketanserin displacement because of the poor statistical quality of the imaging data and spatial resolution of the images and, second, evidence that blocking the 5-HT2A receptor with unlabeled MDL 100,907 before a PET study did not eliminate the need for a 2-tissue-compartment model in the cerebellum (18). An acute and transient effect of ketanserin on cerebellar regional cerebral blood flow might also be considered. However, such an effect seems unlikely given that no blood pressure decrease was detected in any subject studied, and taking into account the marked decrease in systemic blood pressure needed to significantly decrease regional cerebral blood flow, because of the cerebral autoregulation mechanisms. The low 123I-R91150 uptake in cerebellum and lack of displacement after ketanserin administration found in this study further support the suitability of using this region as a reference.
Ketanserin Plasma Concentration and Relationship with 123I-R91150 Displacement
The ketanserin pharmacokinetics profile after intravenous injection increased linearly with increasing dose. The subtherapeutic dose range explored for ketanserin and the short pharmacokinetics collection time (less than 5 h) did not allow for a direct comparison between reported ketanserin pharmacokinetics parameters (19) and pharmacokinetics data from the present study. However, the ketanserin plasma levels found 4 h after injection at the highest dose (approximately 7.5 mg) were in line with the average concentration measured at the same time point after a 10-mg intravenous injection in healthy subjects (19). The Hill equation used for describing the concentration-displacement relationship in the different ROIs described the data well, both using displacement calculated according to SRTM and using displacement calculated according to TR, with little difference in ketanserin potency and maximal displacement among different brain regions. In particular, a 15%–20% variability in EC50 was observed among different regions, indicating a fairly homogeneous displacement mechanism in brain areas expressing 5-HT2A receptors. Also, the EC50 values calculated using SRTM- and TR-derived displacements agreed well. Differences were less than 20%, with the exception of the calcarine occipital and frontal superior regions. Overall, the major differences between the model parameters calculated using SRTM and those calculated using TR were in hill slope factor (γ) estimates, supporting the fact that the concentration-displacement relationship conforms to a rectangular hyperbola (i.e., interaction with a single binding site) only for SRTM-derived data.
CONCLUSION
123I-R91150 is a SPECT radioligand specific for the 5-HT2A receptor in the human brain. The findings of the present study demonstrate that 123I-R91150 SPECT is sensitive enough to measure ketanserin-induced displacement in a dose-dependent manner and support the use of the cerebellum as a reference region for quantification. The relationship between displacement and ketanserin plasma concentration was well defined, with an EC50 of 5.6 ng/mL based on SRTM displacement and of 5.0 ng/mL based on TR.
Use of the simplified method of acquiring a single scan at pseudoequilibrium after bolus injection of 123I-R91150 and TR produced results comparable to those of using scanning over time and SRTM. Therefore, TR after a single acquisition at pseudoequilibrium can be used to measure drug-induced occupancy of the 5-HT2A receptor with 123I-R91150 SPECT.
Acknowledgments
The authors thank Roger N. Gunn, Domenec Ros, Michael Travis, and Emilio Merlo-Pich for meaningful discussions; Eugenii Rabiner, Manel Barbanoj, Maria Penengo, Pedro Plaza, Javier Perich, and Clare Burgess for useful contributions to the design and execution of the protocol; Nuria Merino and Vanessa Gómez for excellent technical assistance; and all the volunteers who participated in the study. This study was supported by the Psychiatry Centre of Excellence for Drug Discovery, Clinical Pharmacology Discovery Medicine/Experimental Medical Sciences, GlaxoSmithKline.
References
- Received for publication December 27, 2005.
- Accepted for publication March 1, 2006.


Jump to section
Related Articles
Cited By...
- The Influence of Morphine on Cerebral 5-HT2A Availability in Dogs: a SPECT Study
- Contribution of SPECT Measurements of D2 and 5-HT2A Occupancy to the Clinical Development of the Antipsychotic SB-773812
- Characterization of the SPECT 5-HT2A Receptor Ligand 123I-R91150 in Healthy Volunteers: Part 1--Pseudoequilibrium Interval and Quantification Methods