

FIGURE 5.
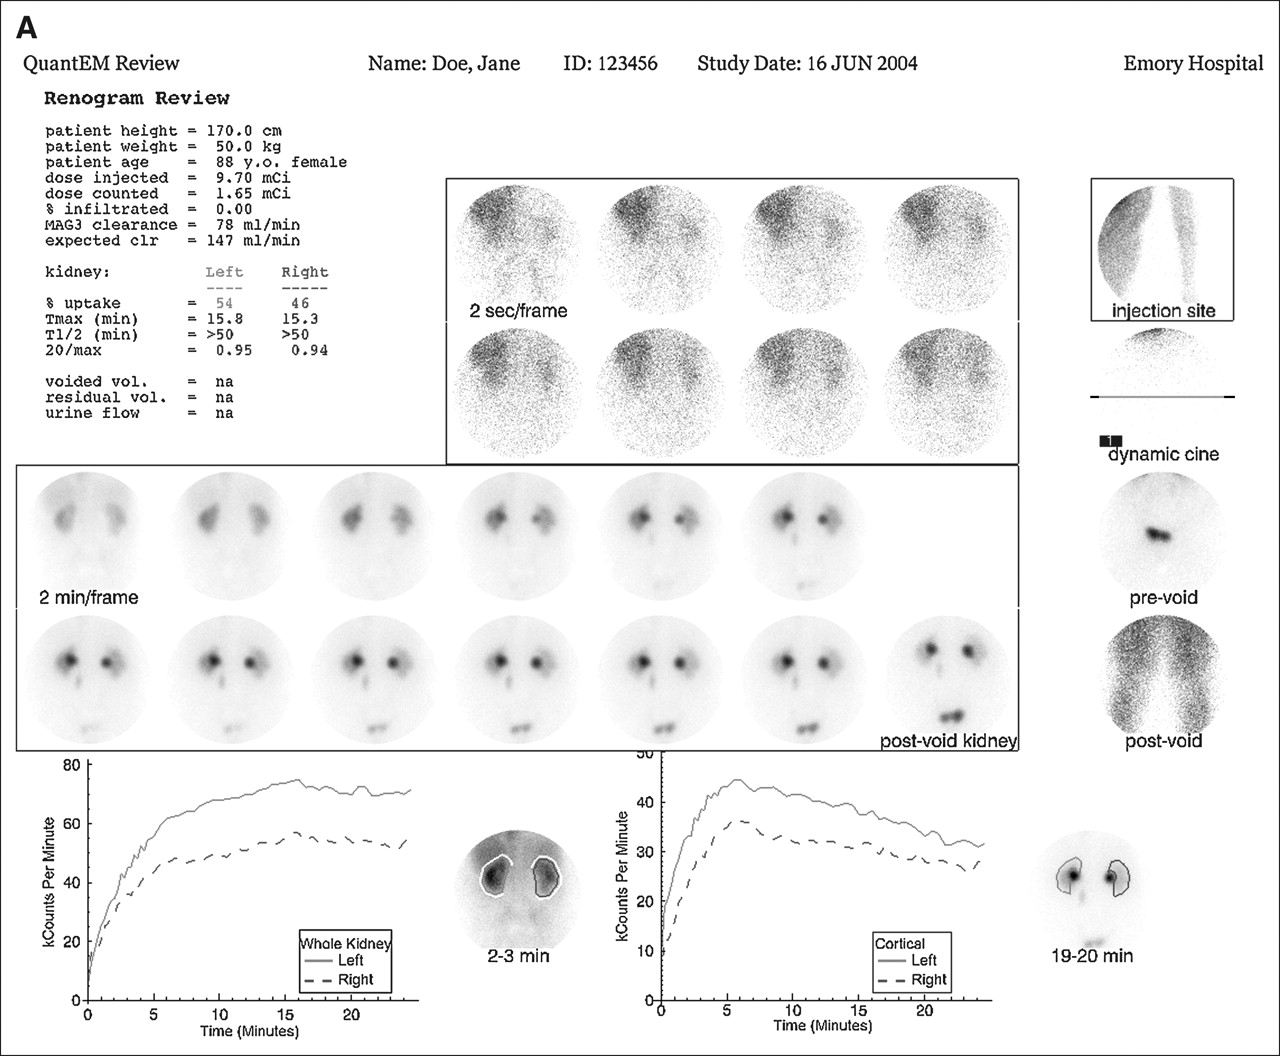
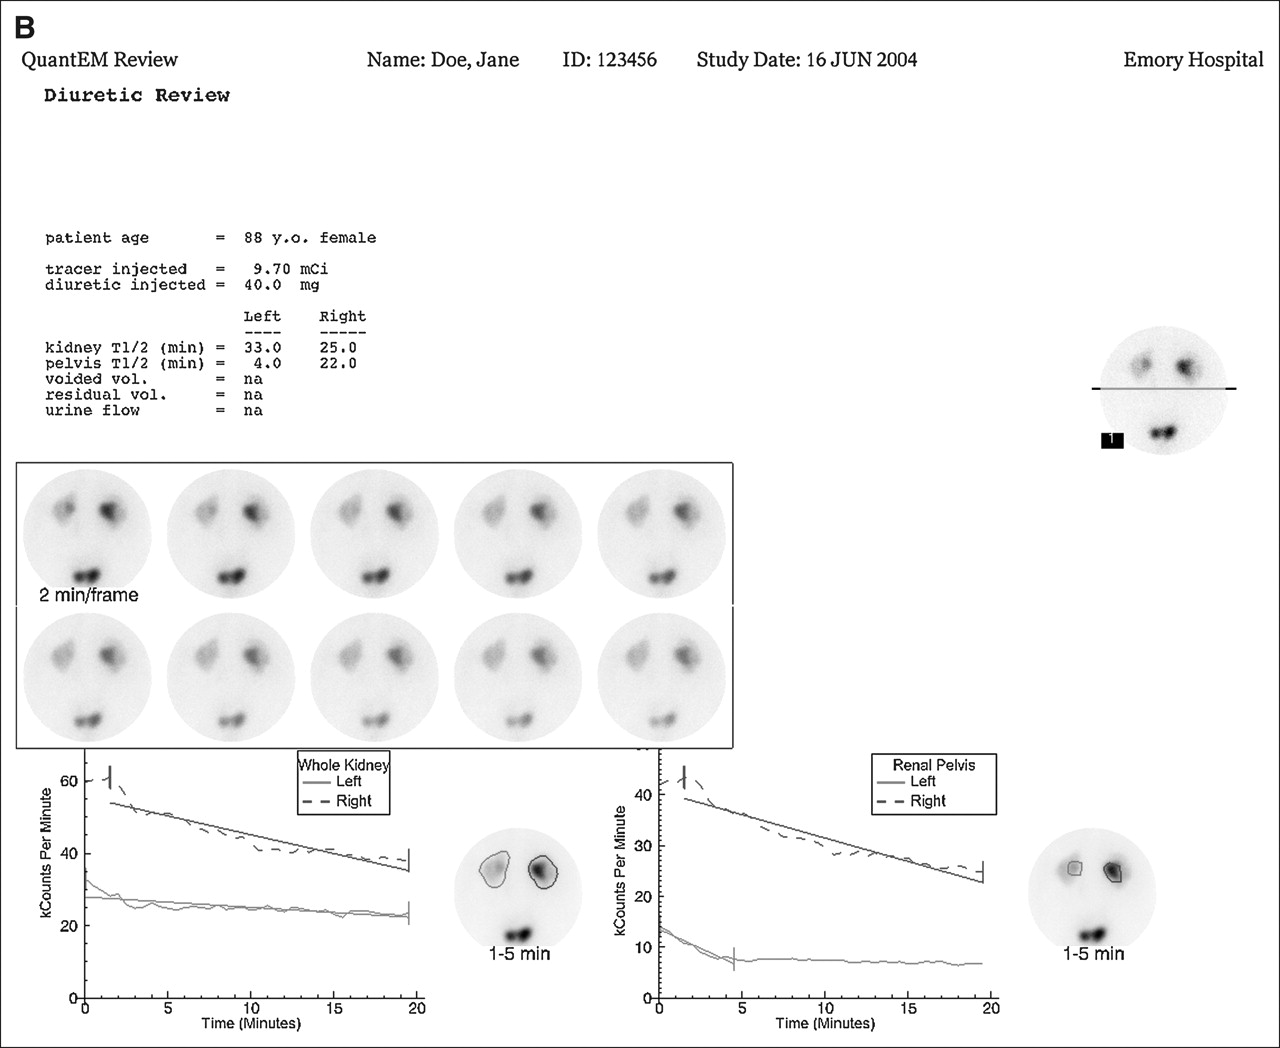
Output of QuantEM II quantification program for prefurosemide study (A) and postfurosemide study (B) of patient 12 from Table 1. (A) Display under Renogram Review shows demographic and quality control data as well as 99mTc-MAG3 clearance, expected 99mTc-MAG3 clearance, percentage uptake in each kidney, and Tmax (time to maximum counts), T1/2 (time to halfmaximum counts), and 20 min/max ratio (ratio of counts at 20 min to maximum counts) for whole-kidney ROI. The expression “na” indicates that the indicated urine parameters were not measured. Top center panel shows 2-s images of the initial bolus as it reaches the kidney. Top right panel is a quality control image showing the injection site. Just beneath the injection site image are frames for viewing a dynamic cine and pre- and postvoid bladder images. Center panel shows twelve 2-min images followed by a supine postvoid image of the kidneys. Bottom left panel shows whole-kidney ROIs and whole-kidney renogram curves, whereas bottom right panel shows cortical ROIs and cortical renogram curves. There was no infiltration; 99mTc-MAG3 clearance was reduced at 83 mL/min/1.73 m2 compared with an expected clearance of 147 mL/min/1.73 m2. There is essentially equal uptake in 2 kidneys; whole-kidney ROIs show that both kidneys have delayed time to peak values of approximately 15 min and prolonged T1/2 values of >50 min. Values for cortical ROIs (Expanded Review Page, not shown) demonstrate improvement in time to peak values (<6 min for both kidneys) but the T1/2 values are still >50 min. Delayed (18–24 min) and postvoid images show retention in renal pelvis of both kidneys. Because of reduced 99mTc-MAG3 clearance, bilateral pelvic retention, and prolonged whole-kidney and cortical T1/2 values, baseline imaging could not exclude obstruction in either kidney; consequently, 40 mg of furosemide were administered intravenously and additional imaging was performed (B). (B) In the Diuretic Review format, the top left panel indicates patient's age and dose of furosemide as well as T1/2 values for whole-kidney and pelvic ROIs. Dynamic cine images can be reviewed in the top right panel, whereas center panel presents 10 sequential 2-min images. The bottom left panel shows whole-kidney renogram curves and the bottom right panel shows pelvic renogram curves drawn around area of urine retention in each kidney. Visually, counts in the bladder decrease, indicating the presence of a bladder catheter. There is prompt drainage of the tracer from the left renal pelvis (T1/2 of 4 min) excluding obstruction; diffuse retention in left kidney reflects underlying impairment in renal function. RENEX agreed that left kidney was not obstructed with a CF value of −0.40. There is persistent retention in right renal pelvis with a prolonged pelvic T1/2 of 22 min. Because the kidneys had equal function (equal relative uptake, A), right kidney should have been able to drain as effectively as left kidney. The fact that right kidney shows persistent pelvic retention and drains much slower than left kidney indicates that right kidney is probably obstructed. RENEX agreed that right kidney was obstructed with a CF value of 0.42.
In this issue


Related Articles
Cited By...
- Receiver-Operating-Characteristic Analysis of an Automated Program for Analyzing Striatal Uptake of 123I-Ioflupane SPECT Images: Calibration Using Visual Reads
- Development of a Relational Database to Capture and Merge Clinical History with the Quantitative Results of Radionuclide Renography
- Automated Patient Motion Detection and Correction in Dynamic Renal Scintigraphy
- Decision support systems for clinical radiological practice -- towards the next generation
- Diagnostic Performance of an Expert System for Interpretation of 99mTc MAG3 Scans in Suspected Renal Obstruction
- Optimized, Automated Striatal Uptake Analysis Applied to SPECT Brain Scans of Parkinson's Disease Patients
- Being Right for the Right Reason: Better Than Just Being Right?
- Development and Prospective Evaluation of an Automated Software System for Quality Control of Quantitative 99mTc-MAG3 Renal Studies
- A Software Engine to Justify the Conclusions of an Expert System for Detecting Renal Obstruction on 99mTc-MAG3 Scans
- An Expert System for the Detection of Renal Obstruction
- Reply: an expert system for the detection of renal obstruction.