


Abstract
A renal expert system (RENEX) has been developed to assist physicians detect renal obstruction in patients undergoing pre- and postfurosemide 99mTc-mercaptoacetyltriglycine (99mTc-MAG3) scans. RENEX uses quantitative parameters extracted from the dynamic renal scan data and heuristic rules in the form of a knowledge base (KB) obtained from expert interpreters to conclude whether a kidney is obstructed. Methods: Normal limits were established for 47 quantitative parameters extracted from the 99mTc-MAG3 scans of 100 potential renal donors. From these data the domain expert estimated 5 boundary conditions for each parameter: (i) definitely abnormal, (ii) probably abnormal, (iii) equivocal, (iv) probably normal, and (v) definitely normal. A sigmoid-type curve was then generated from these 5 boundary conditions, creating a parameter knowledge library used for converting the value of a prospective patient's individual quantitative parameters to a certainty factor (CF). Sixty heuristic rules were extracted from the domain expert to generate the KB for detecting obstruction. A forward-chaining inference engine was developed using the MYCIN combinatories (an approximation of Bayes theorem) to determine obstruction. A justification engine was implemented, which recorded the sequence of each rule that was fired and the current CF value of all input and output parameters at the time of instantiation to track and justify the logic of the conclusions. The entire system was fine tuned and tested using a pilot group of 32 patients (11 males, 21 females; mean age, 56.8 ± 17.2 y; 63 kidneys) deemed by an expert panel to have 41 unobstructed kidneys, 13 obstructed kidneys,and 9 equivocal findings. Results: RENEX agreed with the expert panel in 92% (12/13) of the obstructed kidneys, 93% (38/41) of the unobstructed kidneys, and 78% (7/9) of the kidneys interpreted as equivocal for obstructions. Processing time per patient was practically instantaneous using a 3.0-GHz personal computer programmed using interactive data language. Conclusion: We have developed a renal expert system for detecting renal obstruction using pre- and postfurosemide 99mTc-MAG3 renal scans, at a standardized expert level. These encouraging preliminary results warrant a prospective study in a large population of patients with and without renal obstruction to establish the diagnostic performance of this system.
The use of diagnostic imaging in patient care is increasing. At the same time, diagnostic imaging is becoming more complicated, not simpler. Physicians are required to master an ever-expanding knowledge base (KB) while the hours available to master this KB and apply it to specific tasks (e.g., image interpretation, seeing a new patient) are steadily shrinking. The convergence of an expanding KB and escalating time constraints will inevitably lead to physician errors. Hence, it is desirable that tools be developed and implemented that assist physicians in interpreting studies at a faster rate and at a higher level of expertise. Such tools will minimize subjectivity and intra- and interobserver variation in image interpretation and help achieve a standardized high level of performance. Because almost all diagnostic imaging is digital, computers are a necessary part of acquiring and processing imaging studies and it is reasonable to expect that these new tools should be computer based. These tools have traditionally been statistically based but, more recently, statistical approaches are being complemented or replaced by heuristically based software tools.
Over the past several years, artificial intelligence methods have been investigated as a way to develop such tools. Examples include neural networks (1–3) and case-based reasoning (4) techniques to provide computer-assisted diagnosis of planar and SPECT myocardial perfusion studies. In the artificial neural net approach, the concept is to try to emulate how human neurons perform pattern-recognition tasks. Repeated recognition trials are run using sample myocardial perfusion data as input and corresponding coronary angiography results as output to modify the strength between the input and output nodes. In this manner, the net is trained and the input data eventually predict the output. In the case-based reasoning approach the algorithm searches a library of patient cases to find the ones that best match those of the patient study being analyzed. The common findings from these cases, such as coronary angiography results, are then used to assist the diagnostician's interpretation. Another artificial intelligence approach that has been investigated to assist diagnosticians in making clinical interpretations is the knowledge-based expert system. In expert systems, a KB of heuristic rules is obtained from human experts capturing how they make their interpretations. These rules are usually expressed in the form of “IF A THEN B” expressions.
Expert systems have been investigated in nuclear medicine to assist in the interpretation of perfusion–ventilation lung studies (5) and hexamethylpropyleneamine oxime brain SPECT studies (6). We have also developed (7) and extensively validated (8) an expert system called PERFEX (for perfusion expert) as a tool for the computer-assisted diagnosis of stress–rest myocardial perfusion SPECT. The goals of this current work are (i) to use the expertise gained in PERFEX to develop a generalized methodology to aid in the interpretation of imaging studies using an expert system to analyze quantitative data extracted from imaging studies and (2) to demonstrate proof-of-principle by applying this generalized methodology to develop a renal expert system (RENEX) for detecting renal obstruction using pre- and postfurosemide 99mTc-mercaptoacetyltriglycine (99mTc-MAG3) renal scans. We have chosen to develop a decision support system to detect renal obstruction from 99mTc-MAG3 renography because the vast majority of the 590,000 renal scans performed annually in the United States are performed with 99mTc-MAG3 and many are interpreted by diagnosticians in sites that perform <3 studies per week (9). The exposure to these few studies makes it difficult for them to develop the needed expertise in interpreting 99mTc-MAG3 studies.
MATERIALS AND METHODS
Patients
Renal studies from 32 patients (11 males, 21 females; mean age, 56.8 ± 17.2 y; 63 kidneys) were used as a pilot group to develop and test RENEX. All studies used for this development were obtained from the renal database of patients referred to our nuclear medicine service to evaluate suspected renal obstruction. This study was performed under the purview and approval of Emory's Internal Review Board. Patients were selected because their studies included a baseline 99mTc-MAG3 dynamic study followed by a furosemide challenge; in addition, studies were selected to include a variety of responses to develop a complete set of heuristic rules for interpreting renal obstruction.
Acquisition Protocol
Patients were positioned supine, with the scintillation camera detector placed under the table. A 3-phase dynamic acquisition (baseline scan) was begun as a single dose of 370 MBq (10 mCi) of 99mTc-MAG3 was injected; phase one consisted of twenty-four 2-s frames, phase 2 was sixteen 15-s frames, and phase 3 was forty 30-s frames. For all patients in the study, review of the baseline scan could not exclude obstruction and all patients in the study received an intravenous injection of 40 mg of furosemide followed immediately by a second single-phase 20-min dynamic acquisition consisting of forty 30-s frames. Thus, the 3-phase dynamic acquisition followed by a second single-phase 20-min dynamic acquisition were acquired from the one initial 99mTc-MAG3 injected dose.
Data Analysis
All patient studies were processed using the QuantEM renal quantification program designed by Taylor et al. (10). The QuantEM software, developed specifically for 99mTc-MAG3, incorporates several quality control procedures to improve reproducibility, generates specific quantitative parameters recommended for scan interpretation, and allows the 99mTc-MAG3 clearance to be calculated using a camera-based technique. QuantEM has been previously extensively validated in a multicenter trial (11).
For the baseline renogram, a static image is summed from the 2- to 3-min postinjection frames. Using a filtered version of this image, whole kidney, background, and cortical regions of interest (ROIs) are automatically defined. The user can override any of these automatic ROIs and replace them with manual ROIs. Background-subtracted curves are generated for the whole kidney and 47 quantitative parameters are generated, including patient demographics (height, weight, age, sex, body surface area), curve parameters (time to peak counts, and 20 min-to-maximum count ratio for both whole kidney and cortical ROIs), voiding indices (postvoid-to-prevoid and postvoid-to-maximum count ratios), and the 99mTc-MAG3 clearance. The 99mTc-MAG3 clearance is calculated from the 1- to 2.5-min whole-kidney 99mTc-MAG3 counts, and the preinjection and postinjection images of the dose syringe.
For the diuretic study, a static image is summed from the 1- to 5-min postinjection frames. ROIs are manually drawn for the whole kidney, background, and renal collecting system. Background-subtracted curves are generated for the whole kidney and renal pelvis, and times-to-half-peak are calculated.
After processing the diuretic study, the baseline renogram results are loaded and ratios are calculated comparing the first-minute counts and prevoid (last minute) counts in the diuretic study with the 1- to 2-min counts and peak counts in the baseline study.
Expert Panel Review
Diagnosis of renal obstruction was based on the interpretation of a panel of 3 experts, who reviewed the scans of all 32 patients in the pilot database for the presence or absence of renal obstruction. Each kidney was graded for the presence or absence of obstruction on a 5-point scale (1 = definitely not obstructed, 2 = probably not obstructed, 3 = equivocal for obstruction, 4 = probably obstructed, and 5 = definitely obstructed). Each expert was unaware of the results of the other experts and unaware of the results of the expert system in scoring each kidney. The consensus reading of all 3 experts was used as the final interpretation. The 32 patient studies were deemed by the expert panel to have 41 unobstructed kidneys, 13 obstructed kidneys, and 9 equivocal findings.
Expert System
The architecture of RENEX is inspired by that of 2 previously developed expert systems; MYCIN (12) and PERFEX (8). MYCIN is a pioneering rule-based expert system developed in the 1970s to assist physicians determine the appropriate therapy for patients with infections. PERFEX is a commercially available imaging expert system that we developed to assist physicians in the interpretation of myocardial perfusion SPECT studies.
Figure 1 shows the flow of how a patient's renal scan is acquired, processed, quantified to extract parameters of renal obstruction, converted to certainty factors (CFs) and submitted to the inference engine to reach a conclusion as to whether or not a kidney is obstructed. The expert system is comprised of the KB, the inference engine and the justification engine. The trapezoidal blocks in Figure 1 indicate the domain expert knowledge that is provided in the form of boundary conditions for each input parameter and heuristics rules to interpret obstruction which comprise the KB. The 3-dimensional blocks indicate software algorithms. The parameter knowledge library is only generated once and then regenerated only when the knowledge that creates the parameter input list is enhanced by more experience or more data.

Flow diagram for RENEX shows the flow of how a patient's renal scan is acquired, processed, and quantified to extract parameters of renal function; these parameters are converted to certainty factors (CF) that are then the input to the expert system. The expert system is comprised of the KB, the inference engine, and the justification engine. Trapezoidal blocks indicate domain expert input; rectangular blocks indicate software algorithms. Three-dimensional boxes indicate software functions performed by RENEX.
Parameter Knowledge Library: Converting Input Parameters to CFs.
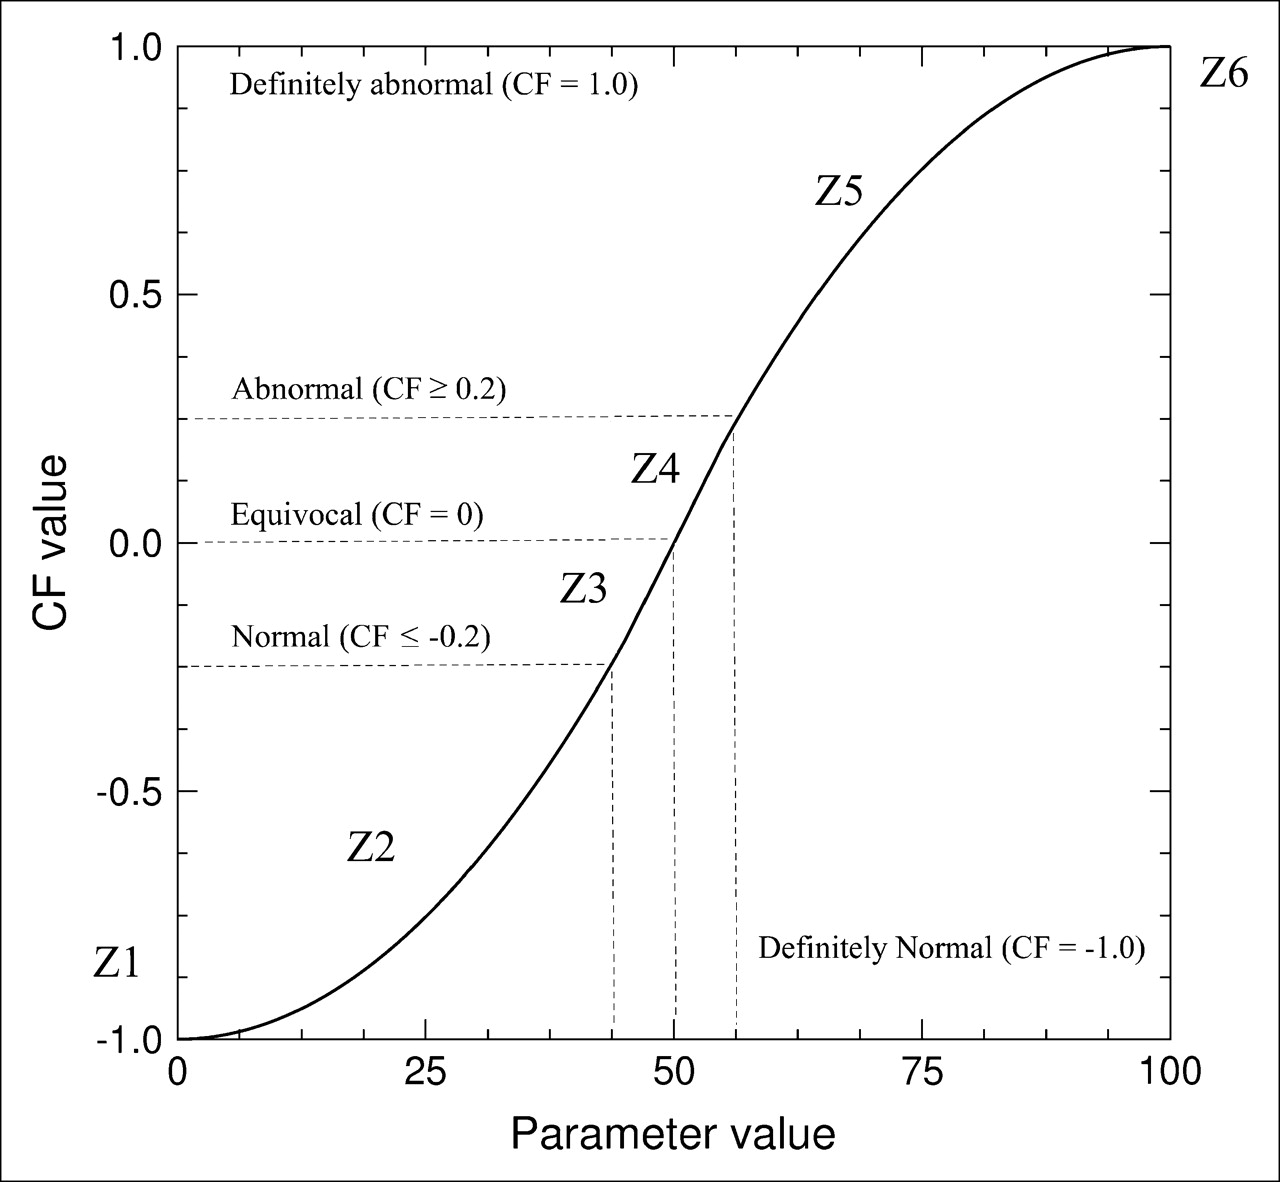
Each of the quantitative renal parameters extracted by the QuantEM program that are pertinent for the determination of obstruction are first converted or transformed to a CF to be used by RENEX to determine the presence or absence of obstruction. The CFs indicate the degree of certainty that each parameter's value is consistent (or inconsistent) with obstruction. A sigmoid-type function has been used for this transformation because it exhibits several beneficial properties: (i) like humans, it emulates the nonlinear response of the eye to intensity variations in a logarithmic fashion (13) or the density response of film to an exposure (14); (ii) it is used in neural nets as an activation function to emulate the relationship of how neurons fire—that is, decide on the basis of an input whether to trigger a response (15); (iii) both the high and low values approach an asymptote and, therefore, never exceed +1 or −1 (Fig. 2).

Plot of sigmoid-type curve transformations from a quantitative parameter value (normalized from 0% to 100%) to a CF value. The transformation is constrained by the 5 boundary conditions established by the domain expert (definitely normal, probably normal, equivocal, probably abnormal, and definitely abnormal). Appendix A provides the equations for the transformations of zones 1–6 (Z1–Z6) shown here.
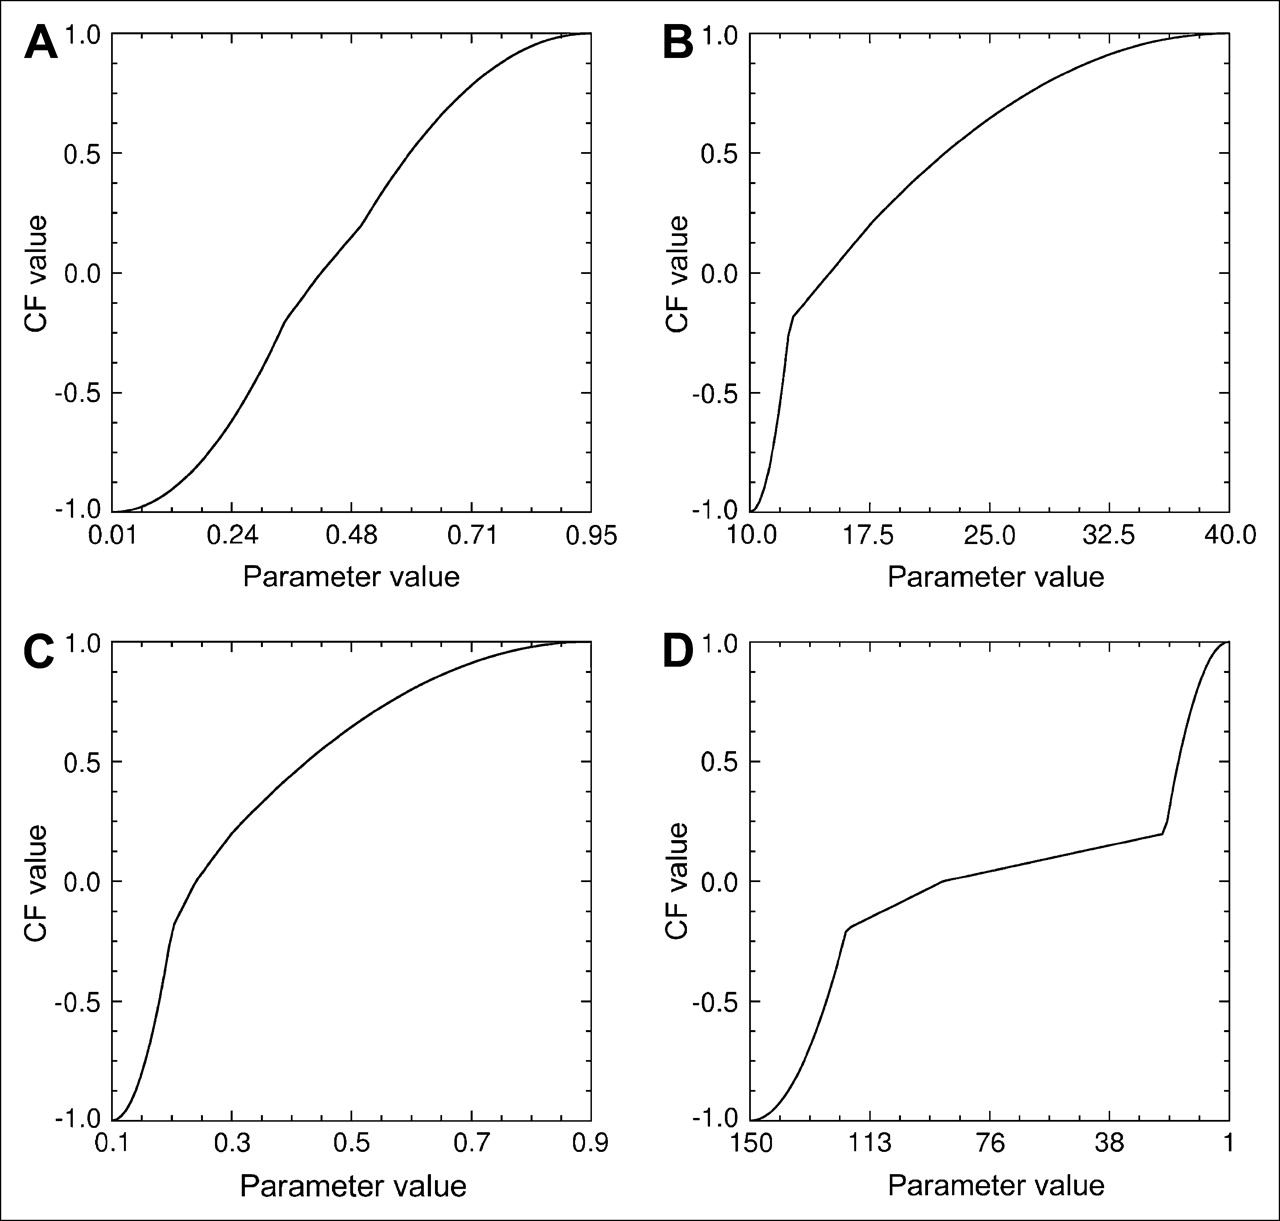
A parameter knowledge library was generated that contains the specific transformation for each parameter used. To establish the transformation for each parameter in the library, the domain expert identified the 5 constraints or boundary conditions used to fit the sigmoid-type curve. These 5 boundary values correspond to values where the parameter is definitely normal (−1), probably normal (−0.2), equivocal (0), probably abnormal (0.2), and definitely abnormal (+1) (Fig. 2). Because it is difficult to be 100% certain in medicine, the CF value conversions were constrained between −0.9 and 0.9. To establish these boundary conditions the expert used his knowledge of the field and previous determinations of normal values for each parameter extracted from 100 potential renal donors (16). Appendix A provides the exact equations used for the transformation, which is similar to one used by Gavrielides et al. (17). Figure 3 illustrates the transformation for 4 typical parameters. Note that the method requires that the curve pass through the 5 boundary conditions; consequently, the curves have a general sigmoid shape but do not have a smooth, exact, sigmoid fit (Fig. 3). Once the parameter knowledge library of sigmoid-type curves is generated (one for each input variable), the library is available to transform any prospective patient's quantitative parameters to CFs.

Graphical representation of the transformation of 4 typical input quantitative parameters to CF values. Note that since the transformation is constrained to exactly cross the 5 boundary conditions, it often generates transformations that, though sigmoid-like, are not truly sigmoid. The 4 parameters illustrated are as follows. (A) Furosemide prevoid to baseline maximum. This is the ratio of the counts over a kidney's ROI at the end of the renogram after furosemide but previous to voiding to the maximum counts in the same ROI from the prefurosemide renogram baseline study. (B) Furosemide pelvis time to half peak. This is the amount of time that it takes for the renogram curve extracted from a kidney's pelvic ROI to decrease from its maximum value to half that value. (C) Furosemide postvoid baseline 1-2 min. This is the ratio of the counts over a kidney's ROI from the renogram after furosemide and postvoid to the counts during the 1- to 2-min interval in the prefurosemide baseline study. (D) Furosemide 99mTc-MAG3 clearance curve is the calculated 99mTc-MAG3 clearance for that kidney.
When a renal scan is processed, quantitative values are generated for each parameter and a list of these quantitative parameter values is submitted as input to an algorithm. This algorithm has already stored the parameter knowledge library. For each parameter value, the algorithm generates a specific sigmoid-type curve according to the specific curve-fitting parameters (boundary conditions) and then converts the quantitative value to a CF.
KB.
The KB was generated through systematic interviews to extract from the domain expert heuristic rules (also known as production rules), in an “IF A THEN B” format (or if antecedent then consequence format) that are used by experts when they use specific renal parameters to reach a conclusion regarding whether a patient's kidney was obstructed. The domain expert was requested to provide both heuristic rules and the degree of certainty (CF) that the rule is believed to be true.
For example, a typical heuristic rule reads: If the time to half peak of the left kidney pelvis postfurosemide renogram is abnormal, then there is a strong positive evidence (CF = 0.4) that the left kidney is obstructed.
The KB currently consists of approximately 60 heuristic rules. There are approximately as many rules to determine normality as there are for determining abnormality. These rules are grouped (knowledge islands) to perform 5 functions common for each kidney. The 5 knowledge islands perform the following functions for each kidney: (i) consider if furosemide needs to be administered to exclude obstruction, (ii) consider if furosemide does not need to be administered to exclude obstruction, (iii) consider if the kidney is obstructed, (iv) consider if kidney is not obstructed, and (v) consider if meta rules for obstruction apply. Meta rules are rules that are only considered after all of the other rules have been considered. A sample set of rules is listed in Appendix B. These rules were modified using data from the pilot group to optimize the agreement between the human experts and RENEX.
Inference Engine.
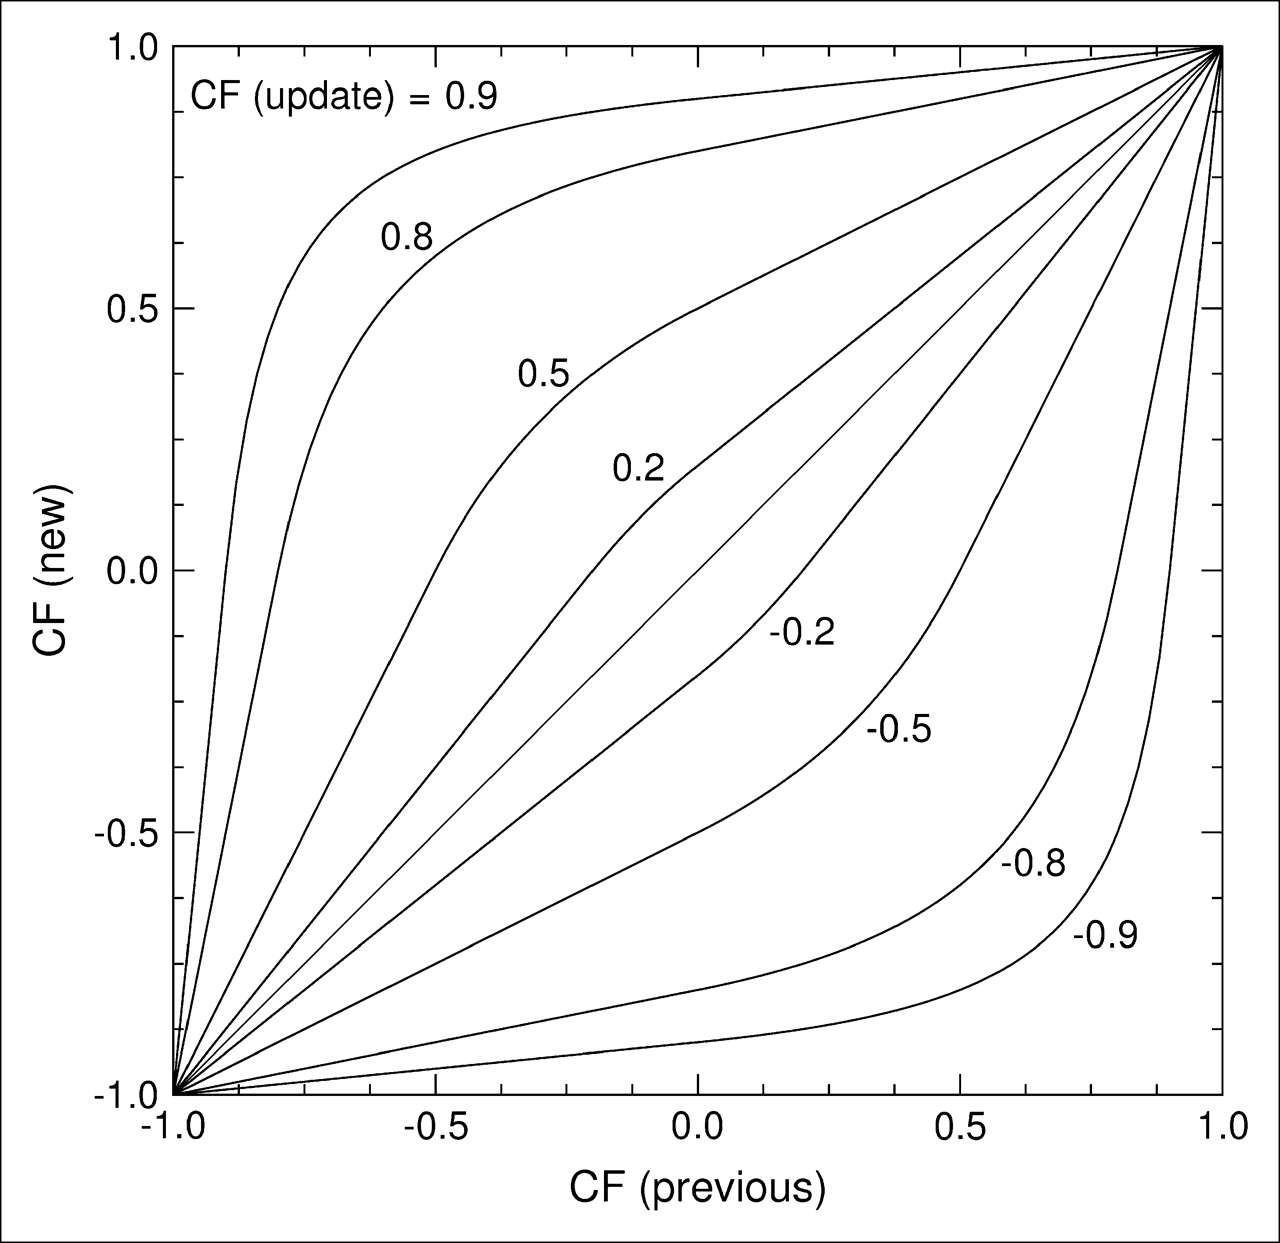
The inference engine is a computer algorithm that uses specific equations to combine the certainty that a parameter (or parameters) is abnormal with the certainty of a rule to modify the certainty that a hypothesis is true (a parameter is abnormal or a kidney is abnormal). These equations, known as combinatories are based on approximations of Bayes theorem as developed at Stanford by Shortliffe (12) for the MYCIN program. The approach uses 2 types of equations: (i) to infer positive evidence that a hypothesis is true and (ii) to infer negative evidence that a hypothesis is true. This is mathematically analogous to applying Bayes theorem to determine the posttest likelihood of disease based on the pretest likelihood, the sensitivity or specificity of the test, and whether the test was positive or negative (Fig. 4).

Plot of how CF values are modified as production rules are fired. This graph shows a family of CF (update) curves that assign a new CF value (CF (new)) to a variable depending on the previous CF of the variable (CF (previous)), the product of the CF of the rule's premise, and the CF of the rule's action (CF (update)) and whether the evidence being asserted is positive (above the identity line) or negative (below the identity line).
The specific set of equations used to combine the CFs are shown in Appendix C. When the inference engine starts execution, the CF that the left kidney is obstructed is 0 or unknown. As production rules are asserted (fired) the CF that the left kidney is obstructed increases or decreases based on whether the rule is providing positive or negative evidence that the kidney is obstructed. After all of the pertinent rules are asserted (i.e., all rules whose antecedents are ≥0.2 fired), the resulting CF is the conclusion reached by the inference engine. Thus, if the final CF that the left kidney is obstructed is >0.2, the conclusion is that it is obstructed; if less than −0.2, that it is not obstructed; and if between −0.2 and +0.2, that it is equivocal.
As opposed to the approach previously used to develop PERFEX, where a commercial inference engine was used (Smart Elements; Brokat Inc.), RENEX inference engine was created totally in-house using the IDL (interactive data language) programming language (Research Systems, Inc.). This has the advantage of providing total control over how the system works.
Justification Engine.
The justification engine is a computer algorithm that keeps track of the order, rule, and CF values of all parameters at the time of firing, for all rules that are fired. This is used to justify any conclusion reached by RENEX by simply providing the history of how the conclusion was reached. The justification engine sequentially builds a list of the rules that are fired to reach each conclusion and simultaneously tracks the CF value of each variable as it dynamically changes. Once the conclusions are reached, they are reported in the form of a concatenated set of sentences stringing the conclusions together; moreover, the key words from each conclusion are underlined. If the diagnostician would like to see the justification for a specific conclusion, the diagnostician can click on key words and the program will provide the set of rules that led to the conclusion.
RESULTS
The results associated with this development include (i) the boundary conditions used to transform the quantitative parameters values to CF values to form the parameter knowledge library, (ii) the heuristic rules extracted from the domain expert and modified by the pilot group that formed the KB, (iii) the individual scoring of each of the 3 experts and how it compares with the output from RENEX, and (iv) analysis of the agreement between RENEX and the consensus reading of the 3 human experts in the pilot group as to whether kidneys were obstructed.
Figure 3 illustrates the boundary conditions and transformations for 4 typical quantitative parameters of renal obstruction to CF values. Appendix B lists a subset of the production rules used in the KB. Only partial lists are provided because of space considerations.
Table 1 lists the individual scores from each of the 3 experts, the consensus reading, and the CF concluded from RENEX as to whether each kidney was obstructed. Figure 5 illustrates the output of a conventional quantitative renography program from patient 12 from the list and compares it with RENEX's conclusion regarding obstruction.
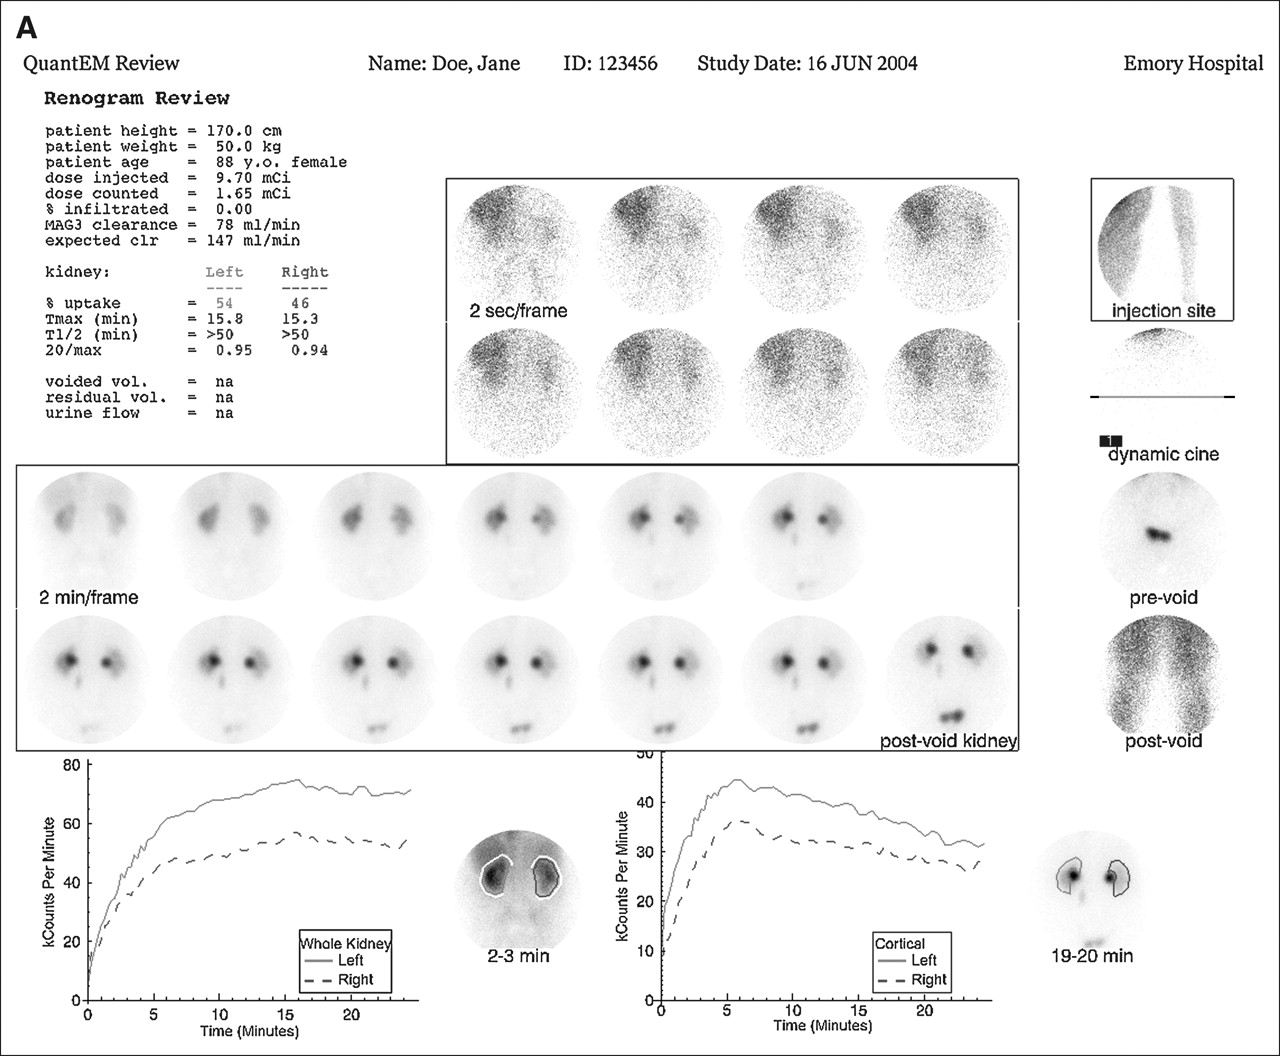
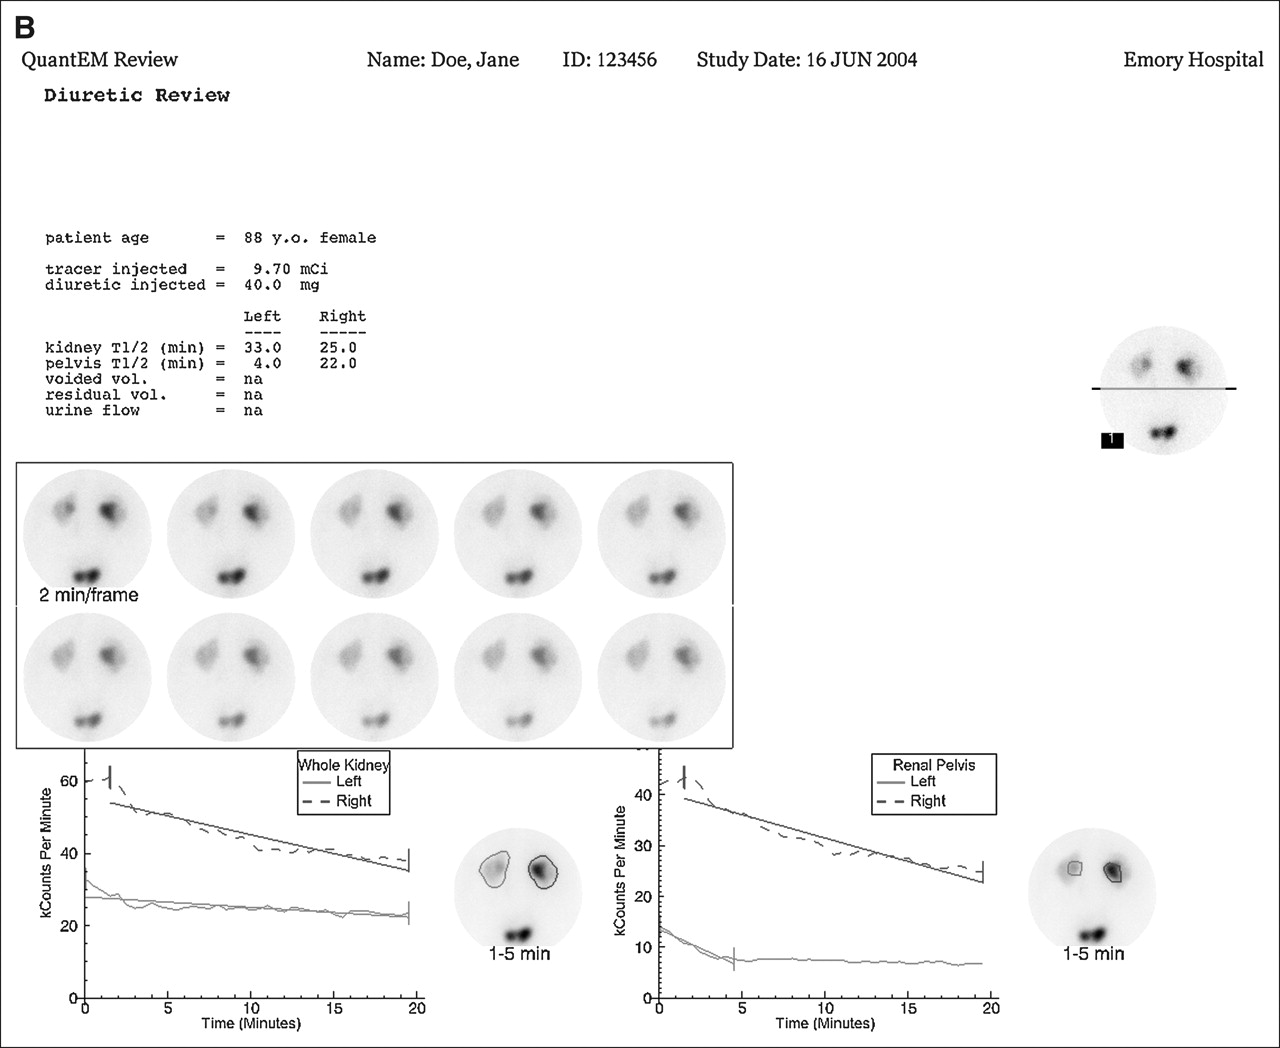
Output of QuantEM II quantification program for prefurosemide study (A) and postfurosemide study (B) of patient 12 from Table 1. (A) Display under Renogram Review shows demographic and quality control data as well as 99mTc-MAG3 clearance, expected 99mTc-MAG3 clearance, percentage uptake in each kidney, and Tmax (time to maximum counts), T1/2 (time to halfmaximum counts), and 20 min/max ratio (ratio of counts at 20 min to maximum counts) for whole-kidney ROI. The expression “na” indicates that the indicated urine parameters were not measured. Top center panel shows 2-s images of the initial bolus as it reaches the kidney. Top right panel is a quality control image showing the injection site. Just beneath the injection site image are frames for viewing a dynamic cine and pre- and postvoid bladder images. Center panel shows twelve 2-min images followed by a supine postvoid image of the kidneys. Bottom left panel shows whole-kidney ROIs and whole-kidney renogram curves, whereas bottom right panel shows cortical ROIs and cortical renogram curves. There was no infiltration; 99mTc-MAG3 clearance was reduced at 83 mL/min/1.73 m2 compared with an expected clearance of 147 mL/min/1.73 m2. There is essentially equal uptake in 2 kidneys; whole-kidney ROIs show that both kidneys have delayed time to peak values of approximately 15 min and prolonged T1/2 values of >50 min. Values for cortical ROIs (Expanded Review Page, not shown) demonstrate improvement in time to peak values (<6 min for both kidneys) but the T1/2 values are still >50 min. Delayed (18–24 min) and postvoid images show retention in renal pelvis of both kidneys. Because of reduced 99mTc-MAG3 clearance, bilateral pelvic retention, and prolonged whole-kidney and cortical T1/2 values, baseline imaging could not exclude obstruction in either kidney; consequently, 40 mg of furosemide were administered intravenously and additional imaging was performed (B). (B) In the Diuretic Review format, the top left panel indicates patient's age and dose of furosemide as well as T1/2 values for whole-kidney and pelvic ROIs. Dynamic cine images can be reviewed in the top right panel, whereas center panel presents 10 sequential 2-min images. The bottom left panel shows whole-kidney renogram curves and the bottom right panel shows pelvic renogram curves drawn around area of urine retention in each kidney. Visually, counts in the bladder decrease, indicating the presence of a bladder catheter. There is prompt drainage of the tracer from the left renal pelvis (T1/2 of 4 min) excluding obstruction; diffuse retention in left kidney reflects underlying impairment in renal function. RENEX agreed that left kidney was not obstructed with a CF value of −0.40. There is persistent retention in right renal pelvis with a prolonged pelvic T1/2 of 22 min. Because the kidneys had equal function (equal relative uptake, A), right kidney should have been able to drain as effectively as left kidney. The fact that right kidney shows persistent pelvic retention and drains much slower than left kidney indicates that right kidney is probably obstructed. RENEX agreed that right kidney was obstructed with a CF value of 0.42.
Individual and Consensus Scores from Human Experts Compared with RENEX's CF Values
Table 2 shows the agreement between RENEX and the consensus reading of the 3 human experts as to whether the kidneys were obstructed. RENEX agreed with the expert panel in 92% (12/13) of the obstructed kidneys, 93% (38/41) of the unobstructed kidneys, and 78% (7/9) of the kidneys interpreted as equivocal for obstructions. Note that in only 1 kidney did RENEX conclude a kidney was not obstructed when the experts thought it was obstructed. RENEX concluded 2 kidneys were obstructed when the experts agreed the kidneys were not obstructed.
Agreement Between RENEX and Human Experts
Processing time per patient was practically instantaneous using a 3.0-GHz personal computer programmed using IDL.
DISCUSSION
The primary goals of this study were (i) to use the expertise gained in PERFEX to develop a generalized methodology to aid in the interpretation of imaging studies using an expert system to analyze quantitative data extracted from imaging studies and (ii) to demonstrate proof-of-principle by applying this generalized methodology to develop a renal expert system (RENEX) for detecting renal obstruction using pre- and postfurosemide 99mTc-MAG3 renal scans. This approach consisted of developing (i) a parameter knowledge library with the list of the boundary conditions necessary for transforming the values of each quantitative parameter to a CF, (ii) a KB of heuristic rules used to reach conclusions regarding the image interpretation, (iii) an inference engine to combine the CFs of the rules and parameters, and (iv) a justification engine to offer the ability to justify the conclusions reached.
This method was applied to RENEX, a renal expert system for detecting renal obstruction using pre- and postfurosemide 99mTc-MAG3 renal scans. Because the goal of expert systems is to mimic the conclusions reached by domain experts, consensus reading of 3 experts was used as the gold standard to perform the validation. There was excellent agreement between RENEX and the consensus reading of 3 experts as to whether there was obstruction of the kidneys of the pilot group that was also used as a training set to develop RENEX. Clearly, although this agreement is encouraging, it does not validate the method since the results apply only to patients in the training set. Nevertheless, these results are encouraging and warrant a large prospective trial to validate the approach. To our knowledge, there are no computer-aided diagnostic tools to aid clinicians in the interpretation of renal scans to determine renal obstruction.
The 32 patient studies used as a training set were selected to try to challenge all branches of the decision tree. Our results yielded equivocal readings by our experts in 9 of 63 kidneys (14%). This number is artificially elevated based on our patient selection. By restricting our study to patients who received furosemide, we excluded several patients who were not obstructed and, thereby, increased the percentage of patients who had equivocal studies and who were obstructed.
As previously noted (8), we have preferred the expert system approach over that of the neural net approach because the heuristic rules that are used in expert systems to reach a conclusion may be traced and linked to each other, thereby providing a mechanism to justify or explain any conclusion reached. Neural nets, on the other hand, act as “black boxes” that do not provide justifications, although they are excellent for pattern-recognition tasks. Another disadvantage of neural net systems is the fact that they also require a much larger training dataset than expert systems to accomplish the same task.
There are equally compelling reasons for preferring knowledge-based approaches to case-based reasoning approaches. The main challenge is that a very large library of image cases would be required to create a sufficiently robust system, similar to the large data demands posed by neural network training. Also, accurate measures of image “similarity” would have to be developed to adapt the indexed cases to the patient case under consideration. Hence, knowledge captured as rules, coupled with the uncertainty reasoning model used by RENEX, provide an avenue to overcome these challenges while demonstrating a very quick processing time and providing a justification engine.
In their consensus report on diuresis renography, O'Reilly et al. (18) recommend tracer administration, 20 min of imaging, furosemide administration, and an additional 15 min of imaging (F + 20-min protocol). Many centers obtain these data as a continuous acquisition. We have used essentially the same protocol except that we acquire the baseline (initial 24 min) and postfurosemide (20 min) acquisitions separately. We have found that often the baseline images and curves can exclude obstruction and administration of furosemide is unnecessary. A continuous acquisition could easily be analyzed on the basis of the pre- and postfurosemide components and the rules of RENEX should still be applicable. We recognize that there are other acquisition protocols but our purpose was to show proof-of-principle of the expert system methodology using our standard protocol. We also recognize that standard acquisition and processing protocols help physicians and decision support systems alike develop a consistent, objective set of rules for interpreting the imaging studies. We have also found from our nuclear cardiology experience that once a successful decision support system is developed that depends on a strict acquisition and processing protocol, these protocols tend to be accepted as standards in the field for the decision support system to be used by a large number of institutions.
We are continuing to investigate how to further improve the diagnostic performance of RENEX. One approach is to add heuristic rules that use the patients' clinical information routinely available to physicians. We are also investigating the use of data mining techniques to automatically find associations between the quantitative results, the clinical variables, and the results of the gold-standard. These associations may be used as heuristic rules to enhance the expert system (19).
CONCLUSION
We have developed a generalized methodology to aid in the interpretation of imaging studies using an expert system to analyze quantitative data extracted from these studies and demonstrated proof-of-principle by applying this generalized methodology to a renal expert system (RENEX) for detecting renal obstruction using pre- and postfurosemide 99mTc-MAG3 renal scans with excellent results. These encouraging preliminary results warrant a prospective study in a large population of patients with and without renal obstruction to establish the diagnostic performance of this system.
APPENDIX A
FUNCTION TO TRANSFORM QUANTITATIVE PARAMETERS TO CERTAINTY FACTORS
The input to this function is the quantitative value of the parameter (p) to be transformed to a CF and the 5 boundary conditions for that parameter as defined in Figure 2. These 5 boundary conditions are values when the quantitative parameter is definitely normal, probably normal, equivocal, probably abnormal, and definitely abnormal. Let:
p = quantitative parameter to be transformed into a CF
b = p − equivocal value
aL = definitely normal value − equivocal value
bL = probably normal value − equivocal value
bH = probably abnormal value − equivocal value
aH = definitely abnormal value − equivocal value
kL = 0.2/((bL − aL)/2 aL)2
kH = 0.2/((bH − aH)/2 aH)2
Assuming a quantitative parameter that increases as the parameter becomes abnormal*, the CF values (CF) for each of the zones in Figure 2 are given by:
CF(b) = −1, p ≤ definitely normal value (zone 1)
CF(b) = 4 kL [(b − aL)/2 aL]2 − 1, definitely normal value < p ≤ probably normal value (zone 2)
CF(b) = −0.2b/bL, probably normal value < p < equivocal value (zone 3)
CF(b) = 0.2b/bH, equivocal value < p < probably abnormal value (zone 4)
CF(b) = 1 − 4 kH [(b – aH)/2 aH]2, probably abnormal value ≤ p < definitely abnormal value (zone 5)
CF(b) = +1, p ≥ definitely abnormal value (zone 6)
APPENDIX B
SAMPLE RULES
If the time to half peak of the left kidney pelvis after a furosemide renogram is abnormal, then there is strong positive evidence (CF = 0.4) that the left kidney is obstructed.
If the ratio of counts in the left kidney during the first 1-min interval of the postfurosemide renogram to the maximum counts of the left kidney baseline renogram is abnormal and the time to half peak of the left kidney pelvis postfurosemide renogram is also abnormal, then there is strong positive evidence (CF = 0.4) that the left kidney is obstructed.
If the ratio of counts in the left kidney on the postfurosemide renogram postvoid 1-min image to the counts in the baseline renogram during the 1- to 2-min interval is normal, then there is very strong negative evidence (CF = −0.8) that the left kidney is obstructed.
If the left kidney is obstructed and the left kidney baseline 99mTc-MAG3 clearance is very abnormal, then it is equivocal (CF = 0) that the left kidney is obstructed. (example of a meta rule)
APPENDIX C
RULES FOR COMBINING CERTAINTY FACTORS (CF)
-
Certainty of premise (IF) for combining 2 pieces of evidence S1 and S2.

-
Certainty of a parameter [CF(update)] determined after taking a single action (THEN) based on a premise (IF)
CF(update) may be thought as the new evidence that a hypothesis is true (or false) and will be used to modify the previous CF value of a hypothesis (or parameter). -
Certainty of a parameter [CF(new)] after modifying the previous certainty [CF(previous)] with the certainty of a single action [CF(update)]
A. If both CF(update) and CF(previous) are >0:
B. If either CF < 0 but not both:
C. If both CFs are negative:


Acknowledgments
This work was funded in part by National Library of Medicine grant R01-LM007595. Some of the authors (E.V.G., R.H., R.D.F., A.T.) receive royalties from the sale of the application software QuantEM related to the research described in this article. The terms of this arrangement have been reviewed and approved by Emory University in accordance with its conflict-of-interest practice.
Footnotes
↵* For quantitative parameters that decrease as the function becomes abnormal, the same equations are used except that the boundary conditions are reversed in order.
References
- Received for publication August 4, 2005.
- Accepted for publication October 31, 2005.


Jump to section
Related Articles
Cited By...
- Receiver-Operating-Characteristic Analysis of an Automated Program for Analyzing Striatal Uptake of 123I-Ioflupane SPECT Images: Calibration Using Visual Reads
- Development of a Relational Database to Capture and Merge Clinical History with the Quantitative Results of Radionuclide Renography
- Automated Patient Motion Detection and Correction in Dynamic Renal Scintigraphy
- Decision support systems for clinical radiological practice -- towards the next generation
- Diagnostic Performance of an Expert System for Interpretation of 99mTc MAG3 Scans in Suspected Renal Obstruction
- Optimized, Automated Striatal Uptake Analysis Applied to SPECT Brain Scans of Parkinson's Disease Patients
- A Software Engine to Justify the Conclusions of an Expert System for Detecting Renal Obstruction on 99mTc-MAG3 Scans
- Being Right for the Right Reason: Better Than Just Being Right?
- Development and Prospective Evaluation of an Automated Software System for Quality Control of Quantitative 99mTc-MAG3 Renal Studies
- Reply: an expert system for the detection of renal obstruction.
- An Expert System for the Detection of Renal Obstruction