
Main menu

  • Home
  • Content
    • Current
    • Ahead of print
    • Past Issues
    • JNM Supplement
    • SNMMI Annual Meeting Abstracts
    • Continuing Education
    • JNM Podcasts
  • Subscriptions
    • Subscribers
    • Institutional and Non-member
    • Rates
    • Journal Claims
    • Corporate & Special Sales
  • Authors
    • Submit to JNM
    • Information for Authors
    • Assignment of Copyright
    • AQARA requirements
  • Info
    • Reviewers
    • Permissions
    • Advertisers
  • About
    • About Us
    • Editorial Board
    • Contact Information
  • More
    • Alerts
    • Feedback
    • Help
    • SNMMI Journals
  • SNMMI
    • JNM
    • JNMT
    • SNMMI Journals
    • SNMMI

User menu

  • Subscribe
  • My alerts
  • Log in
  • My Cart

Search

  • Advanced search
Journal of Nuclear Medicine
  • SNMMI
    • JNM
    • JNMT
    • SNMMI Journals
    • SNMMI
  • Subscribe
  • My alerts
  • Log in
  • My Cart
Journal of Nuclear Medicine

Advanced Search

  • Home
  • Content
    • Current
    • Ahead of print
    • Past Issues
    • JNM Supplement
    • SNMMI Annual Meeting Abstracts
    • Continuing Education
    • JNM Podcasts
  • Subscriptions
    • Subscribers
    • Institutional and Non-member
    • Rates
    • Journal Claims
    • Corporate & Special Sales
  • Authors
    • Submit to JNM
    • Information for Authors
    • Assignment of Copyright
    • AQARA requirements
  • Info
    • Reviewers
    • Permissions
    • Advertisers
  • About
    • About Us
    • Editorial Board
    • Contact Information
  • More
    • Alerts
    • Feedback
    • Help
    • SNMMI Journals
  • View or Listen to JNM Podcast
  • Visit JNM on Facebook
  • Join JNM on LinkedIn
  • Follow JNM on Twitter
  • Subscribe to our RSS feeds
OtherClinical Investigations

11C-DTBZ and 18F-FDG PET Measures in Differentiating Dementias

Robert A. Koeppe, Sid Gilman, Aniket Joshi, Suyu Liu, Roderick Little, Larry Junck, Mary Heumann, Kirk A. Frey and Roger L. Albin
Journal of Nuclear Medicine June 2005, 46 (6) 936-944;
Robert A. Koeppe
  • Find this author on Google Scholar
  • Find this author on PubMed
  • Search for this author on this site
Sid Gilman
  • Find this author on Google Scholar
  • Find this author on PubMed
  • Search for this author on this site
Aniket Joshi
  • Find this author on Google Scholar
  • Find this author on PubMed
  • Search for this author on this site
Suyu Liu
  • Find this author on Google Scholar
  • Find this author on PubMed
  • Search for this author on this site
Roderick Little
  • Find this author on Google Scholar
  • Find this author on PubMed
  • Search for this author on this site
Larry Junck
  • Find this author on Google Scholar
  • Find this author on PubMed
  • Search for this author on this site
Mary Heumann
  • Find this author on Google Scholar
  • Find this author on PubMed
  • Search for this author on this site
Kirk A. Frey
  • Find this author on Google Scholar
  • Find this author on PubMed
  • Search for this author on this site
Roger L. Albin
  • Find this author on Google Scholar
  • Find this author on PubMed
  • Search for this author on this site
  • Article
  • Figures & Data
  • Info & Metrics
  • PDF
Loading

Article Figures & Data

Figures

  • Tables
  • FIGURE 1.
    • Download figure
    • Open in new tab
    • Download powerpoint
    FIGURE 1.

    11C-DTBZ K1 and 18F-FDG images at 3 brain levels for one representative subject from each group. All images are normalized to cerebellar vermis.
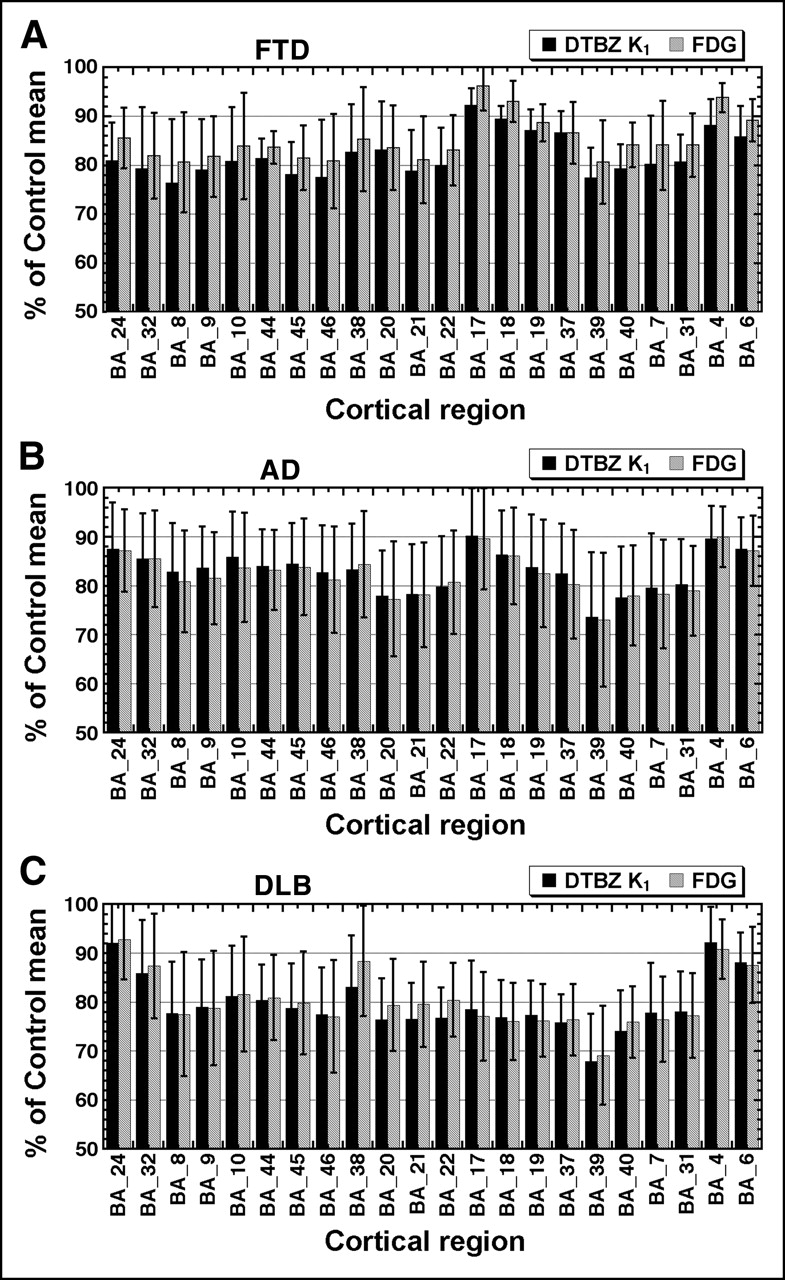
  • FIGURE 2.
    • Download figure
    • Open in new tab
    • Download powerpoint
    FIGURE 2.

    Group average deficits of 11C-DTBZ K1 (solid bars) and 18F-FDG (hatched bars) relative to NC for 22 cortical regions. Shown are mean and SD for FTD (A; n = 7), AD (B; n = 25), and DLB (C; n = 20) expressed as a percentage of NC (n = 19) mean. All values are normalized to cerebellar vermis.
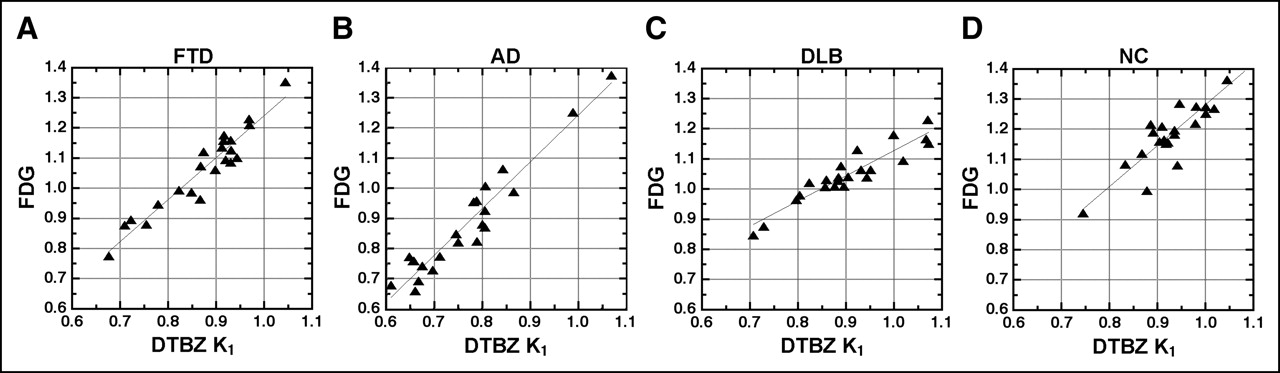
  • FIGURE 3.
    • Download figure
    • Open in new tab
    • Download powerpoint
    FIGURE 3.

    Correlations between 18F-FDG and 11C-DTBZ K1 across 22 cortical regions for selected individuals from each diagnostic group. Both 18F-FDG and K1 values are normalized to cerebellar vermis. The subject selected from each group was the individual having a correlation coefficient closest to the group average (Table 1, column 2). Correlation coefficients are 0.953, 0.945, 0.919, and 0.887 for the selected FTD (A), AD (B), DLB (C), and NC (D) subjects, respectively.
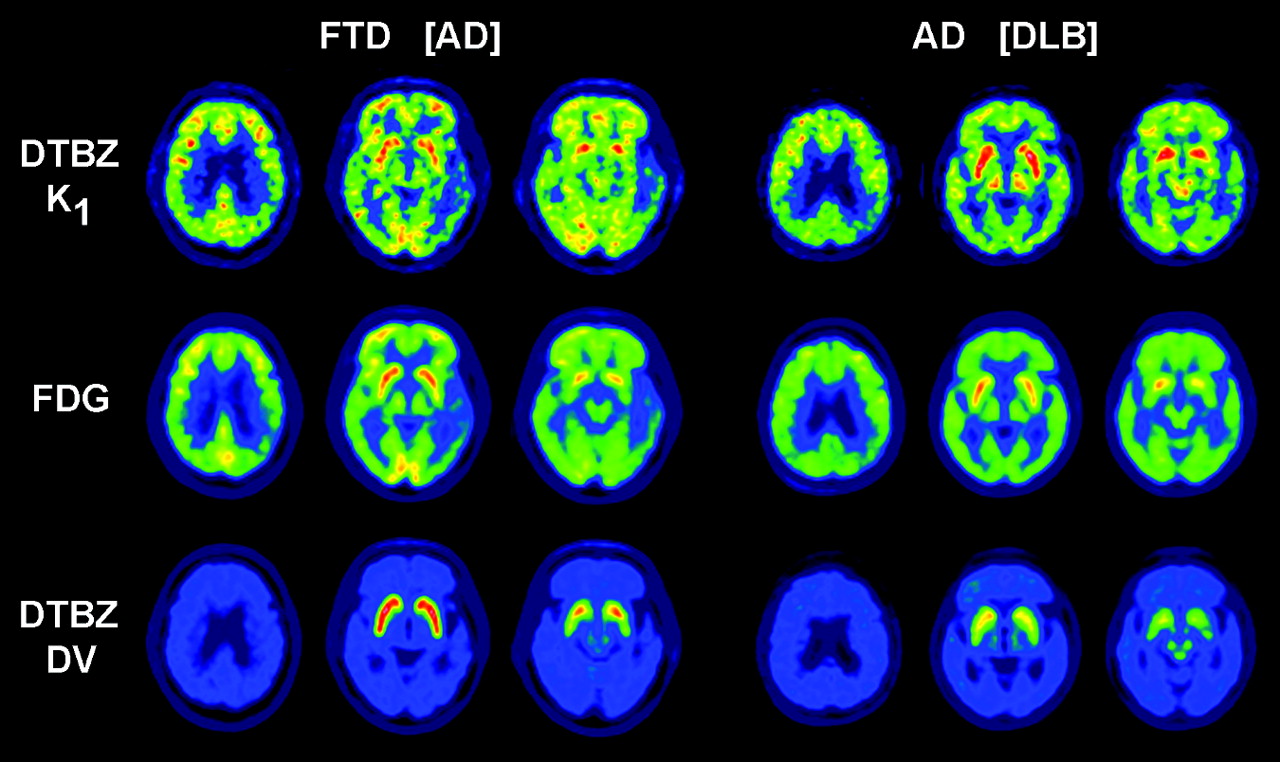
  • FIGURE 4.
    • Download figure
    • Open in new tab
    • Download powerpoint
    FIGURE 4.

    Discrepancies between clinical and PET diagnoses. Shown are 11C-DTBZ K1, 18F-FDG, and 11C-DTBZ DV images at 3 brain levels for 2 subjects whose clinical diagnosis at time of PET was different than classifications by both logistic regression and all physician ratings. Clinical diagnosis at time of scan is given first, followed by PET classification in brackets.

Tables

  • Figures
    • View popup
    TABLE 1

    Within-Subject Correlations Across 22 Cortical Regions

    Groupn18F-FDG vs. 11C-DTBZ K118F-FDG vs. 11C-DTBZ DV11C-DTBZ K1 vs. 11C-DTBZ DV
    FTD70.947 ± 0.0240.08 ± 0.220.20 ± 0.24
    AD250.944 ± 0.0380.28 ± 0.300.34 ± 0.29
    DLB200.922 ± 0.0370.49 ± 0.220.51 ± 0.22
    NC190.893 ± 0.0420.23 ± 0.280.34 ± 0.26
    All710.924 ± 0.0430.31 ± 0.270.37 ± 0.26
    • Values are mean ± SD of Pearson correlation coefficients (r) for each group.

    • View popup
    TABLE 2

    Between-Subject Correlations Across 22 Cortical Regions

    CorrelationCorrelation parameterMean ± SD
    Same-parameter18F-FDG vs. 18F-FDG0.61 ± 0.22
    Same-parameter11C-DTBZ K1 vs. 11C-DTBZ K10.59 ± 0.23
        Between-parameters18F-FDG vs. 11C-DTBZ K10.58 ± 0.22
    Same-parameter11C-DTBZ DV vs. 11C-DTBZ DV0.29 ± 0.41
        Between-parameters11C-DTBZ DV vs. 18F-FDG0.03 ± 0.32
        Between-parameters11C-DTBZ DV vs. 11C-DTBZ K10.06 ± 0.32
    • Values are mean ± SD of Pearson correlation coefficients (r) for all possible between-subject combinations (71!/[69! × 2!] for same-parameter correlations; 71!/69! for between-parameter correlations).

    • View popup
    TABLE 3

    Classification by Logistic Regression

    ClassificationPET parameterDiscriminating variable*Odds ratio†P value‡Sensitivity§ (%)Specificity§ (%)
    FTD/AD/DLB vs. NCK1BA40 K10.81<0.000190.484.2
    18F-FDGBA40 18F-FDG0.720.000592.378.9
    K1+DV‖BA40 K10.810.000288.584.2
    DV0.990.396
    18F-FDG+DVBA40 18F-FDG0.720.001290.478.9
    DV1.000.881
    AD/DLB vs. FTDK1BA24–BA31 K11.130.011673.357.1
    18F-FDGBA24–BA31 18F-FDG1.140.008777.871.4
    K1+DVBA24–BA31 K11.140.032073.357.1
    DV0.990.286
    18F-FDG+DVBA24–BA31 18F-FDG1.120.028268.957.1
    DV0.990.345
    DLB vs. ADK1BA24–BA17 K11.120.000770.076.0
    18F-FDGBA24–BA17 18F-FDG1.280.002085.084.0
    K1+DVBA24–BA17 K11.150.31190.096.0
    DV0.840.178
    18F-FDG+DVBA24–BA17 18F-FDG1.040.73790.096.0
    DV0.830.159
    • ↵* BA(s) that provided best discrimination for each given test.

    • ↵† An increase of 0.01 in the discriminating variable multiplies the odds of being in the first of the 2 comparison groups by this factor. A value of 1.0 corresponds to lack of discrimination. The magnitude of deviation from 1.0 is a measure of the ability of variable to discriminate the 2 groups.

    • ↵‡ P value for a test of null hypothesis that odds ratio of the discriminating variable is 1.0.

    • ↵§ Sensitivity and specificity are based on cross-validation—that is, when each case is classified, logistic regression is recomputed with that case excluded.

    • ↵‖ DV is bilateral average of 11C-DTBZ VMAT2 binding measures in putamen.

PreviousNext
Back to top

In this issue

Journal of Nuclear Medicine: 46 (6)
Journal of Nuclear Medicine
Vol. 46, Issue 6
June 1, 2005
  • Table of Contents
  • About the Cover
  • Index by author
Print
Download PDF
Article Alerts
Sign In to Email Alerts with your Email Address
Email Article

Thank you for your interest in spreading the word on Journal of Nuclear Medicine.

NOTE: We only request your email address so that the person you are recommending the page to knows that you wanted them to see it, and that it is not junk mail. We do not capture any email address.

Enter multiple addresses on separate lines or separate them with commas.
11C-DTBZ and 18F-FDG PET Measures in Differentiating Dementias
(Your Name) has sent you a message from Journal of Nuclear Medicine
(Your Name) thought you would like to see the Journal of Nuclear Medicine web site.
Citation Tools
11C-DTBZ and 18F-FDG PET Measures in Differentiating Dementias
Robert A. Koeppe, Sid Gilman, Aniket Joshi, Suyu Liu, Roderick Little, Larry Junck, Mary Heumann, Kirk A. Frey, Roger L. Albin
Journal of Nuclear Medicine Jun 2005, 46 (6) 936-944;

Citation Manager Formats

  • BibTeX
  • Bookends
  • EasyBib
  • EndNote (tagged)
  • EndNote 8 (xml)
  • Medlars
  • Mendeley
  • Papers
  • RefWorks Tagged
  • Ref Manager
  • RIS
  • Zotero
Share
11C-DTBZ and 18F-FDG PET Measures in Differentiating Dementias
Robert A. Koeppe, Sid Gilman, Aniket Joshi, Suyu Liu, Roderick Little, Larry Junck, Mary Heumann, Kirk A. Frey, Roger L. Albin
Journal of Nuclear Medicine Jun 2005, 46 (6) 936-944;
Twitter logo Facebook logo LinkedIn logo Mendeley logo
  • Tweet Widget
  • Facebook Like
  • Google Plus One
Bookmark this article

Jump to section

  • Article
    • Abstract
    • MATERIALS AND METHODS
    • RESULTS
    • CONCLUSION
    • Acknowledgments
    • Footnotes
    • REFERENCES
  • Figures & Data
  • Info & Metrics
  • PDF

Related Articles

  • THIS MONTH IN JNM
  • PubMed
  • Google Scholar

Cited By...

  • Dual-Biomarker Imaging of Regional Cerebral Amyloid Load and Neuronal Activity in Dementia with PET and 11C-Labeled Pittsburgh Compound B
  • Early 11C-PIB Frames and 18F-FDG PET Measures Are Comparable: A Study Validated in a Cohort of AD and FTLD Patients
  • The 18F-FDG PET Cingulate Island Sign and Comparison to 123I-{beta}-CIT SPECT for Diagnosis of Dementia with Lewy Bodies
  • In Vivo Imaging of {beta}-Cell Mass in Rats Using 18F-FP-(+)-DTBZ: A Potential PET Ligand for Studying Diabetes Mellitus
  • Multicenter Standardized 18F-FDG PET Diagnosis of Mild Cognitive Impairment, Alzheimer's Disease, and Other Dementias
  • Evaluation of the Metabotropic Glutamate Receptor Subtype 5 Using PET and 11C-ABP688: Assessment of Methods
  • Google Scholar

More in this TOC Section

  • Feasibility of Ultra-Low-Activity 18F-FDG PET/CT Imaging Using a Long–Axial-Field-of-View PET/CT System
  • Cardiac Presynaptic Sympathetic Nervous Function Evaluated by Cardiac PET in Patients with Chronotropic Incompetence Without Heart Failure
  • Validation and Evaluation of a Vendor-Provided Head Motion Correction Algorithm on the uMI Panorama PET/CT System
Show more Clinical Investigations

Similar Articles

SNMMI

© 2025 SNMMI

Powered by HighWire