


Abstract
This multicenter study examined 18F-FDG PET measures in the differential diagnosis of Alzheimer's disease (AD), frontotemporal dementia (FTD), and dementia with Lewy bodies (DLB) from normal aging and from each other and the relation of disease-specific patterns to mild cognitive impairment (MCI). Methods: We examined the 18F-FDG PET scans of 548 subjects, including 110 healthy elderly individuals (“normals” or NLs), 114 MCI, 199 AD, 98 FTD, and 27 DLB patients, collected at 7 participating centers. Individual PET scans were Z scored using automated voxel-based comparison with generation of disease-specific patterns of cortical and hippocampal 18F-FDG uptake that were then applied to characterize MCI. Results: Standardized disease-specific PET patterns were developed that correctly classified 95% AD, 92% DLB, 94% FTD, and 94% NL. MCI patients showed primarily posterior cingulate cortex and hippocampal hypometabolism (81%), whereas neocortical abnormalities varied according to neuropsychological profiles. An AD PET pattern was observed in 79% MCI with deficits in multiple cognitive domains and 31% amnesic MCI. 18F-FDG PET heterogeneity in MCI with nonmemory deficits ranged from absent hypometabolism to FTD and DLB PET patterns. Conclusion: Standardized automated analysis of 18F-FDG PET scans may provide an objective and sensitive support to the clinical diagnosis in early dementia.
- 18F-FDG PET
- Alzheimer's disease
- frontotemporal dementia
- Lewy body dementia
- mild cognitive impairment
- normal aging
- hippocampus
PET of the cerebral metabolic rate of glucose (CMRglc) is increasingly used to support the clinical diagnosis in the examination of patients with suspected major neurodegenerative disorders, such as Alzheimer's disease (AD), dementia with Lewy bodies (DLB), and frontotemporal dementia (FTD). AD accounts for 50%–60% of cases of dementia; DLB and FTD account for approximately 15%–25% of cases (1). As the incidence of these disorders is expected to increase dramatically as the baby-boomer generation ages, accurate diagnosis is extremely important—particularly at the early and mild stages of dementia when treatment effects would be most effective. Increasing attention has been devoted to patients with mild cognitive impairment (MCI), which is considered a prodromal condition to dementia (1,2). MCI patients demonstrate a decline of cognitive performance that is more pronounced than expected by age but is not severe enough to meet criteria for dementia (2), and the clinical course of these patients is challenging to forecast on the basis of clinical measures alone.
18F-FDG PET has been proposed as a suitable modality to support the early and differential diagnosis of dementia (3). By the time a patient presents with clinical symptoms of dementia, CMRglc reductions have occurred that are detectable on 18F-FDG PET scans as specific patterns of regional hypometabolism as compared with age-matched healthy elderly individuals (“normals” or NLs). AD patients typically show hypometabolism in the posterior cingulate and parietotemporal cortices and in the frontal lobes in advanced disease (4). In contrast, FTD patients present with prominent hypometabolism of the frontal and anterior temporal cortices (5–7), whereas DLB patients show posterior brain hypometabolism involving primarily the parietooccipital regions (8,9). There is evidence that the medial temporal lobes—particularly the hippocampus (HIP)—are also severely hypometabolic in AD (10–14) as well as in presymptomatic early-onset familial AD (15). To our knowledge, there are currently no 18F-FDG PET studies that examined the HIP in FTD and DLB as compared with AD.
Although relatively uniform patterns of reduced 18F-FDG uptake are found in patients with full-blown dementia, there is interindividual overlap across dementing disorders and there are currently no established 18F-FDG PET criteria for preclinical dementia at the MCI stage. Most 18F-FDG PET studies of MCI have focused on patients with clear-cut memory deficits (i.e., amnesic MCI) that are at high risk for developing AD-type dementia (2). Amnesic MCI typically shows regional hypometabolism consistent with AD, although the magnitude of the reduction is milder than that in clinical AD patients (10,13,14,16–19). However, there is evidence for CMRglc heterogeneity even among amnesic MCI patients (20), and several MCI patients do not have amnesic symptoms (1). The few 18F-FDG PET and SPECT studies that included nonamnesic MCI patients provide evidence for a high variability of CMRglc reductions (11–14,21). Most MCI studies have performed a statistical comparison of groups, rather than examination of individual cases, which hinders detection of distinctive features, limiting the diagnostic use of 18F-FDG PET. Moreover, to our knowledge, there are no 18F-FDG PET studies comparing MCI with dementing disorders other than AD.
The objective of the present multicenter 18F-FDG PET study of 548 subjects, including 110 NLs and 114 MCI, 199 AD, 98 FTD, and 27 DLB patients, was to test whether regional CMRglc reductions could distinguish different dementing disorders and MCI from each other and from normal aging through the development of uniform diagnostic criteria using a standardized, automated voxel-based analysis.
MATERIALS AND METHODS
Subjects
The study comprises 548 subjects, including 110 NLs and 114 MCI, 199 AD, 98 FTD, and 27 DLB patients recruited at 7 participating centers (Table 1). All centers used comparable criteria for the definition of normality and for the diagnosis of dementia and used common standardized 18F-FDG PET acquisition protocols. All participants or caregivers provided written informed consent and were studied under guidelines approved by the Institutional Review Boards, local ethics committees, and radiation protection authorities at each participating center. All subjects underwent thorough clinical examinations, including a medical history corroborated by a close informant, neurologic and psychiatric examination, routine blood analysis, CT or MRI, and neuropsychological examinations. None of the subjects had Hachinski ischemia scores > 4 or met National Institute of Neurological Disorders and Stroke/Association Internationale pour la Recherche et l'Enseignement en Neurosciences (AIREN) criteria for vascular dementia (22), any evidence of organic brain pathology or organic illness affecting the brain, significant head injury sustained in the past, systemic illnesses or major medical complications, psychoses (including major depression), history of drug or alcohol dependence, or were taking psychoactive medications.
Clinical Characteristics of Subjects
Normality
Normal elderly (NL) control subjects had no evidence of functional impairment based on intensive interviews, a structured clinical interview resulting in Clinical Dementia Rating (CDR) = 0 or Global Deterioration Scale (GDS) ≤ 2, and a Mini Mental State Examination (MMSE) score ≥ 28.
MCI
The diagnosis of MCI was based on a clinician interview reporting evidence for reduced cognitive capacity from a prior level of functioning, normal activities of daily living (ADL), normal general intelligence, no dementia, CDR = 0.5 or GDS = 3, and MMSE ≥ 24. The MCI diagnosis was supported by the patient's subjective memory complaints and testimony from a knowledgeable collateral source. Fixed cutoff scores on neuropsychological testing were not used for the clinical diagnosis of MCI.
Dementing Disorders
All subjects fulfilled Diagnostic and Statistical Manual of Mental Disorders (DSM-IV) (23), criteria for dementia, showed significant ADL deficits, had deficits in 2 or more cognitive domains, and had CDR ≥ 1 or GDS ≥ 4. Standardized clinical diagnostic criteria were used to characterize the type of dementia. Criteria of the National Institute of Neurological and Communicative Diseases and Stroke/Alzheimer's Disease and Related Disorders Association (24) were used for the diagnosis of probable AD, as were consensus criteria used for the diagnosis of DLB (25) and FTD (26). The FTD group included patients with the so-called “frontal variant” of FTD (26). Patients with a diagnosis of semantic dementia or primary progressive aphasia were not included. As 18F-FDG PET measures were the outcome measure in this study, 18F-FDG PET findings were not used as inclusion or exclusion criteria.
All subjects received the MMSE, the Neuropsychiatry Inventory (NPI), and neuropsychological tests measuring verbal memory (i.e., Buschke's selective reminding test, delayed recall of paired associates, or the Wechsler memory scale), spatial memory (i.e., Rey's Complex Figure or the Designs test), attention (Trail Making test [TMT] or digit symbol substitution test [DSST]), and language (Phonemic Fluency or object naming tests) (27,28). The neuropsychological scores of each subject were Z scored relative to the appropriate age- and education-matched normative reference values at each institution. Z scores were used to classify MCI patients on the basis of their neuropsychological profile as “amnesic” (isolated memory deficits with Z ≥ 1.5 SD below norms) or “nonamnesic,” which includes “single-nonmemory-domain” MCI ([sMCI] Z ≥ 1.5 SD below norms in 1 cognitive domain other than memory) and “multiple-cognitive-domains” MCI ([mMCI] Z ≥ 1.5 SD below norms in at least 2 cognitive domains) (29). Patients with dementia were classified as mild or moderate-to-severe on the basis of either clinical ratings (mild: CDR = 1 or GDS = 4; moderate-to-severe: CDR ≥ 2 or GDS ≥ 5) or the MMSE (mild: MMSE ≥ 24, moderate-to-severe: MMSE < 24).
Two hundred twenty-five subjects were recruited within the European Network for Efficiency and Standardization of Dementia Diagnosis, and most of them have been included in a previous diagnostic study using different analytic methods (28).
18F-FDG PET
Acquisition.
Subjects were examined at 7 centers using standardized PET protocols (28). Studies were done in a resting state with eyes closed and ears unplugged after intravenous injection of 110–370 MBq 18F-FDG. The required minimum time interval between injection and beginning the scan was 30 min. On average, scans were started 40 min after injection and the scan duration was 20 min. Images were reconstructed using filtered backprojection including correction for attenuation (measured by transmission scan) and scatter using standard software as supplied by scanner manufacturers, as described (28). Two pairs of centers used the same scanner type. This resulted in 5 PET scanners that differed with respect to field of view (FOV) and spatial resolution (Table 2).
Overview of Participating Centers, Equipment, and Included Cases
Image Analysis.
18F-FDG PET scans were transferred to a Sun workstation (Sun Microsystems Inc.) and processed at New York University using the Neurological Statistical Image Analysis (Neurostat; University of Washington) standard diagnostic routine (30,31). All scans were realigned to the anterior–posterior commissure line and spatially normalized to the Talairach and Tournoux atlas (32) using an affine transformation with 12 parameters, which was followed by nonlinear warping, yielding a standardized image set with 2.25-mm voxels (31). The spatially normalized 18F-FDG PET scan of each subject was compared with a normative reference database generated from the 18F-FDG PET scans of an additional 55 longitudinally confirmed NL individuals that retained the diagnosis of NL for 4 ± 1 y (details on the normative database are published (33)). Each scan was compared with the NL database controlling for the global activity using Neurostat scaling procedures, and Z scores (Z = [meansubject − meandatabase]/SDdatabase) were calculated voxel by voxel at a threshold of P ≤ 0.01 (1-sided) corresponding to Z ≥ 2.33 (19,33,34). High Z scores are indicative of reduced 18F-FDG uptake in the patient relative to the control mean. Three-dimensional stereotactic surface projections (3D-SSPs) of the Z scores were then generated to allow visualization of 18F-FDG uptake abnormalities and examine the extent and topography of hypometabolism (30,31).
3D-SSP maps do not enable specific examination of the HIP. Our newly developed tool for automated region of interest (ROI) sampling on PET (13) was used in addition to Neurostat to examine the HIP and other AD-related regions. The method was originally developed for the HIP and allows one to use a probabilistic masking image of the HIP that samples only those portions of the HIP where the overlap across subjects is maximal after intersubject averaging (13,35). The procedure was validated against manual MRI-guided HIP ROIs and showed equivalent CMRglc estimates in NL, MCI, and AD subjects (13). In addition to the HIP, a predefined set of 6 bilateral cortical ROIs was used to sample the inferior parietal lobe (IPL), lateral temporal lobe (LTL), posterior cingulate cortex (PCC), prefrontal cortex (PFC), occipital cortex (OCC), and the sensorimotor cortex (S-M) (36). ROI 18F-FDG uptake of each subject was Z scored relative to the NL database. Moreover, standardized ROIs for the same brain regions were applied to 3D-SSP maps to derive mean Z scores (SD) relative to the NL database (33). ROI data were used to examine the reliability of multicenter 18F-FDG PET assessments (see Supplemental Appendix; supplemental materials are available online only at http://jnm.snmjournals.org).
Statistical Analysis
SPSS (version 12.0) was used for data analyses. We first assessed the feasibility of combining 18F-FDG PET data across all centers to derive disease-specific PET patterns using a ROI approach (Supplemental Appendix). Second, after excluding the MCI patients, the whole dataset of NL, AD, FTD, and DLB patients, for a total of 434 subjects, was randomly divided into 2 groups—that is, training and testing cohorts—using an automated split-half procedure implemented in SPSS 12.0. This procedure created, for each center and for each clinical group, 2 equal-sized subgroups balanced for age, sex, and education. The training cohort was comprised of 219 subjects that included 56 NL, 100 AD, 49 FTD, and 14 DLB patients. The scans of the training cohort were used to develop 18F-FDG PET criteria for distinguishing across diagnostic groups. The testing cohort was comprised of 215 subjects that included 54 NL, 99 AD, 49 FTD, and 13 DLB patients, whose PET scans were used for independent validation of the estimated 18F-FDG PET diagnostic criteria.
Stepwise forward logistic regressions with χ2 tests were used to examine the cortical and hippocampal Z scores of the training cohort in distinguishing AD, DLB, and FTD from NL, from each other, and between mild and moderate-to-severe dementia subgroups, and to generate disease-specific PET patterns based on the combination of brain regions yielding the highest diagnostic accuracy. Disease-specific PET patterns were determined using a quantitative ROI approach using the multicenter ROI data (Supplemental Appendix), which served as a guide for qualitative regional examination of 3D-SSP maps in the training cohort. Each scan in the training cohort was classified as positive or negative for regional CMRglc abnormalities within specific brain regions. Classification was facilitated by detection of hypometabolic patterns exceeding the predefined Z score threshold within each ROI superimposed on the 3D-SSP maps (30,31). Logistic regressions were used to examine the pairwise classification accuracy of the diagnostic groups on the basis of PET findings. Thereafter, the reliability of the developed disease-specific PET patterns was examined by classifying each scan in the testing cohort as consistent with a disease-specific PET pattern (i.e., an NL PET pattern, an AD PET pattern, an FTD PET pattern, or a DLB PET pattern). Discriminant analysis was used to examine the overall percentage of correct classification accuracy of the 5 diagnostic groups.
Finally, 18F-FDG PET scans of the whole group of 114 MCI patients were inspected for the presence of a disease-specific PET pattern, and the results were compared across MCI subgroups using χ2 tests.
For all analyses, results were considered significant at P < 0.05.
RESULTS
Subjects
Characteristics of the subjects under study are found in Table 1. The AD group included 75 patients with mild dementia and 123 patients with moderate-to-severe dementia, the DLB group included 14 patients with mild dementia and 12 patients with moderate-to-severe dementia, and the FTD group included 57 patients with mild dementia and 41 patients with moderate-to-severe dementia. The MCI group included 78 amnesic MCI and 36 nonamnesic MCI patients. The group of nonamnesic MCI included 22 sMCI and 14 mMCI. All 14 mMCI patients had memory deficits in addition to impairment in other cognitive domains. The groups did not differ in terms of age, sex, and educational level. All dementia groups had lower MMSE scores than those of NL subjects (P values < 0.001) and MCI patients (P values < 0.01). Patients with moderate-to-severe dementia had lower MMSE scores than those with mild dementia for all clinical groups (P values < 0.01). No differences were found across MCI subtypes.
Development of Standardized Disease-Specific 18F-FDG PET Patterns
Group classification results are summarized in Supplemental Table 1.
Cortical Evaluations
In the training cohort, 55 of 56 (98%) NL subjects did not show cortical hypometabolism, and 1 subject showed hypometabolism restricted to the PCC. Among AD patients, 99 of 100 (99%) showed a pattern of prominent parietotemporal and PCC hypometabolism (Fig. 1), and 1 patient showed hypometabolism restricted to the PCC. Symmetric 18F-FDG uptake reductions were found in 84% AD, whereas 10% showed more severe hypometabolism in the left hemisphere and 6% showed more severe hypometabolism in the right hemisphere. Thirteen AD patients showed additional frontal hypometabolism—which extended to the occipital cortex in 5 patients—whose magnitude was comparable to or slightly lower than that in the parietotemporal and PCC regions. There was no difference in the proportion of AD correctly classified as a function of dementia severity, as 27 of 28 (96%) mild and 72 of 72 (100%) moderate-to-severe AD patients showed parietotemporal and PCC hypometabolism. The presence of additional frontal or occipital hypometabolism was slightly higher in moderate-to-severe AD (15%) than that in mild AD (7%) patients.
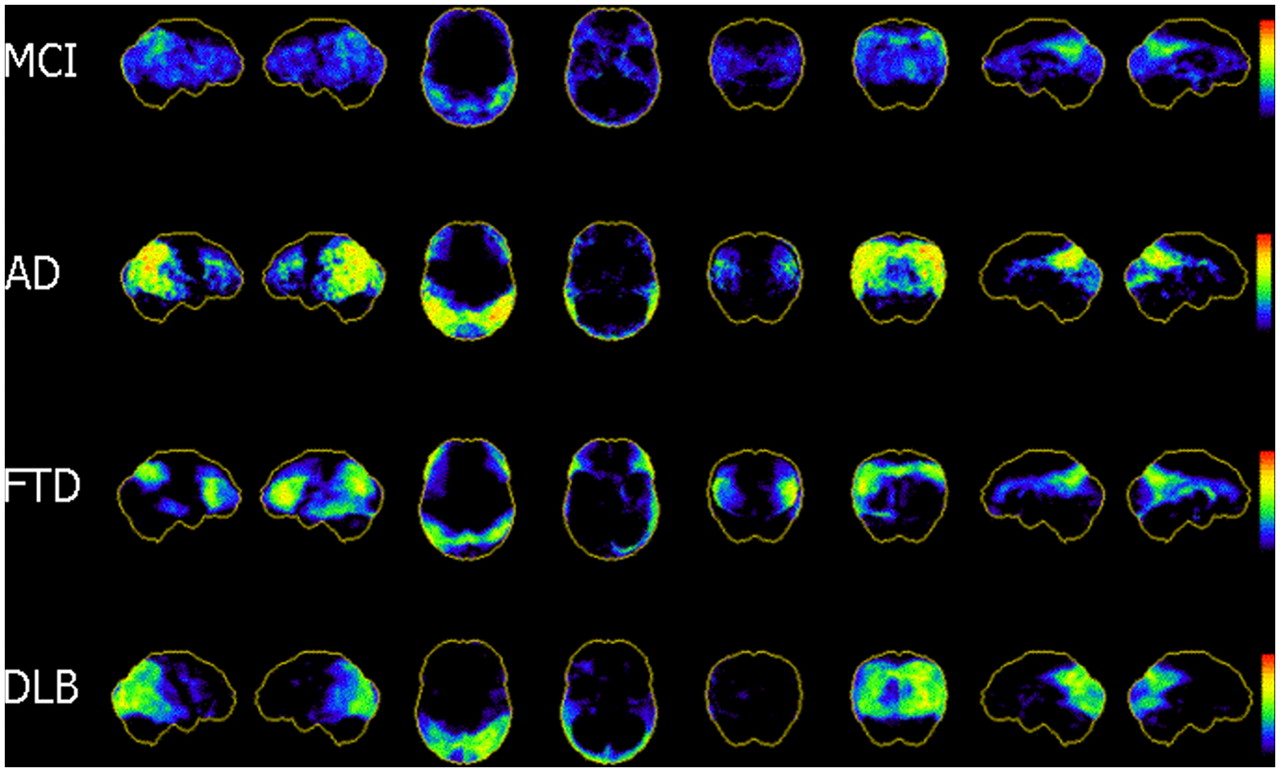
Representative cortical 18F-FDG PET patterns in NL, AD, DLB, and FTD. 3D-SSP maps and corresponding Z scores showing CMRglc reductions in clinical groups as compared with the NL database are displayed on a color-coded scale ranging from 0 (black) to 10 (red). From left to right: 3D-SSP maps are shown on the right and left lateral, superior and inferior, anterior and posterior, and right and left middle views of a standardized brain image.
Among DLB patients, 10 of 14 (71%) showed hypometabolism in the posterior brain regions preferentially involving the OCC (Fig. 1), which was accompanied by hypometabolism of the parietal cortex in 3 patients (21%) and of the PCC in 1 (7%) patient. The remaining 4 DLB patients showed additional parietotemporal and PCC hypometabolism whose magnitude was comparable to, or more severe than that of, the OCC, and were misclassified as AD. 18F-FDG uptake reductions were bilateral in 71% of the patients, more severe in the left hemisphere in 7%, and more severe in the right hemisphere in 21% of the patients. There was no asymmetry by PET pattern interaction. There was no difference in the proportion of patients correctly classified as a function of dementia severity, with 4 of 6 (67%) mild DLB patients and 6 of 8 (75%) moderate-to-severe DLB patients showing occipitoparietal hypometabolism.
Among FTD patients, 32 of 49 (65%) patients showed a pattern of prominent frontal or temporal hypometabolism (Fig. 1). The remaining 17 FTD patients showed either parietotemporal and PCC hypometabolism with no frontal hypometabolism or parietotemporal and PCC hypometabolism with frontal hypometabolism that was not more severe than that in the parietotemporal and PCC regions, and were misclassified as AD. 18F-FDG uptake reductions were bilateral in 53% of the patients, more severe in the left hemisphere in 41%, and more severe in the right hemisphere in 6% of the patients. There was no asymmetry by PET pattern interaction. There was no difference in the proportion of patients correctly classified as a function of dementia severity, with 18 of 27 (67%) mild FTD patients and 14 of 22 (64%) moderate-to-severe FTD patients showing frontotemporal hypometabolism.
Overall, specific PET patterns distinguished AD from NL with 99% sensitivity and 98% specificity (98% accuracy, P < 0.001), AD from DLB with 99% sensitivity and 71% specificity (97% accuracy, P < 0.001), AD from FTD with 99% sensitivity and 65% specificity (97% accuracy, P < 0.001), and DLB from FTD with 71% sensitivity and 65% specificity (68% accuracy, P = 0.01).
HIP Evaluations
HIP hypometabolism was present in 2 of 56 NL (4%), 98 of 100 (98%) AD, 3 of 14 (21%) DLB, and 13 of 49 (27%) FTD patients. HIP hypometabolism was more frequent in AD than in NL (P < 0.001), DLB (P < 0.001), and FTD (P < 0.001). No differences were found between NL, DLB, and FTD. There was no difference in the proportion of patients showing HIP hypometabolism as a function of dementia severity in AD and DLB. HIP hypometabolism was more frequent in moderate-to-severe (41%) FTD patients than that in mild (15%) FTD patients (P = 0.04).
Overall, the presence of HIP hypometabolism discriminated AD from NL with 98% sensitivity and 96% specificity (97% accuracy, P < 0.001) and discriminated AD from DLB and FTD with 98% sensitivity and 75% specificity (89% accuracy, P < 0.001). HIP hypometabolism did not significantly discriminate DLB or FTD from NL or DLB from FTD.
Incremental Diagnostic Accuracy of Cortical and HIP Evaluations
Adding the HIP to the cortical evaluations significantly improved the differential diagnosis of AD from non-AD dementia as compared with using cortical ratings alone (P values < 0.001). The gain in accuracy was achieved by increasing diagnostic specificity while leaving sensitivity unchanged, as the combination of cortical and HIP rating distinguished AD from DLB with 98% sensitivity and 100% specificity (99% accuracy, P < 0.001) and distinguished AD from FTD with 98% sensitivity and 94% specificity (97% accuracy, P < 0.001) (Fig. 2). On close examination, the increase in specificity was due to the fact that the 4 DLB patients who were misdiagnosed as AD because of the presence of parietotemporal cortex hypometabolism did not show HIP hypometabolism. Likewise, 14 FTD patients misclassified as AD patients did not show HIP hypometabolism. There was no difference in the frequency of reclassified patients as a function of dementia severity, as the combination of cortical and HIP ratings significantly improved discrimination of both mild and moderate-to-severe DLB and FTD subgroups as compared with AD (Fig. 2).
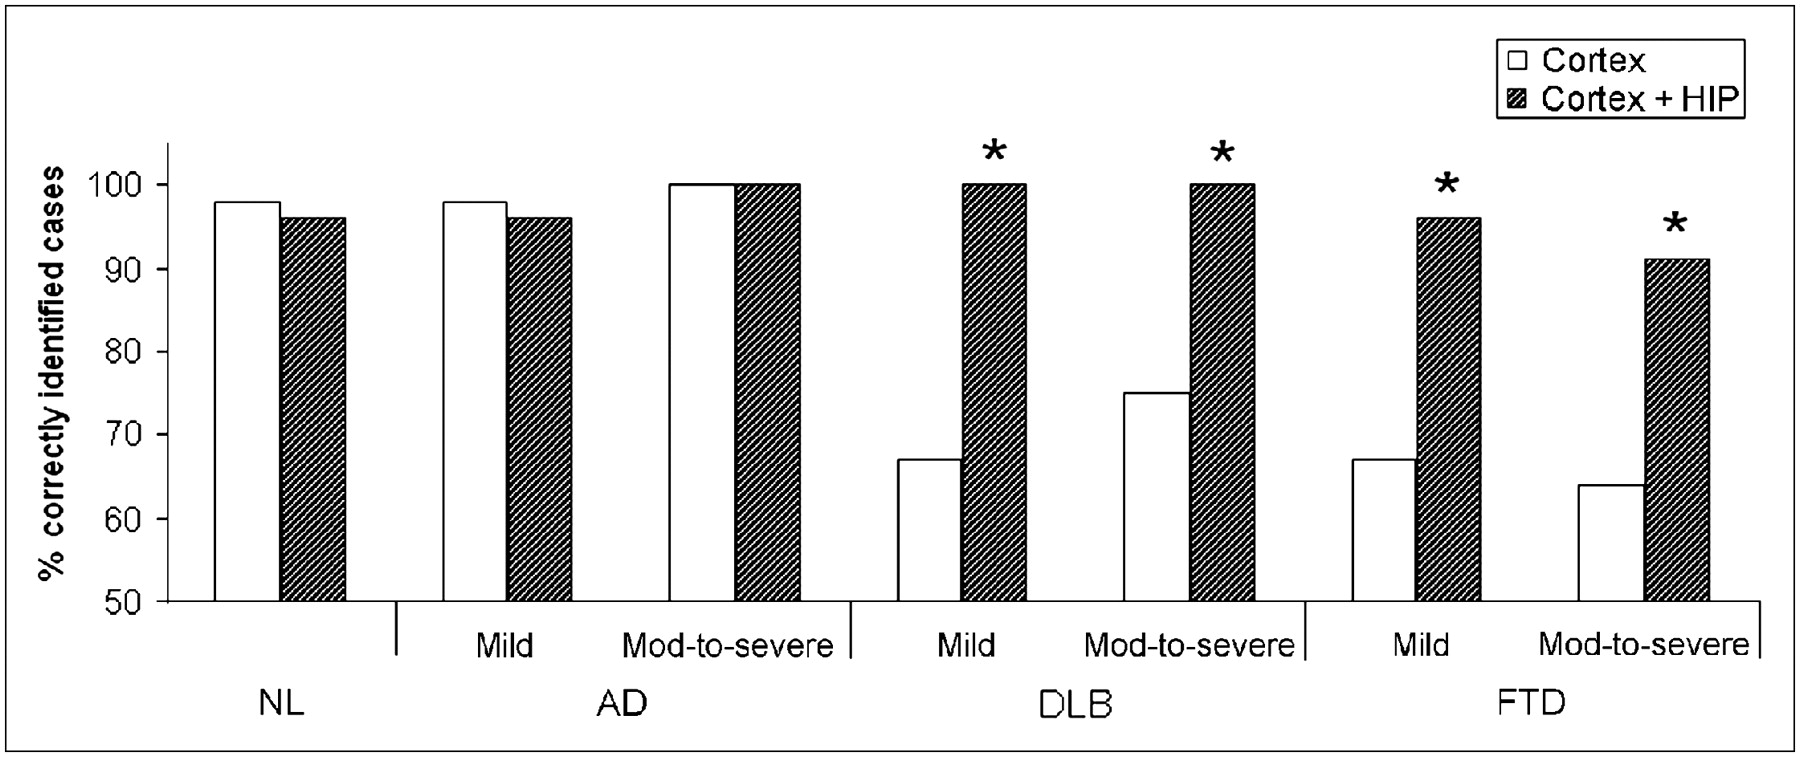
Diagnostic accuracy of cortical 18F-FDG PET ratings (white) and the combination of cortical and HIP 18F-FDG PET ratings (diagonal hatching) in NL subjects and AD, DLB, and FTD patients by dementia severity (mild vs. moderate-to-severe). Asterisks mark significant differences (P < 0.05). mod = moderate.
The combination of cortical and HIP ratings did not significantly improve discrimination between DLB and FTD over the cortical ratings alone.
Reproducibility of Disease-Specific 18F-FDG PET Patterns
On the basis of these findings, disease-specific 18F-FDG PET patterns were identified in the training set, as shown in Figure 1 and summarized synoptically in Table 3. The validity of the proposed disease-specific PET patterns was examined in the independent testing cohort. Of the 54 clinically NL subjects, 51 (94%) showed no 18F-FDG uptake abnormalities. Of the remaining NL subjects, 2 showed reduced 18F-FDG uptake in the HIP and 1 also showed reduced 18F-FDG uptake in the PCC.
Synoptic Description of 18F-FDG PET Patterns by Clinical Group
Among AD patients, 94 of 99 (95%) showed 18F-FDG uptake reductions in the parietotemporal regions, PCC, and HIP. Additional frontal hypometabolism was observed in 72% of these patients. The remaining 5 subjects had mild AD and showed hypometabolism in the PCC and HIP but no parietotemporal deficits. Twelve of the 13 patients with DLB (92%) showed occipitoparietal hypometabolism, 5 of whom also had PCC deficits. One subject showed an AD PET pattern. Among FTD patients, 46 of 49 (94%) showed temporal or frontal hypometabolism, with mild HIP deficits that exceeded the threshold in 5% of the subjects. The remaining 3 FTD patients showed an AD PET pattern.
Overall, disease-specific PET patterns yielded 96% accuracy in discriminating NL, AD, DLB, and FTD subjects in the testing cohort, with 94% NL, 95% AD, 92% DLB, and 94% FTD subjects correctly classified (χ23 = 423, P < 0.001). There was no difference in the proportion of mild and moderate-to-severe dementia patients correctly classified by clinical group.
Characterizing MCI with 18F-FDG PET
Among MCI patients, 101 of 114 (86%) showed cortical hypometabolism indicative of a neurodegenerative disease. The remaining 13 subjects did not show significant cortical hypometabolism. As compared with NL subjects, the presence of a positive PET pattern for any neurodegenerative disease discriminated MCI from NL with 86% sensitivity and 96% specificity (92% accuracy; χ21 = 164, P < 0.001). The majority of MCI patients (68%) showed bilateral 18F-FDG uptake reductions, 11% showed left > right reductions, and the remaining 10% showed right > left reductions.
HIP hypometabolism was found in 96 of 114 (84%) MCI patients, including 11 MCI patients with no cortical hypometabolism. The combination of cortical and HIP ratings significantly improved the diagnostic sensitivity in detecting MCI from NL over the cortical ratings alone, yielding 98% sensitivity and 92% specificity in discriminating MCI from NL (95% accuracy; χ22 = 251, P < 0.001).
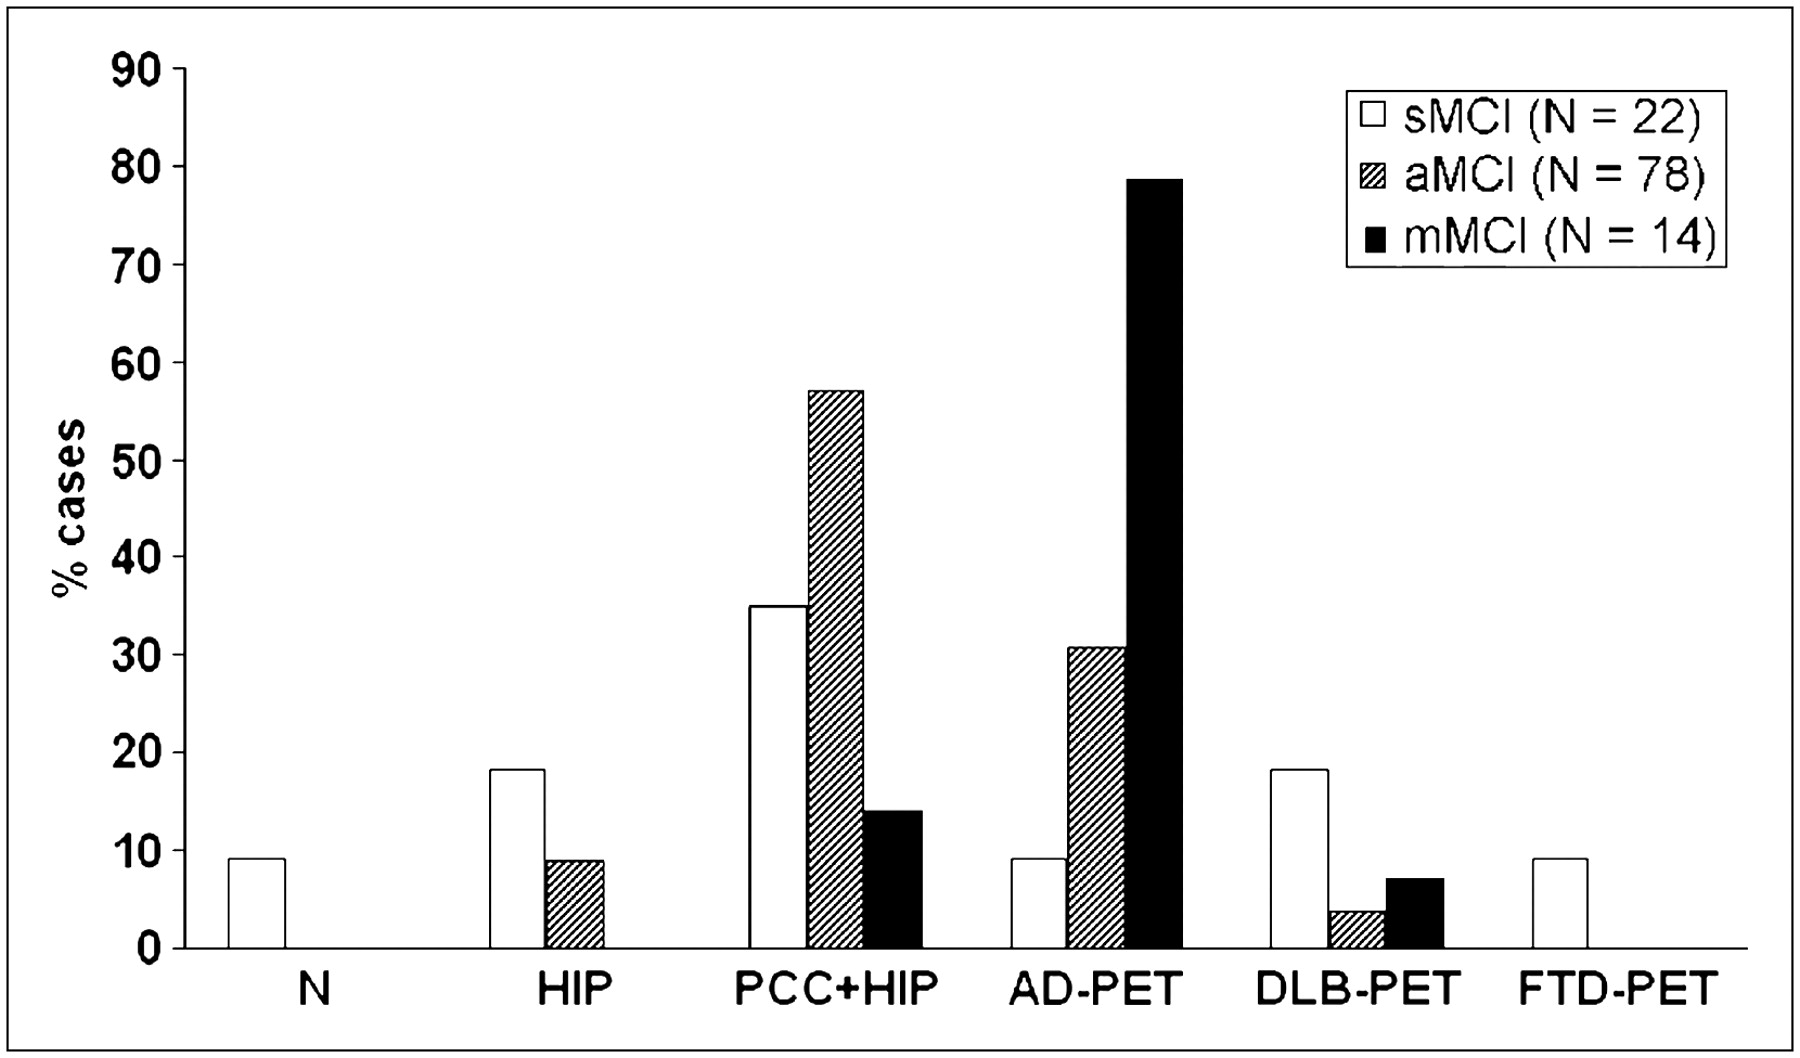
Most MCI patients showed PCC and HIP hypometabolism, which was observed in 92 of 114 (81%) of the patients. However, MCI patients showed heterogeneous neocortical PET profiles. An AD PET pattern was found in 29 of 114 (25%) MCI patients, a DLB PET pattern was found in 8 (7%) patients, and an FTD PET pattern was found in 2 (3%) patients. Heterogeneity was significantly reduced by examining 18F-FDG uptake within MCI subgroups (Fig. 3). The AD PET pattern was more prominent in mMCI (79%) as compared with amnesic MCI (31%, P = 0.01) and sMCI (9%, P = 0.001). Among the subjects showing the AD PET pattern, additional frontal hypometabolism was also more frequent in mMCI (55%) as compared with amnesic MCI (20%) and sMCI (0%) (P values < 0.05). A PET pattern of PCC or HIP hypometabolism without other neocortical involvement was more prominent in amnesic MCI (57%) as compared with sMCI (35%, P = 0.06) and mMCI (14%, P < 0.01). The group of sMCI showed more variable PET profiles, ranging from no hypometabolism (9%) and isolated HIP deficits (18%), to widespread 18F-FDG uptake reductions consistent with AD and FTD (9%), and with DLB (18%). Moreover, asymmetries in CMRglc reductions were more pronounced in sMCI (55%) as compared with both amnesic MCI (27%, P = 0.01) and mMCI (23%, P = 0.03). Variability in 18F-FDG PET patterns among MCI subtypes is illustrated in Supplemental Figure 1.

Heterogeneity of 18F-FDG PET abnormalities in MCI. aMCI = amnesic MCI; N = no hypometabolism; PCC+HIP = hypometabolism restricted to PCC and HIP.
DISCUSSION
The present study demonstrates the feasibility of using 18F-FDG PET in the differential diagnosis of the major neurodegenerative disorders, including mild and moderate-to-severe dementia patients, and in the characterization of MCI across multiple sites.
Across centers, as compared with controls, the vast majority of AD patients showed a characteristic profile of hypometabolism in the parietotemporal and posterior cingulate cortices and, more variably, frontal regions, and HIP. In comparison with AD, DLB patients showed more prominent hypometabolism in the occipital cortices, and FTD patients showed more prominent hypometabolism in the frontal or temporal cortices, consistent with previous reports (5–9). However, 29% of DLB patients and 35% of FTD patients showed a pattern of cortical deficits similar to that of AD patients. Therefore, the presence of cortical abnormalities discriminated AD from DLB and FTD, with a high sensitivity (>90%) though a lower specificity (71% and 65%, respectively), which is consistent with previous studies (9,37,38). It remains to be determined whether the AD PET patterns observed in a subset of clinical DLB and FTD patients—which were considered as a misclassification—reflect, instead, the existence of AD pathology in these patients. Nonetheless, our study shows that examination of the HIP in combination with the cortical regions increases diagnostic specificity in differentiating AD from both DLB and FTD. By using an ROI approach (Supplemental Appendix), we found that HIP 18F-FDG uptake is severely reduced in AD (25%) patients, moderately reduced in FTD (14%) patients, and preserved in DLB as compared with controls. Moreover, HIP 18F-FDG uptake was significantly reduced in AD as compared with both FTD and DLB (13% and 24%, respectively). Therefore, HIP Z scores enhanced specificity over the cortical ratings alone from 71% to 100% in differentiating AD from DLB and from 65% to 94% for differentiating AD from FTD (Fig. 2). The diagnostic accuracy of the newly developed standardized, multicenter-validated disease-specific 18F-FDG PET patterns was evident in an independent cohort of NL, AD, DLB, and FTD patients. The 18F-FDG PET patterns correctly identified 95% AD, 92% DLB, 94% FTD, and 94% NL subjects, for an overall accuracy of 96%. The same findings applied to mild as well as to moderate-to-severe dementia patients.
Little is known about the potential for using 18F-FDG PET as a diagnostic tool at the MCI stage of dementia. The present findings show that 18F-FDG PET patterns of regional CMRglc abnormalities accurately distinguish MCI from NL. The presence of cortical hypometabolism consistent with a neurodegenerative disease discriminated MCI from NL with 86% sensitivity and 96% specificity. The combination of cortical and HIP ratings further increased the diagnostic sensitivity from 86% to 98%, leaving specificity substantially unchanged at 92%.
Moreover, different 18F-FDG PET profiles were identified among MCI subgroups, in keeping with the observation that the clinical syndrome of MCI includes patients with heterogeneous cognitive deficits and clinical outcomes (2). Amnesic and mMCI patients are considered at particularly high risk for developing AD, whereas MCI with deficits in nonmemory domains may be more likely to progress to another dementia (1,2). Consistently, in the present study, an AD PET pattern was found in the majority (79%) of the MCI patients with deficits in multiple cognitive domains, frequently with additional frontal hypometabolism, and in 31% of amnesic MCI patients. The remaining amnesic MCI patients showed primarily CMRglc abnormalities restricted to the PCC and HIP (57%). These data suggest that the extent of hypometabolism may correlate with the severity of cognitive impairment in MCI, as amnesic MCI patients may be seen as an initial AD stage and multiple-domains MCI may be seen as a more advanced AD stage, although this remains to be verified. MCI patients with deficits in a single nonmemory domain showed more variable 18F-FDG PET profiles, from isolated HIP deficits (18%) to 18F-FDG PET patterns consistent with DLB (18%) and with AD and FTD (9%).
To our knowledge, there are no longitudinal 18F-FDG PET studies of nonamnesic MCI. Studies in amnesic MCI suggest that PCC and HIP abnormalities may be necessary but not sufficient to develop dementia, whereas the onset of parietotemporal hypometabolism may be the turning point for expressing symptoms (16–19,39). In previous 18F-FDG PET studies, 22%–41% of the MCI patients with an AD PET pattern actually declined to AD within 1–3 y (2,16–19,39). In the present study, 33% of MCI patients showed an AD PET pattern and 10% showed a DLB or FTD PET pattern. Moreover, 3 NL subjects showed HIP and PCC hypometabolism, which was shown to be a correlate of decline from normal cognition to AD (35). Longitudinal follow-up of our subjects is needed to ascertain whether the present CMRglc abnormalities are predictive of a specific dementia.
Heterogeneous 18F-FDG PET patterns were found also within MCI subtypes. These findings suggest that the clinical syndrome of MCI, even at the MCI subtype level, includes a mixed population presenting with variable patterns of metabolic impairment, possibly resulting from different pathologic substrates. 18F-FDG PET assessments may improve the diagnosis of MCI by detecting 18F-FDG uptake abnormalities suggestive of a specific neurodegenerative disease, whose prompt identification could lead to secondary prevention by controlling risk factors (i.e., systolic hypertension and high cholesterol levels), as well as primary prevention, as soon as disease-modifying treatments for dementing disorders become available. Preclinical specificity may be further improved by examination of 18F-FDG uptake in additional brain regions, such as the thalamus and basal ganglia in early FTD (7), and in contrast to amyloid PET in AD and DLB (40).
At present, a limitation to the use of PET in the clinical practice is the reliance on qualitative interpretation of the images by visual reading. Visual ratings depend heavily on the observer's experience and training, and 18F-FDG PET measures often lack clearly defined cutoffs to distinguish between normal and pathologic findings. The present study shows that objective image analysis procedures can be easily applied and shared across different PET centers, thanks to the development of voxel-based automated techniques for diagnostic examinations (13,16) and of reliable normative databases (33). After filtering and masking, and by focusing on preselected brain regions, it is feasible to combine 18F-FDG PET data across multiple sites (Supplemental Appendix). Using standardized, operator-independent procedures, the coefficients of variation were lower than 20% for all regional PET measures and across centers, suggesting that data reduction procedures are effective in averaging out effects related to interscanner variability. The comparison of clinical groups to the NL reference database resulted in findings of consistent regional 18F-FDG uptake abnormalities in clinical groups across centers, so that uniform diagnostic criteria for 18F-FDG PET—which yielded an overall diagnostic accuracy of 96% in distinguishing AD, DLB, and FTD from NL and from each another—could be developed. These findings are in agreement with previous multicenter 18F-FDG PET studies demonstrating that standard ROIs and voxel-based analysis procedures distinguish AD from NL with high accuracy (28,39) and extend these observations to MCI.
CONCLUSION
Standardized automated analysis of 18F-FDG PET scans provides an objective and sensitive support to the clinical diagnosis in early dementia.
Acknowledgments
This study was supported by NIH grants NIH-NIA AG13616, AG12101, AG08051, AG022374, U01 AG016976, and NIH-NCRR MO1RR0096, the Alzheimer's Association, and European Union grants QLK-6-CT-1999-02178 and QLK-6-CT-1999-02112.
Footnotes
-
COPYRIGHT © 2008 by the Society of Nuclear Medicine, Inc.
References
- Received for publication July 18, 2007.
- Accepted for publication December 5, 2007.


Jump to section
Related Articles
Cited By...
- Fast Interneuron Dysfunction in Laminar Neural Mass Model Reproduces Alzheimers Oscillatory Biomarkers
- BOLD Amplitude Correlates of Preclinical Alzheimers Disease
- SNMMI Procedure Standard/EANM Practice Guideline for Brain [18F]FDG PET Imaging, Version 2.0
- Early brain neuroinflammatory and metabolic changes identified by dual tracer microPET imaging in mice with acute liver injury
- Personalized modeling of neurodegeneration determines dementia severity from EEG recordings
- Brain Trauma Imaging
- Model-based whole-brain perturbational landscape of neurodegenerative diseases
- In Situ Microwave Fixation to Define the Terminal Rodent Brain Metabolome
- Brain Metabolism Related to Mild Cognitive Impairment and Phenoconversion in Patients With Isolated REM Sleep Behavior Disorder
- Cerebral hypoperfusion is a late pathological event in the course of Alzheimers disease
- Donor-Specific Transcriptomic Analysis of Alzheimer's Disease-Associated Hypometabolism Highlights a Unique Donor, Ribosomal Proteins and Microglia
- APOE4 Lowers Energy Expenditure and Impairs Glucose Oxidation by Increasing Flux through Aerobic Glycolysis
- Longitudinal structural and metabolic changes in frontotemporal dementia
- Donor specific transcriptomic analysis of Alzheimers disease associated hypometabolism highlights a unique donor, microglia, and ribosomal proteins
- Limits for Reduction of Acquisition Time and Administered Activity in 18F-FDG PET Studies of Alzheimer Dementia and Frontotemporal Dementia
- Neural correlates of exceptional memory ability in SuperAgers: A multimodal approach using FDG-PET, PIB-PET, and MRI
- An evidence-based algorithm for the utility of FDG-PET for diagnosing Alzheimer's disease according to presence of medial temporal lobe atrophy
- Motion discrimination in dementia with Lewy bodies and Alzheimer disease
- Automated Quantification of 18F-Flutemetamol PET Activity for Categorizing Scans as Negative or Positive for Brain Amyloid: Concordance with Visual Image Reads
- Complementary Role of 18F-FDG PET and 123I-Ioflupane SPECT in the Diagnosis of Lewy Body Disease
- Systematic Comparison of the Performance of Integrated Whole-Body PET/MR Imaging to Conventional PET/CT for 18F-FDG Brain Imaging in Patients Examined for Suspected Dementia
- [18F]FDG-PET is superior to [123I]IBZM-SPECT for the differential diagnosis of parkinsonism
- Nuclear medicine functional imaging of the brain
- Inclusion criteria provide heterogeneity in baseline profiles of patients with mild cognitive impairment: comparison of two prospective cohort studies
- Brain Imaging in Alzheimer Disease
- Effectiveness and Safety of 18F-FDG PET in the Evaluation of Dementia: A Review of the Recent Literature
- Target-Specific PET Probes for Neurodegenerative Disorders Related to Dementia
- Combining MR Imaging, Positron-Emission Tomography, and CSF Biomarkers in the Diagnosis and Prognosis of Alzheimer Disease