


Article Figures & Data
Figures
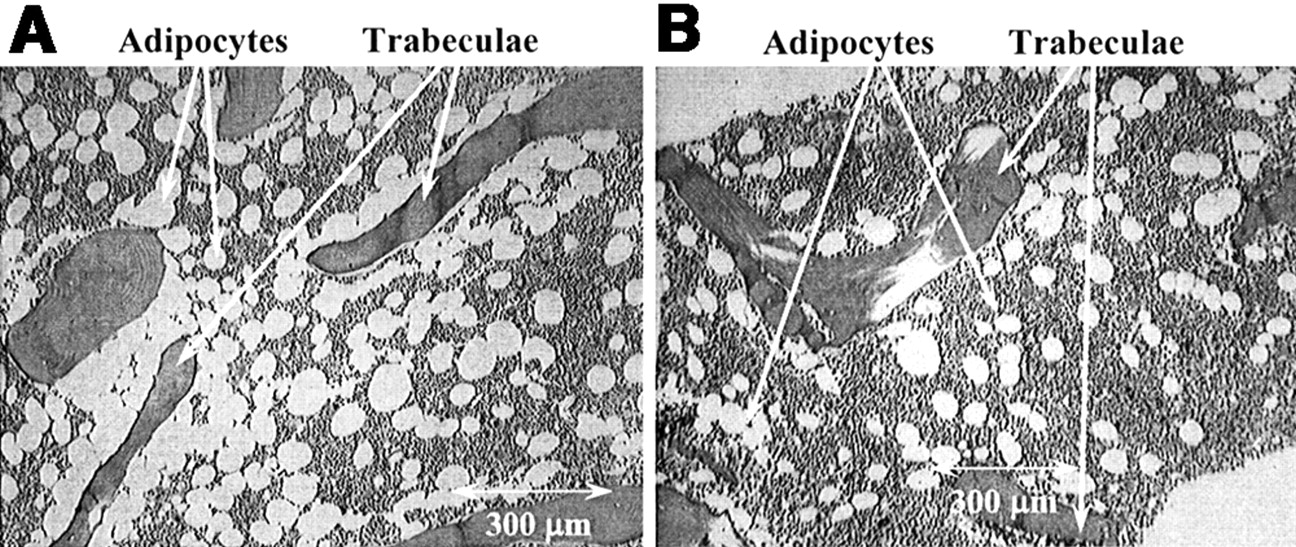
- FIGURE 1.
Video capture images of 2 bone marrow biopsy specimens. (A) Marrow at 30% cellularity. (B) Marrow at 80% cellularity.
- FIGURE 2.
Representative slices from 3D segmented NMR images of 51-y-old male femoral head. Black, white, and gray pixels represent bone trabeculae, active marrow, and adipose tissue, respectively, with the latter implemented using the DEFINED method of voxel tagging. Images are shown for 60% marrow cellularity (A), 60% cellularity showing only bone surface adipose voxels (B), and 60% cellularity showing only marrow space adipose voxels (C). Scale of each panel is 17.3 mm on edge.
- FIGURE 3.
Frequency distribution of adipocyte cluster cell size as function of marrow cellularity from 30% to 100%.
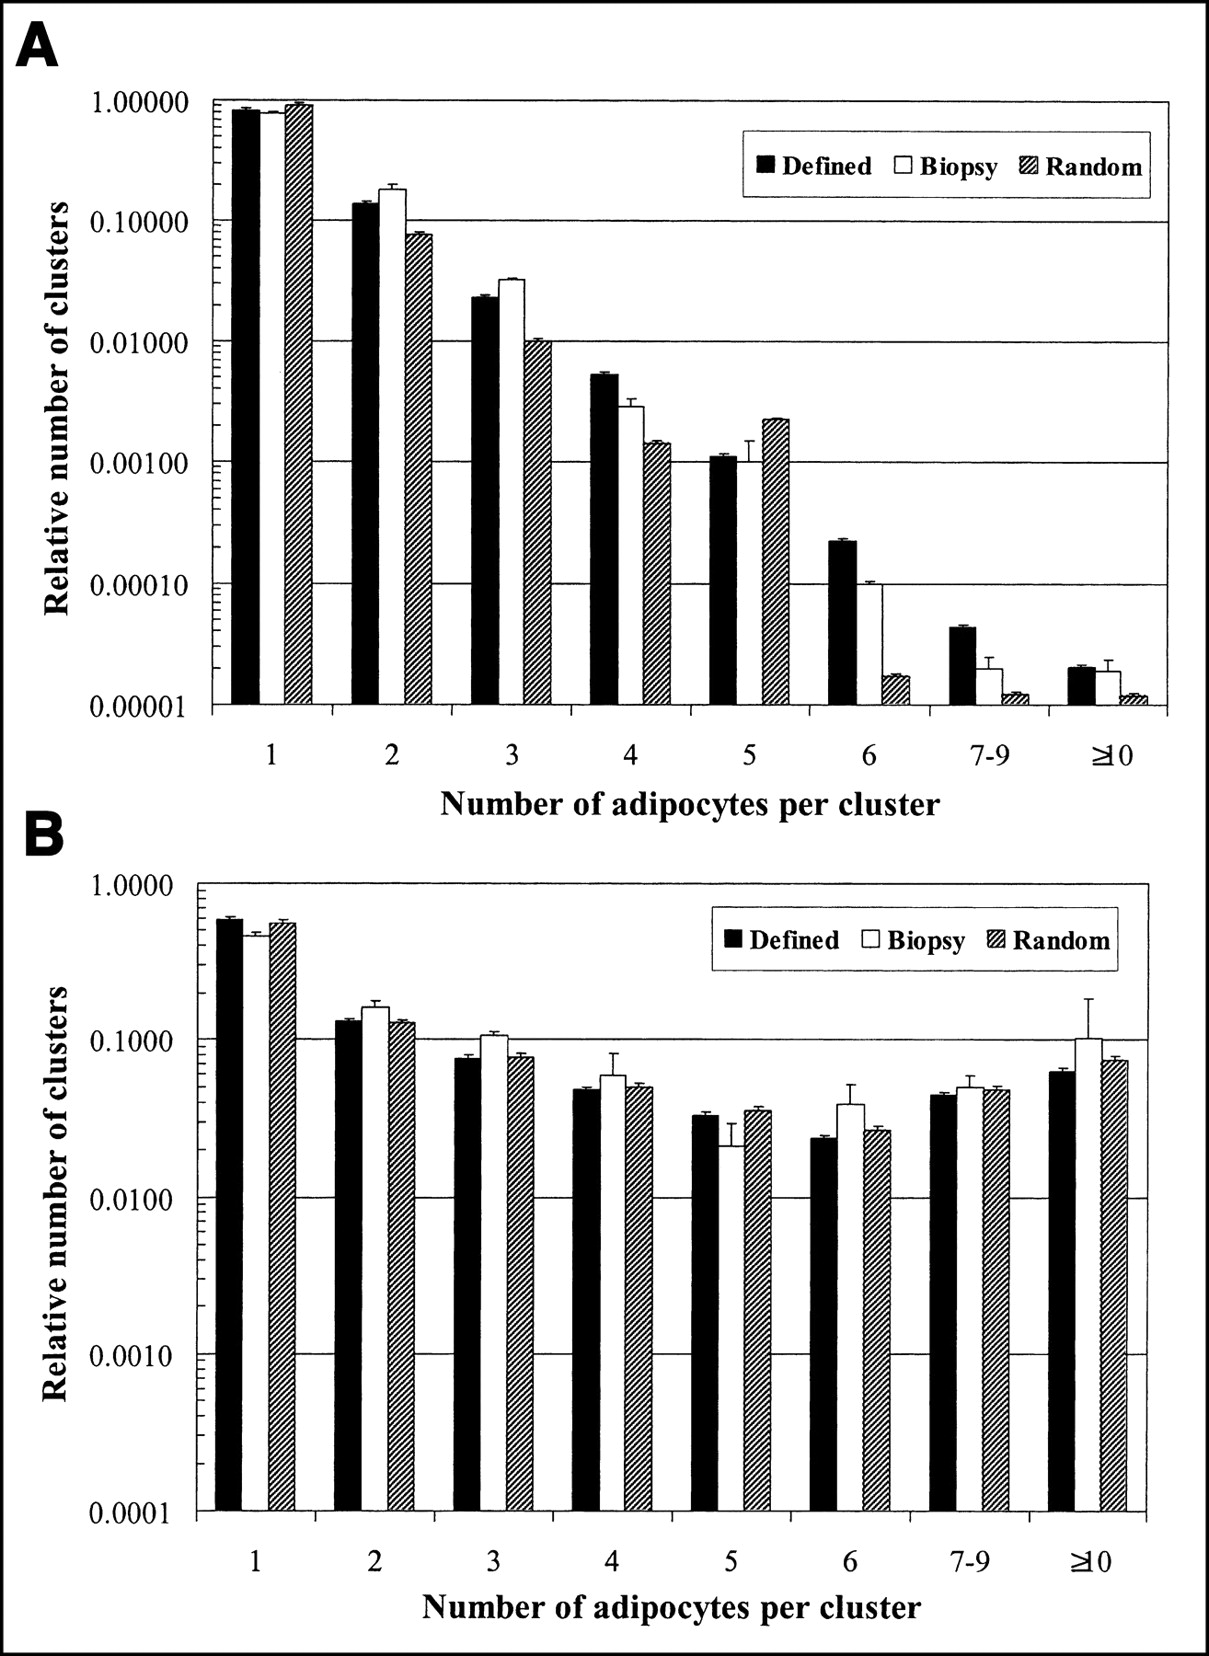
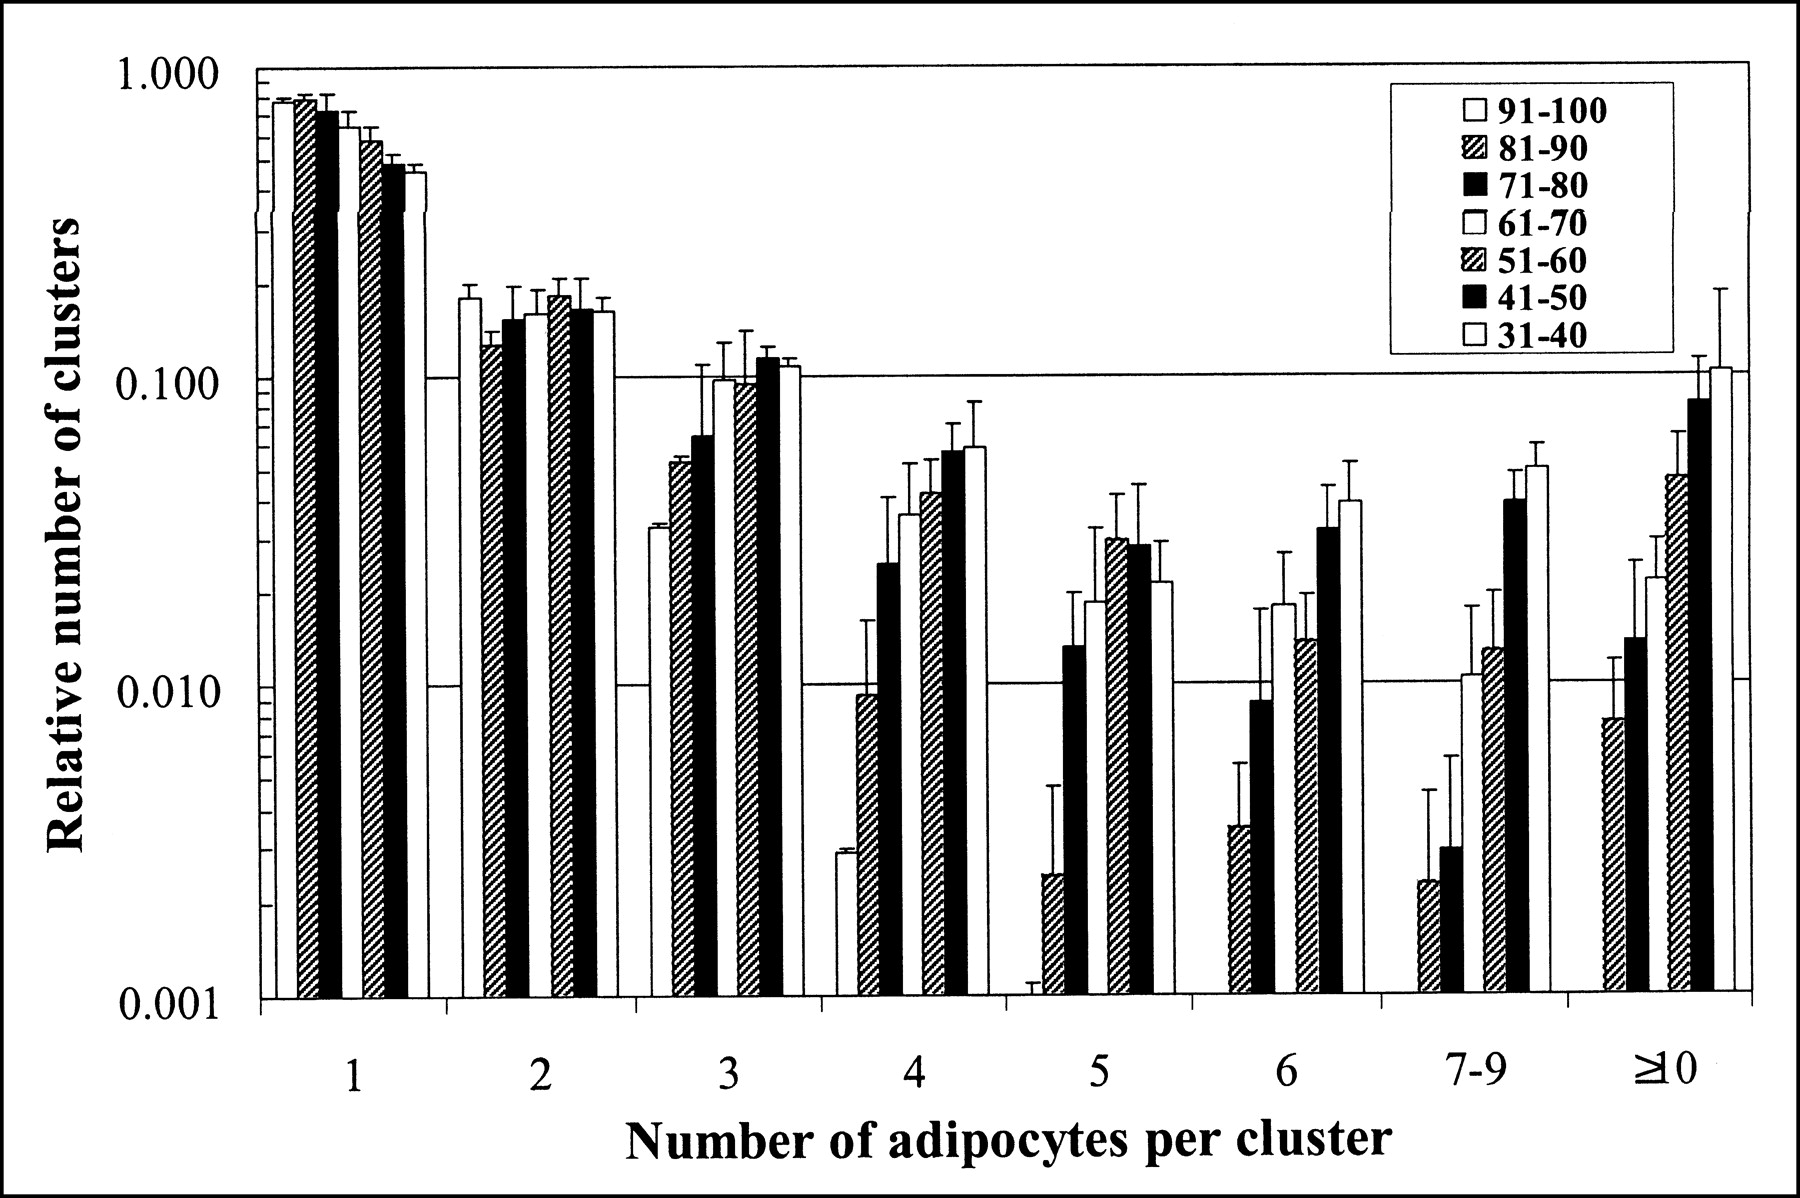
- FIGURE 4.
Comparison of relative number of adipocytes per cluster within marrow cavity as measured in marrow biopsies (□) and as simulated in NMR microscopy images using DEFINED (▪) and RANDOM (▦) methods of voxel tagging. Comparisons are made at marrow cellularities of 90%–100% (A) and 30%–40% (B).
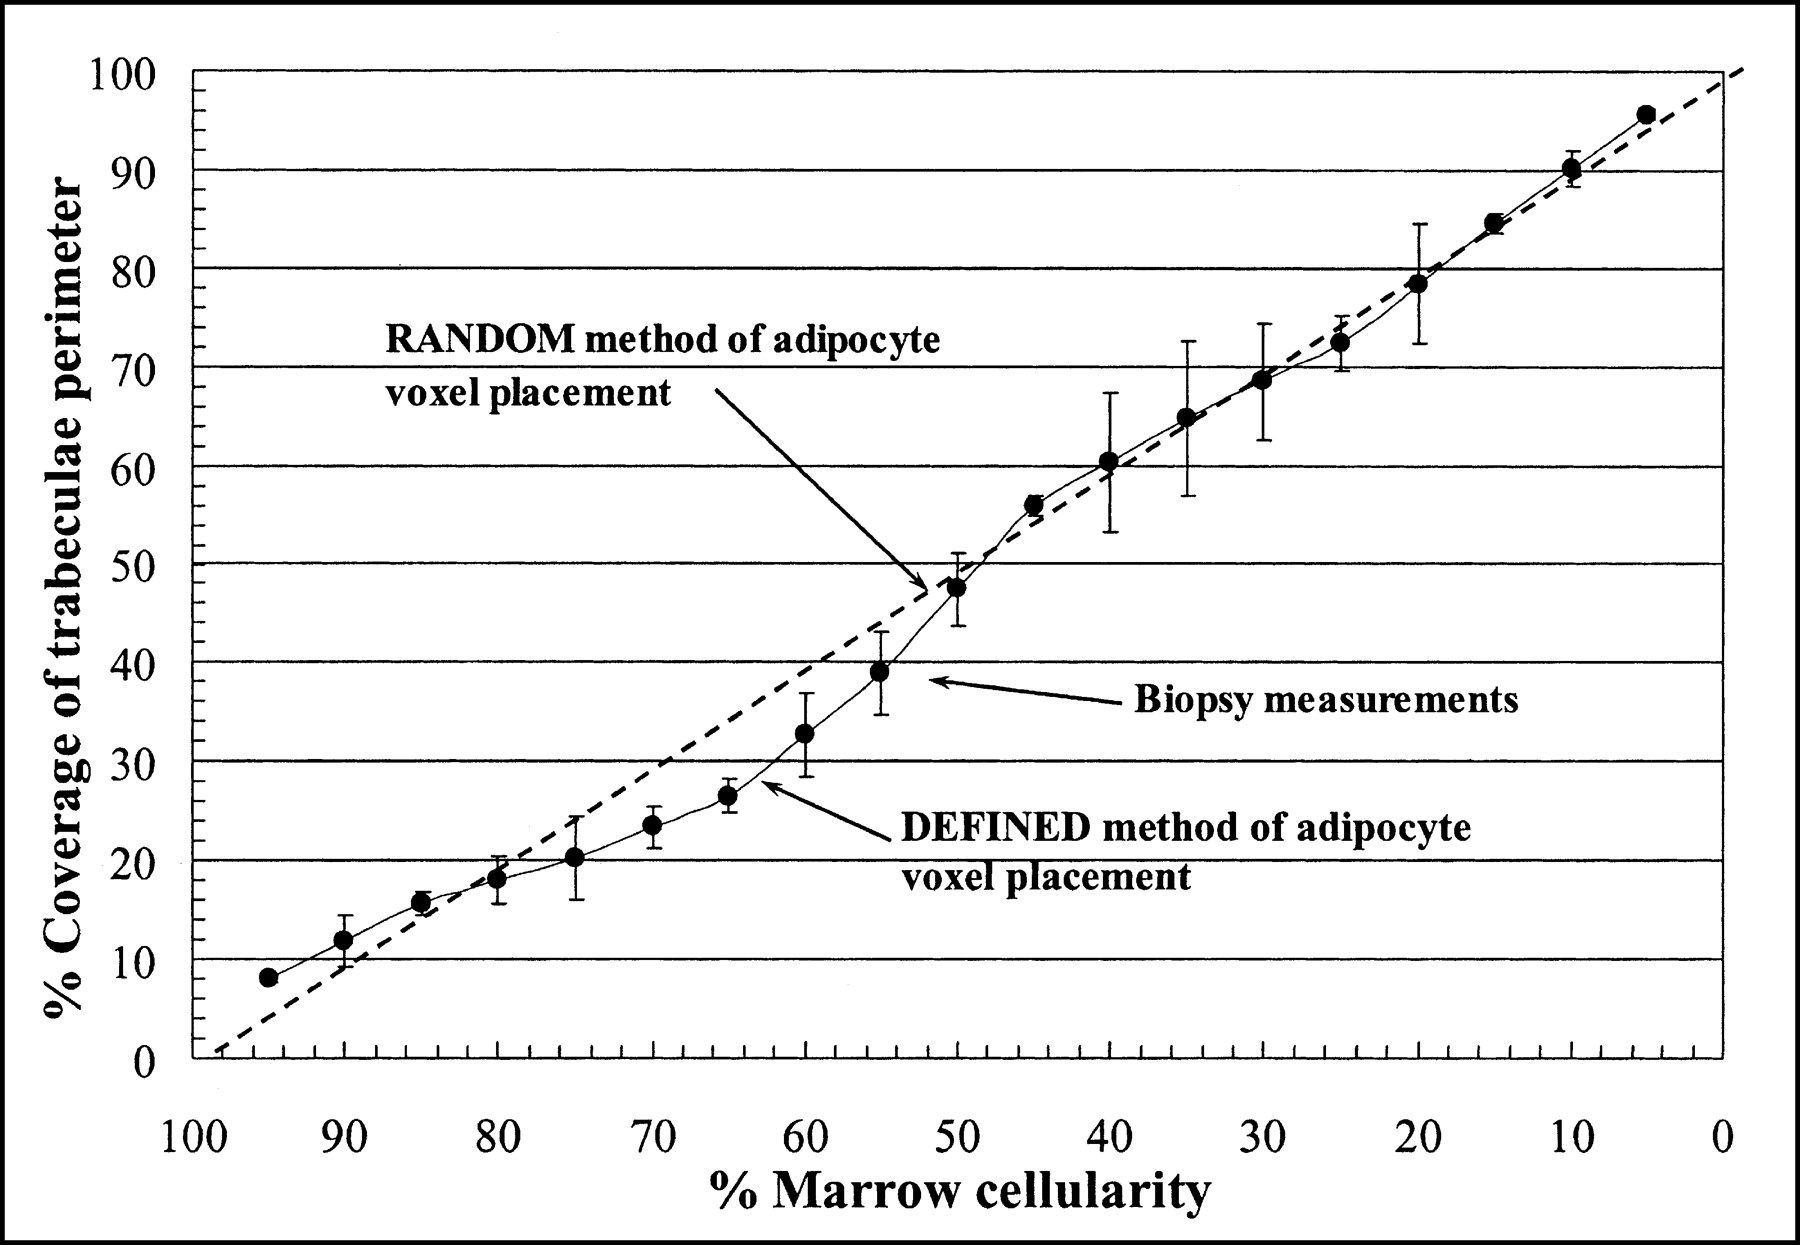
- FIGURE 5.
Percentage of bone trabeculae perimeter that is in immediate contact with marrow adipocytes (• - biopsy measurements). With a random method of tagging adipose marrow voxels, percentage of trabeculae perimeter coverage is shown to increase linearly with decreasing marrow cellularity (1 - fat fraction).
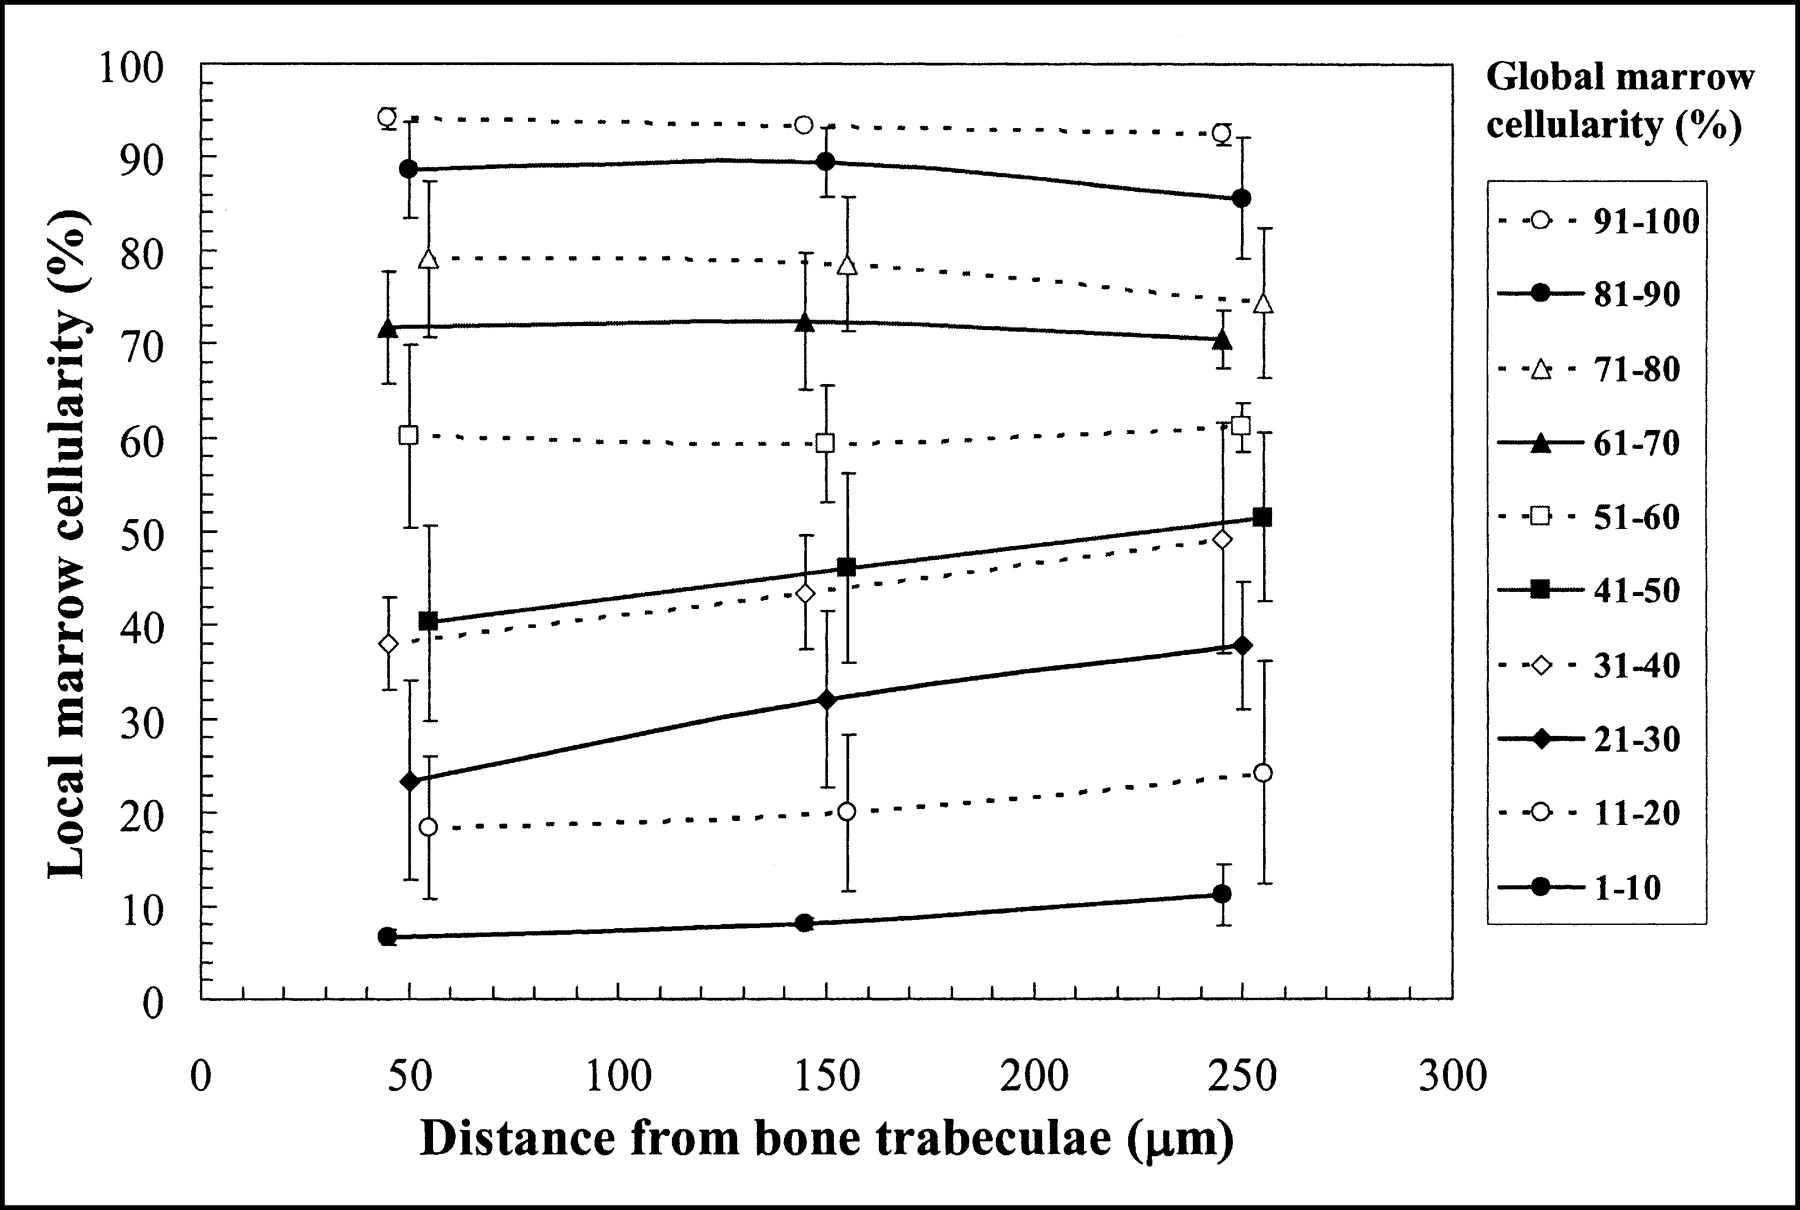
- FIGURE 6.
Variations in local marrow cellularity as function of both distance from bone trabeculae and global marrow cellularity of biopsy sample. Values shown are means and 1-σ errors for replicate measurements for different bone trabeculae and for up to 3 different biopsy samples. Data are plotted at means of distance intervals in staggered fashion to better display data error bars.
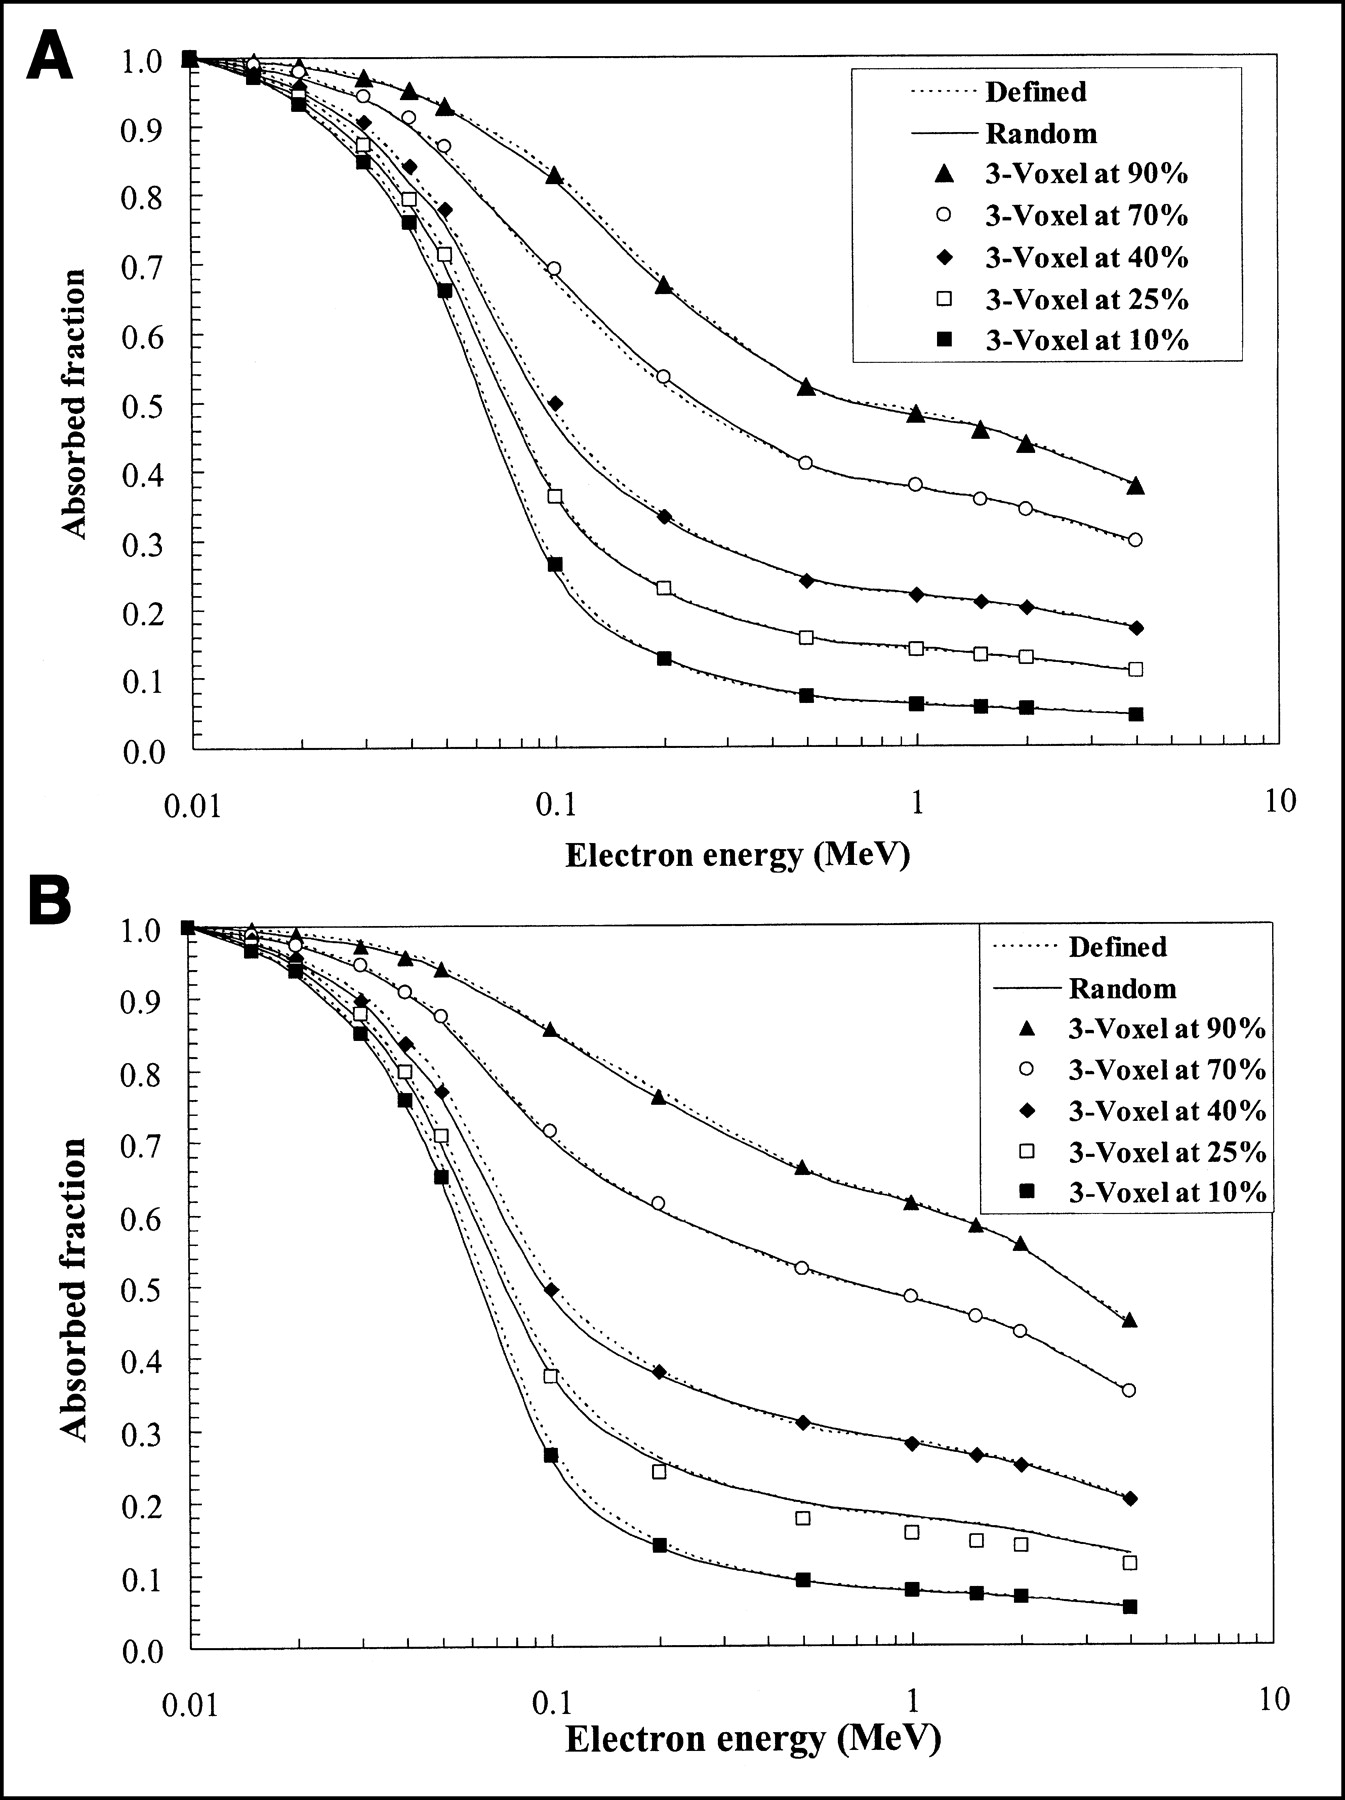
- FIGURE 7.
Comparison of electron absorbed fraction data, φ(TAM←TAM), for self-irradiation of TAM within femoral head of 51-y-old man (A) and that of 82-y-old woman (B). At each value of marrow cellularity, simulation results are shown for all 3 methods of adipocyte introduction within marrow cavities of 3D NMR image: DEFINED method (dashed curves), RANDOM method (solid curves), and 3-Voxel method used previously by Bolch et al. (9) (data symbols).
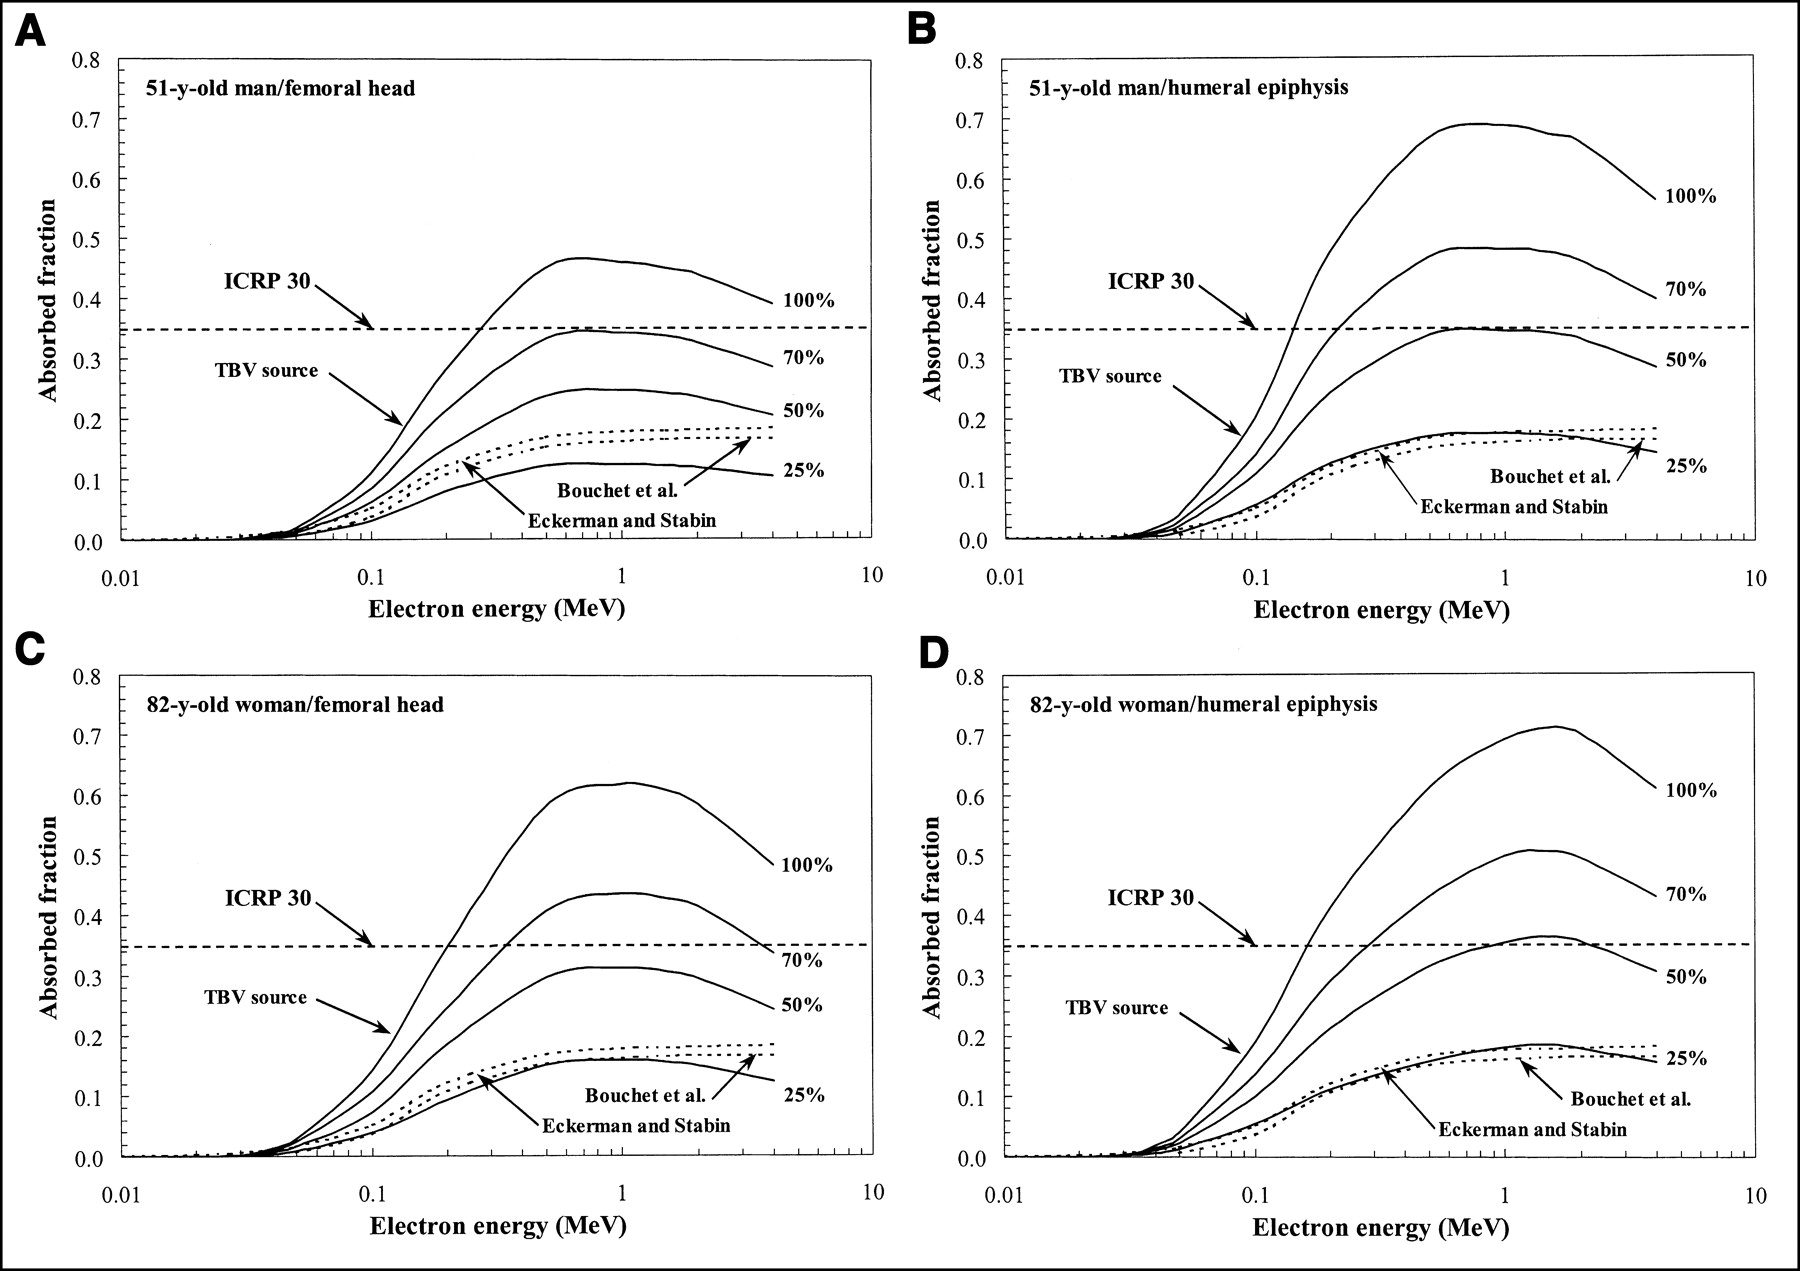
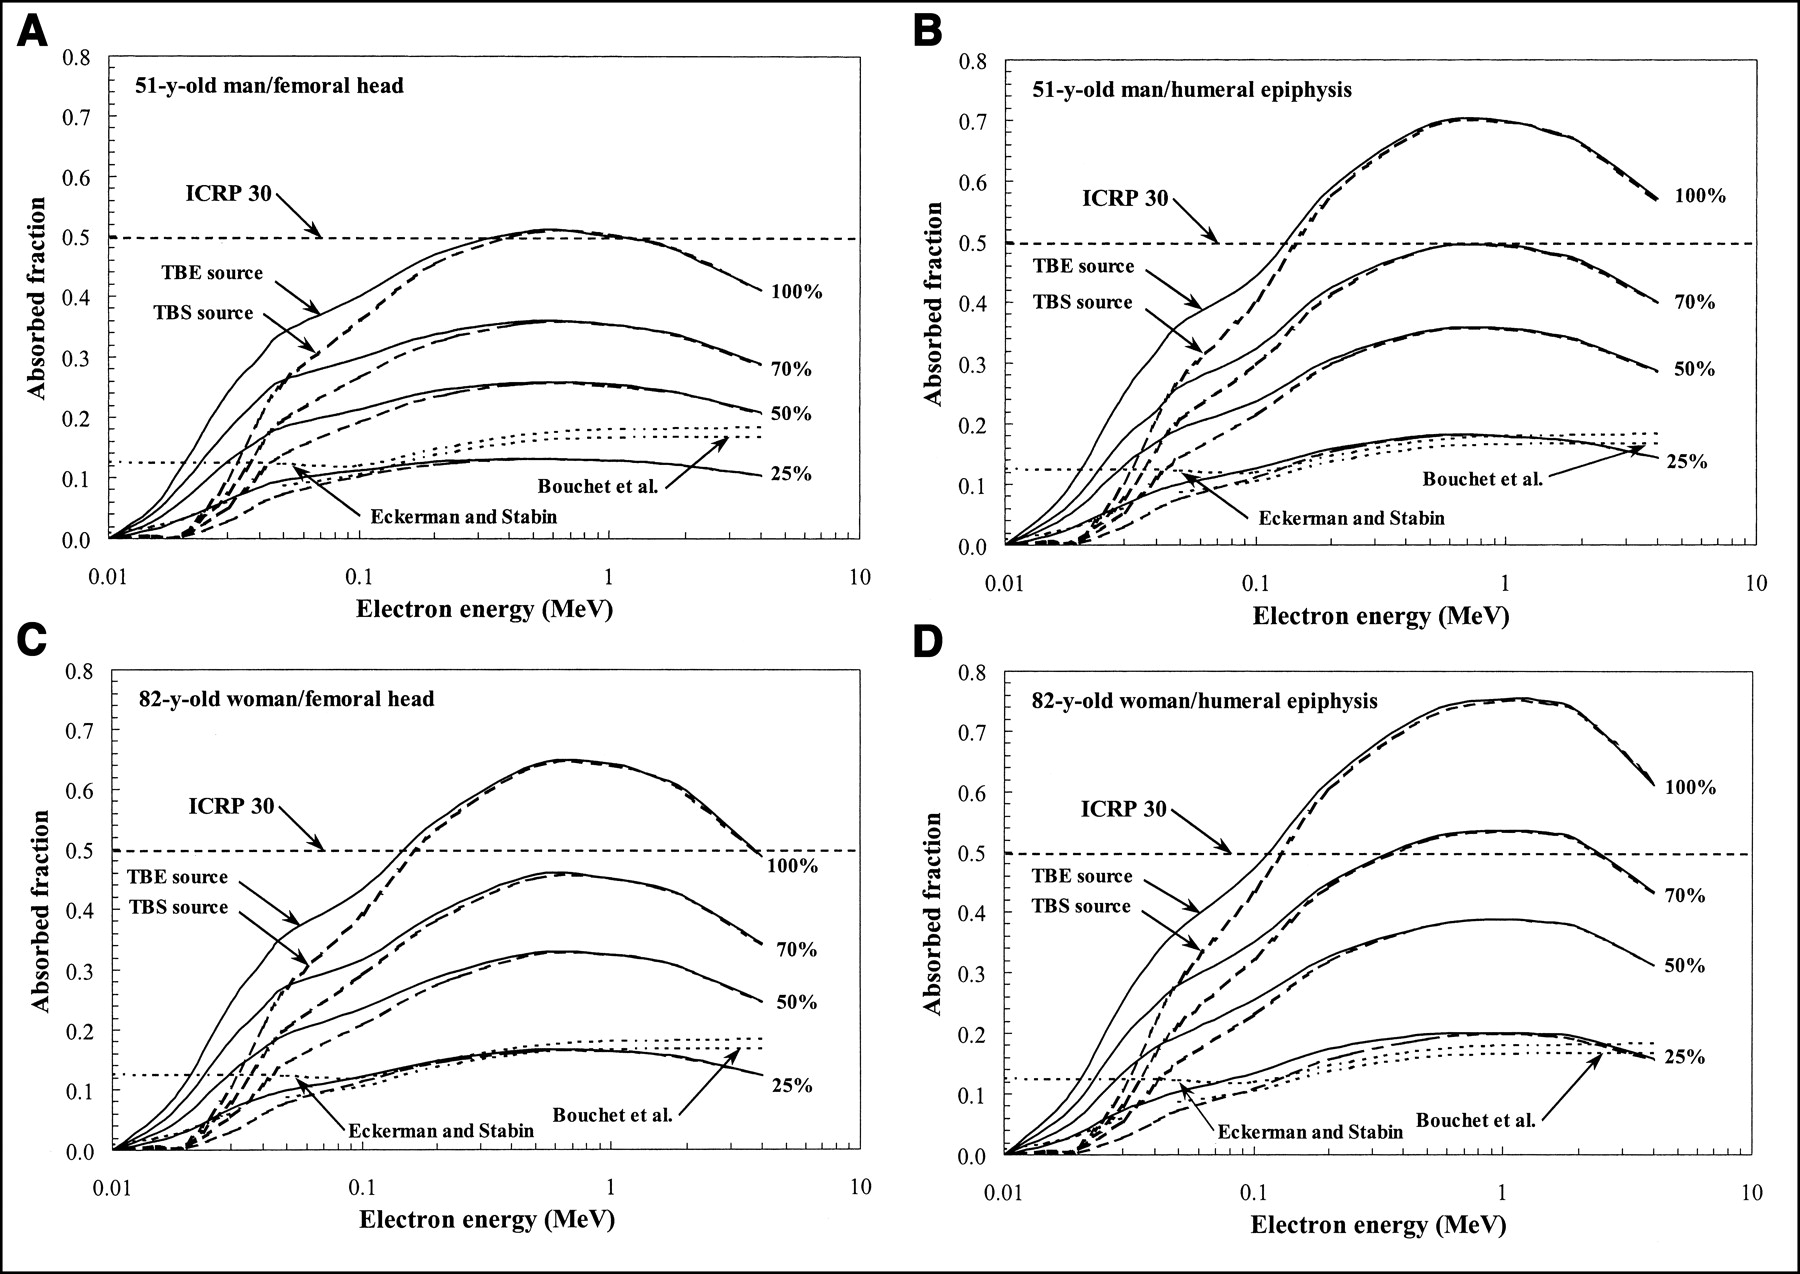
- FIGURE 8.
Absorbed fractions to TAM, φ (TAM←TBV), for electron sources emitted uniformly within TBV at 4 values of marrow cellularity: 100%, 70%, 50%, and 25%. Data are shown for 2 skeletal sites and 2 individuals as indicated in A–D. For comparison, values are shown as well for ICRP 30 model (energy-independent dashed line) and both the Eckerman and Stabin (16) and the Bouchet et al. (17) models (energy-dependent dashed line).
- FIGURE 9.
Absorbed fractions to TAM for electron sources emitted uniformly within either TBE or TBS at 4 values of marrow cellularity: 100%, 70%, 50%, and 25%. Data are shown for 2 skeletal sites and 2 individuals as indicated in A–D. For comparison, values are shown as well for ICRP 30 model (energy-independent dashed line) and both the Eckerman and Stabin (16) and the Bouchet et al. (17) models (energy-dependent dashed line).


In this issue


Jump to section
Related Articles
Cited By...
- MIRD Pamphlet No. 22 (Abridged): Radiobiology and Dosimetry of {alpha}-Particle Emitters for Targeted Radionuclide Therapy
- Toward Patient-Friendly Cell-Level Dosimetry
- Spatial Distribution of Blood Vessels and CD34+ Hematopoietic Stem and Progenitor Cells Within the Marrow Cavities of Human Cancellous Bone
- Absorbed Fractions for {alpha}-Particles in Tissues of Trabecular Bone: Considerations of Marrow Cellularity Within the ICRP Reference Male
- A Paired-Image Radiation Transport Model for Skeletal Dosimetry
- Dosimetry of Internal Emitters