


Abstract
Current bone marrow dosimetry methods inherently assume that the target cells of interest for the assessment of leukemia risk (stochastic effects) or marrow toxicity (deterministic effects) are uniformly localized throughout the marrow cavities of cancellous bone. Previous studies on mouse femur, however, have demonstrated a spatial gradient for the hematopoietic stem and progenitor cells, with higher concentrations near the bone surfaces. The objective of the present study was to directly measure the spatial concentration of these cells, as well as marrow vasculature structures, within images of human disease-free bone marrow. Methods: Core-biopsy samples of normal bone marrow from the iliac crest were obtained from clinical cases at Shands Hospital at the University of Florida Department of Pathology. The specimens were sectioned and immunohistochemically stained for CD34 (red) and CD31 (brown) antigens. These 2 stains were used simultaneously to differentiate between hematopoietic stem and progenitor cells (CD34+/CD31−) and vascular endothelium (CD34+/CD31+). Distances from hematopoietic CD34+ cells and blood vessels to the nearest bone trabecula surface were measured digitally and then binned in 50-μm increments, with the results then normalized per unit area of marrow tissue. The distances separating hematopoietic CD34+ cells from vessels were also tallied. Results: Hematopoietic CD34+ cells were found to exist along a linear spatial gradient with a maximal areal concentration localized within the first 50 μm of the bone surfaces. An exponential spatial concentration gradient was found in the concentration of blood vessel fragments within the images. Distances between hematopoietic CD34+ cells and blood vessels exhibited a lognormal distribution indicating a shared spatial niche. Conclusion: Study results confirm that the spatial gradient of hematopoietic stem and progenitor cells previously measured in mouse femur is also present within human cancellous bone. The dosimetric implication of these results may be significant for those scenarios in which the absorbed dose itself is nonuniformly delivered across the marrow tissues, as would be the case for a low-energy β- or α-particle emitter localized on the bone surfaces.
Techniques for the internal dosimetry of skeletal tissues in radiologic protection have defined hematopoietically active (or red) bone marrow and skeletal endosteum as the 2 relevant target tissues for this organ system (1,2). The former serves as the target tissue for assessing leukemia risk, whereas the latter addresses bone cancer risk. In molecular radiotherapy, the red bone marrow has further served as the relevant target tissue for the risks of acute effects, including various forms of myelosuppression and hematopoietic toxicity (3). The red bone marrow and skeletal endosteum are in reality surrogate tissue regions for specific radiosensitive cell populations for which dose estimates are sought. Red bone marrow thus serves as the surrogate tissue for the hematopoietic stem cells and their progenitors, whereas skeletal endosteum serves as the surrogate tissue for osteoprogenitor cells. Dosimetric models of the skeleton based on either chord-length distributions across the marrow cavities and bone trabeculae (4,5) or 3-dimensional (3D) small-animal CT images of the trabecular microarchitecture (6,7) do not at present specifically identify these cell populations, and thus they continue to rely on the use of surrogate tissue regions in reference patient phantoms.
The skeletal endosteum has traditionally been defined in radiologic protection as a single 10-μm layer of soft tissue immediately adjacent to the surfaces of both cancellous and cortical bone (8). As such, this surrogate tissue layer ensures that the absorbed doses to the osteoprogenitor cells themselves are reasonably represented by the single average absorbed dose to this tissue surrogate. For red bone marrow, however, current dosimetry models average the absorbed dose across all regions of bone marrow cavities. This approach implicitly assumes that the target cells of interest are concentrated uniformly throughout the marrow cavities of human cancellous bone (i.e., the number of target cells is proportional to the volume of red bone marrow). This assumption was originally proposed by the International Commission on Radiological Protection because of a lack of data supporting the presence of a spatial concentration gradient (9). Studies by Charlton et al. (10) indirectly support the hypothesis of a uniform spatial concentration of stem cells in bone marrow. In their work, CD34 and CD38 immunohistochemical staining was used to identify marrow stem and progenitor cells. Measurements were then made of their distances from marrow adipocytes, where the latter were considered α-particle sources of internalized 222Rn gas. Their study suggested that the hematopoietic stem cells were uniformly distributed from the marrow adipocytes. Work by Shah et al. (11) has further indicated that spatial gradients in marrow cellularity are weak and, thus, that marrow adipocytes are themselves uniformly found across the marrow cavities in human bone marrow. Animal studies, however, support the hypothesis that the hematopoietic stem cells and progenitor cells are localized much closer to the bone trabecula surfaces and decrease in concentration within deeper regions of bone marrow (12,13). Work by Frassoni et al. (14), Lord (15), and Cui et al. (16) on the mouse femoral shaft have demonstrated a clear spatial gradient in the distribution of different cell lines responding to marrow growth factors as a function of distance into the femoral medullary cavity. The presence of a spatial gradient in hematopoietic stem and progenitor cells within human bone marrow could possibly be significant in the construction of dose–response models for marrow toxicity in cases in which the marrow absorbed dose itself is delivered nonuniformly. The mean red marrow absorbed dose (i.e., surrogate tissue) would thus not properly represent that seen by the target cells of interest.
The objectives of the present study were to directly measure the spatial concentration of hematopoietic stem and progenitor cells and of blood vessels as a function of their distance into the marrow cavities of human cancellous bone using CD34 and CD31 immunohistochemical staining coupled with image-processing techniques. CD34 antigen sites are present on hematopoietic stem cells and progenitor cells, as well as endothelial cells. CD31 staining is used to then separately identify the vascular endothelium. Techniques for using this information in an expanded application of the MIRD schema are presented and discussed.
MATERIALS AND METHODS
Specimen Selection
Paraffin blocks containing core biopsy samples of bone marrow from the iliac crest were obtained from pathology files at the University of Florida Shands Hospital under an approved protocol of the institutional review board. The biopsies had been performed for diagnostic purposes. Twelve biopsy samples, masked as to identity, from 4 male subjects (age range, 2–44 y) and 8 female subjects (age range, 7–80 y) were selected for study and confirmed to contain disease-free normocellular marrow. Table 1 details the age and sex of each subject. For 2 subjects, 2 separate biopsy slides were analyzed, bringing the total number of study specimens to 14.
Summary of Enrolled Subjects and Core Biopsy Measurement Results
Slide Preparation
Paraffin sections, 4 μm in thickness, were cut and placed on slides and dried for 2 h at 60°C. The slides were next placed on a Ventana Benchmark automated immunostainer (Ventana Medical Systems Inc.), where they were freed of paraffin and subjected to heat-induced Ventana CC1 epitope retrieval solution. A CD34 antibody stain (QBend/10 clone prediluted from Ventana) was applied to the paraffin sections for 32 min each, and the presence of the antigen was visualized with the Ventana Enhanced V red detection kit. Slides were removed from the stainer, immersed in reaction buffer (Ventana), and then placed in a 95°C Trilogy oven (Cell Marque) for 10 min. The slides were subsequently stained with a CD31 antibody (Dako Corp.) at a dilution of 1:20 on the Ventana Benchmark. CD31 was visualized using the i-view DAB detection kit (Ventana). Slides were counterstained with hematoxylin (Ventana); taken off the stainer; and then dehydrated through graded alcohols, cleared with xylene, and mounted with permanent mounting medium.
Image Acquisition and Processing
After staining and slide preparation, each biopsy specimen was imaged at the Optical Microscopy facility of the University of Florida McKnight Brain Institute. Each specimen was viewed under an Axioplan 2 microscope (Zeiss) and a Hamamatsu C-4742 chilled CCD camera (Hamatsu Photonics) in bright field mode. A 20× objective lens was used for optimal compromise between image resolution and field of view. Image resolution was verified via a caliper slide (calibration factor of 1.2 pixels/μm). Tile-field mapping capabilities were used to obtain a series of composite images of each biopsy specimen. The number of individual tile-map images taken for each biopsy specimen varied with the specimen length and width. Nominally, 5 separate tile-field images were taken per biopsy microtome section, but as many as 10 were possible in some cases. Each image field was processed using the SPOT Advanced software (Diagnostic Instruments Inc.) with a sharpening filter. Once each biopsy image set was obtained, individual images were concatenated using Photoshop (version 7.01; Adobe Systems Inc.) to give a total biopsy image for distance measurements. Figure 1A shows one of the composite tiled images used in the study.

Bone marrow biopsy specimens from iliac crest. (A) Five-section composite image of single histologic section of biopsy sample. (B) Representative distance measurements of hematopoietic CD34+ cells to nearest bone trabecula surface (yellow lines), blood vessel fragment to nearest bone trabecula surface (blue lines), and separation distances between hematopoietic CD34+ cells and nearest blood vessel fragment (violet lines).
Measurements of Hematopoietic CD34+ Cells and Blood Vessels
The SPOT Advanced software was used to make histologic measurements in pixel units, which were subsequently transformed to micrometers on the basis of a calibration factor of 1.2 pixels/μm. The distances to the nearest bone trabecula surface were measured for both the hematopoietic CD34+ cells (stained purely red) and in-plane fragments of blood vessels (costained red and brown). The latter appear as either short cylindric or elliptic regions of vascular endothelium, depending on the orientation of the vessel within the histologic section. In addition, separation distances between nearest pairs of hematopoietic CD34+ cells and vessel fragments were determined. Identification of each structure on the digital image was optically verified using an OM36LED contour microscope (Microscope Store) with a 40× objective. Optical viewing of the biopsy specimens was thus used only to identify hematopoietic CD34+ cells and blood vessels, whose distances were then measured directly in the corresponding digital image via the SPOT software. Figure 1B is a representative image of a single biopsy microtome section showing measurements of 3 distances: hematopoietic CD34+ cell to the nearest bone trabecula surface (HCD34-BTS), blood vessel fragment to the nearest bone trabecula surface (BV-BTS), and distances separating hematopoietic CD34+ cells from their nearest blood vessel fragment (HCD34-BV). In all cases, an intersection thickness of 20 μm was maintained when more than 1 microtome section per biopsy specimen was available (2 of the 12 patients), thus ensuring the same tissue structure was not measured in duplicate.
To correctly assess the spatial distribution of hematopoietic CD34+ cells or blood vessels with respect to their distances from the nearest bone trabecula, we normalized total cell or vessel fragment counts to the available area of bone marrow visible within the biopsy image. Bone marrow area was calculated by constructing concentric layers 50 μm thick from the surfaces of all bone trabeculae. First, each original bone marrow biopsy image was manually segmented, using Adobe Photoshop, to reveal bone trabeculae in regions where hematopoietic CD34+ and vessel fragments were to be counted (Fig. 2A). After this step, each image was saved and converted to gray scale. A 2-pixel gaussian blur filter was applied, and a threshold was subsequently applied to each image to create a binary image of the biopsy core (Fig. 2B). An edge dilation algorithm was then used to expand the trabecula image in 50-μm increments, and each dilated image was then saved for later use. Our sample size did not permit studies of spatial gradients indexed to either subject age or marrow cellularity, and thus no attempt was made to segment the marrow adipocytes within the images; consequently, all areal measurements were made of total bone marrow and not specifically of red bone marrow.
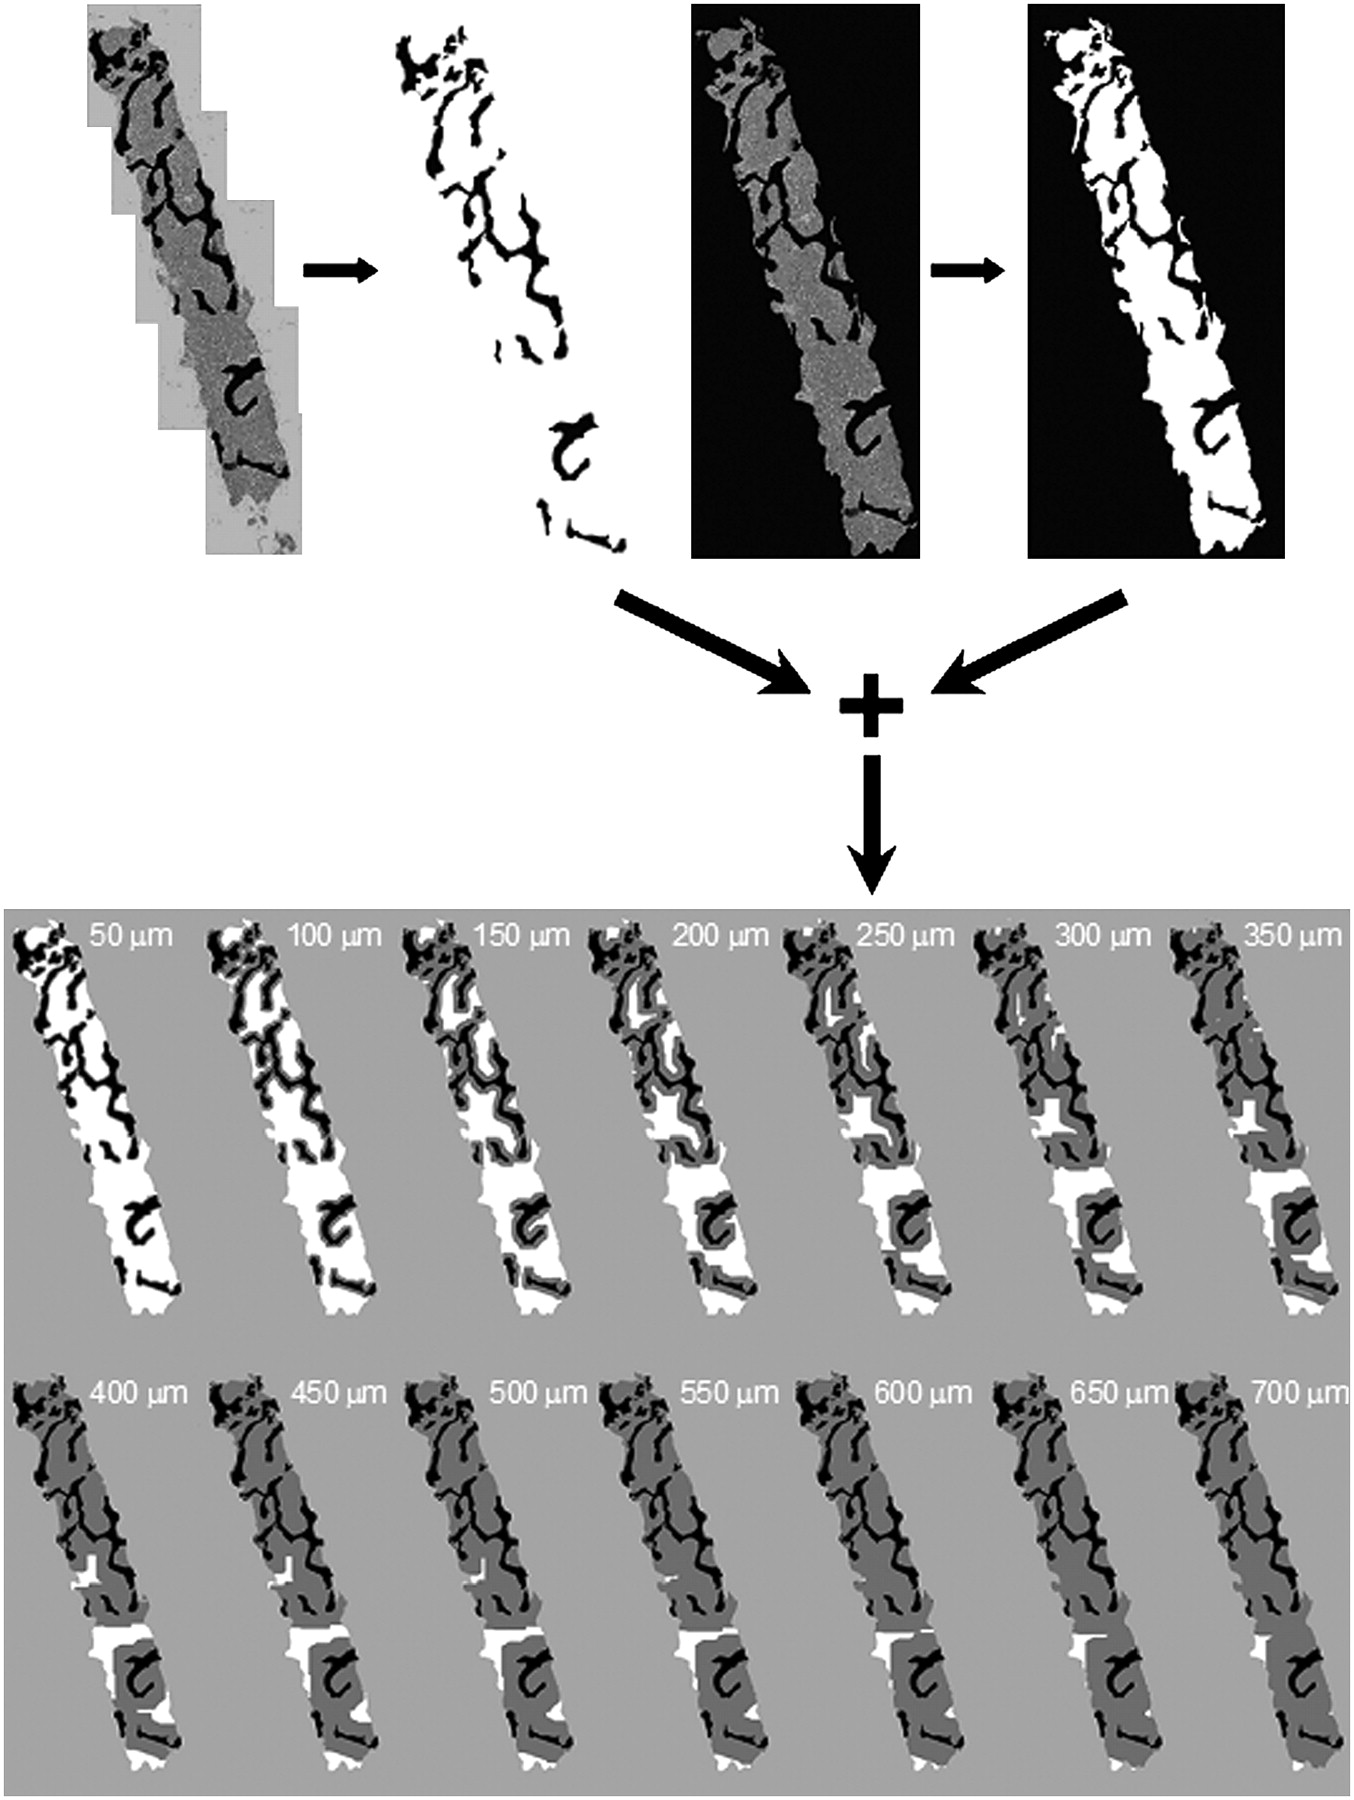
Image-processing steps to determine 50-μm areal contours from all surfaces of bone trabeculae.
The original segmented color image was then further segmented to exclude all image pixels not associated with bone marrow within the measurement area (Fig. 2C). This image was then converted to gray scale, filtered, and again subjected to a threshold using the previously described process. This step created a binary image displaying only the total marrow regions of the biopsy specimen (Fig. 2D). Final image sets depicting trabecula dilation in 50-μm increments were obtained by merging the dilated trabecula image and the original binary bone marrow image, using the SPOT Image processing software (Fig. 2E). Gray areas depict the dilated regions, whereas white pixels depict deeper bone marrow beyond the current contour thickness. ImageJ software (National Institutes of Health) was used to report areas of total bone marrow in each merged image by determining the number of white pixels in each subsequent image (Fig. 2E). In the total 14 slides analyzed in this fashion, no hematopoietic CD34+ cells or blood vessels were found at depths exceeding 700 μm from the bone surfaces, which comprised on average some 98% of the total marrow space visible within the biopsy images (2% in Fig. 2E at 700-μm dilation).
During tissue sectioning and staining, various artifacts such as separation of marrow from bone trabeculae or dislocation of bone trabeculae could potentially occur (Fig. 1A); consequently, adjustments were made to correct for these problems. When a bone trabecula appeared to be missing, but a clearly defined anatomic trabecular space was present, measurements were made to the edge of the region interface. A similar approach was used when an image displayed a bone trabecula that was mechanically pulled away from the surface of the tissue section. No measurements were made to the outer perimeter of the biopsy image because no information on the structures beyond the core boundaries was present.
For each specimen, HCD34-BTS and BV-BTS distances were sorted into intervals of 50 μm and normalized to the respective area of total bone marrow present at that marrow depth. For example, the areal concentration of hematopoietic CD34+ cells at a distance interval x for specimen s,  , is given as
 Eq. 1where
  is the number of hematopoietic CD34+ cells counted at distance interval x for specimen s, and
  is the area of bone marrow digitally observed at a distance interval x in specimen s using the techniques highlighted in Figure 2. At each distance interval, a specimen-weighted mean cell concentration was determined taking into account the total marrow area viewed per specimen:
 Eq. 2Values of the specimen weighting factors fs are given in Table 1. Weighted SDs of the mean cell concentrations were assigned in a similar manner:
 Eq. 3where ns is 14 in this study. A similar analysis was performed for measurements of the mean concentration of blood vessel fragments as a function of marrow depth. Separation distances between blood vessels and hematopoietic CD34+ cells were recorded as a sample-weighted frequency distribution. In the discussions below, the term concentration will refer to the measurements described here and will thus imply an areal assessment in units of cells or vessel fragments/mm2.
RESULTS
Hematopoietic CD34+ Cells
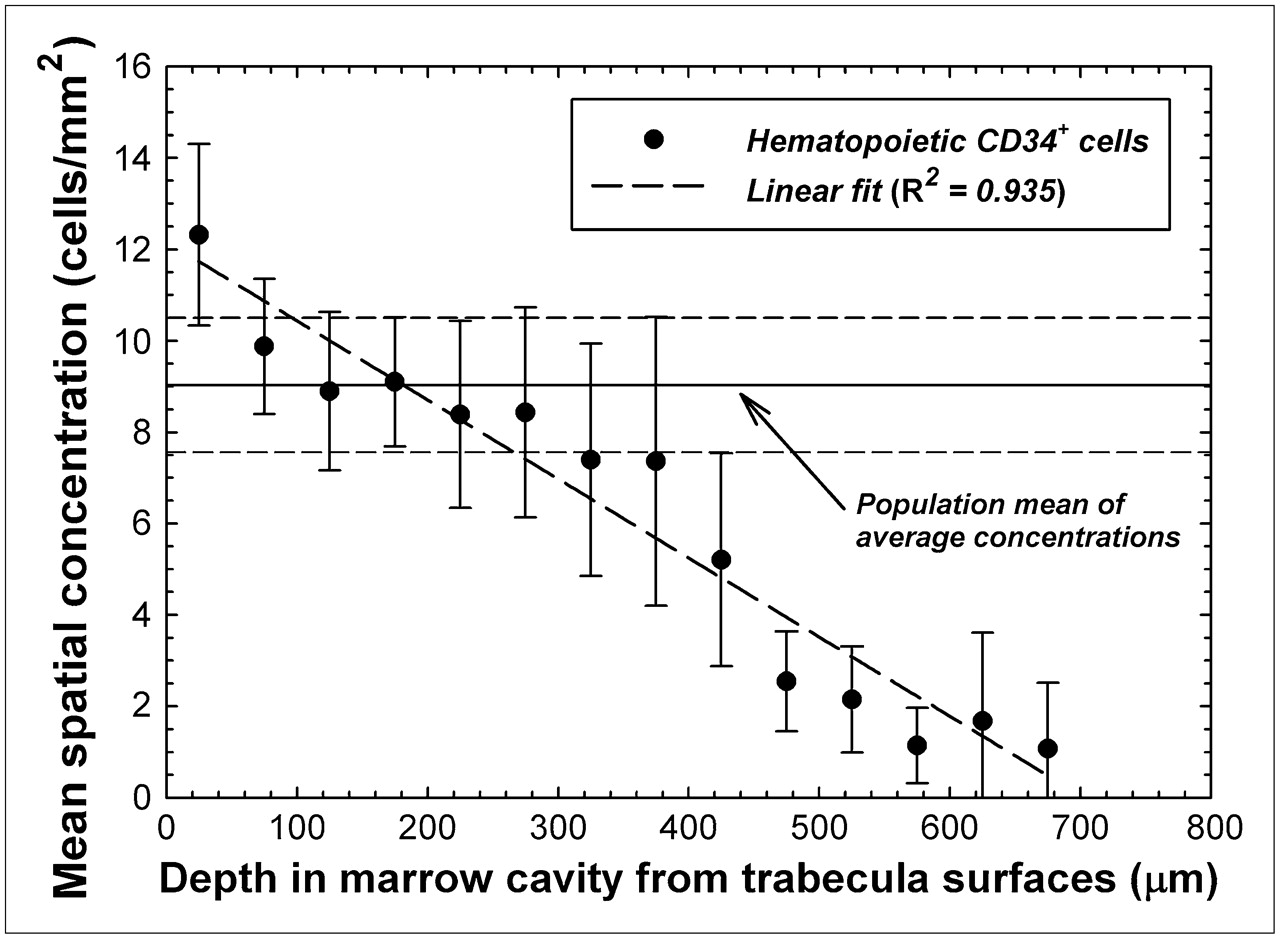
Table 1 lists the values for total marrow area and the total counts of hematopoietic CD34+ cells obtained in this study. Simple ratios of total cell count to total marrow area thus describe the average cellular concentration for each specimen; these concentrations ranged from 3.81 cells/mm2 for specimen 5 (fs = 0.13) to 39.35 cells/mm2 for specimen 7B (fs = 0.01). Averaging cell concentrations across all 14 specimens yields a mean of 9.03 ± 1.47 hematopoietic CD34+ cells/mm2. Further analysis of the data for each 50-μm interval within the marrow cavities, however, suggests a spatial gradient in cellular concentration as shown in Figure 3. In the first 50 μm from the bone trabecula surfaces (a marrow region comprising 20% ± 3% of total bone marrow), the mean spatial concentration is 12.3 ± 1.98 cells/mm2—36% higher than the mean average concentration. At marrow depths of 50–300 μm (comprising 64% ± 2% of total bone marrow), the mean spatial concentration decreases but is generally in the range of the mean average concentration. At marrow depths beyond 300 μm (comprising the remaining 16% ± 1% of total bone marrow), the mean spatial concentration of CD34+ cells becomes increasingly smaller. As shown in Figure 3, the cellular concentration of hematopoietic CD34+ cells in our study population follows a linear pattern, with depth in bone marrow (R2 = 0.935) declining roughly 2% for every 100 μm.

Mean spatial concentration of hematopoietic CD34+ cells as function of distance into bone marrow cavities of iliac crest. Data points indicate specimen-averaged mean values binned every 50 μm, and dashed line represents linear fit to data. Horizontal lines indicate mean and SD of average concentrations seen across study population.
Blood Vessels
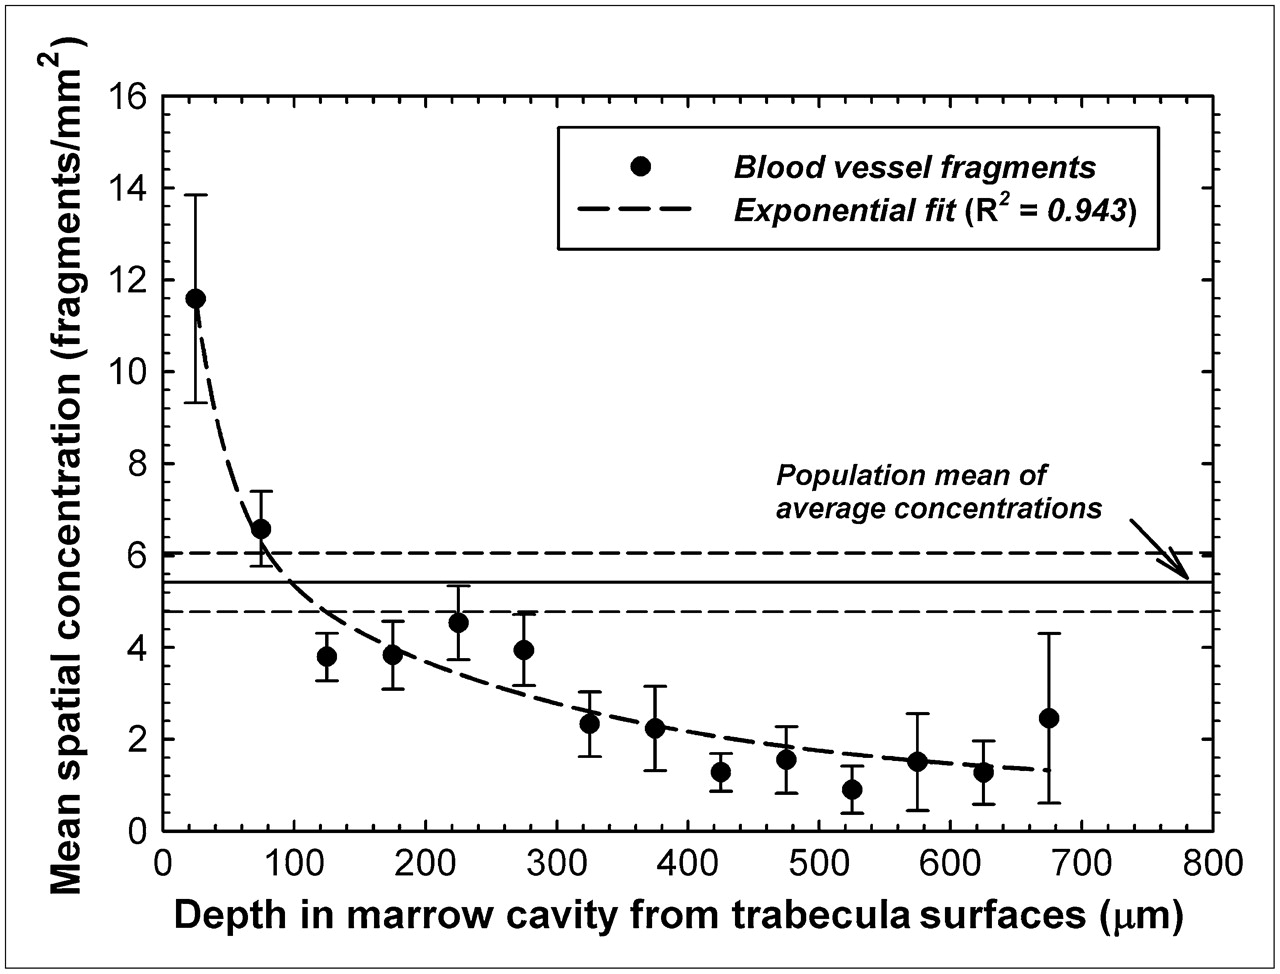
An identical analysis was performed investigating the potential of a spatial gradient in the concentration of blood vessel fragments seen in sections of human bone marrow tissue. Average concentrations of vessel fragments ranged from 2.65 fragments/mm2 for specimen 7 (fs = 0.03) to 16.3 fragments/mm2 for specimen 14 (fs = 0.03). The study mean of these average concentrations is thus 5.42 ± 0.64 vessel fragments/mm2 and is shown as a horizontal solid line in Figure 4. In contrast to the data of Figure 3, a more pronounced spatial gradient is seen for blood vessel fragments than was indicated for the hematopoietic CD34+ cells. The mean spatial concentration of blood vessels is 11.6 ± 2.3 vessel fragments/mm2 within the first 50 μm of the bone trabecula surfaces (∼2.1 times the mean average concentration) and is generally about 1–2 vessels/ mm2 at marrow depths beyond 400 μm. The spatial pattern of mean vessel fragment concentration closely follows an exponential function with depth (R2 = 0.943) as in Figure 4.

Mean spatial concentrations of blood vessel fragments as function of distance into bone marrow cavities of iliac crest. Data points indicate specimen-averaged mean values binned every 50 μm, and dashed line represents exponential fit to data. Horizontal lines indicate mean and SD of average concentrations seen across study population.
Distances Between Hematopoietic CD34+ Cells and Blood Vessels
Figure 5 gives the relative frequencies of intercellular distances between hematopoietic CD34+ cells and marrow blood vessels. The data indicate that approximately 11% of the hematopoietic CD34+ cells are within 50 μm of the nearest vessel structure, whereas an additional 18.5% of these cells are within 50–100 μm of the nearest vessel structure. The data follow a lognormal distributional fit with an R2 value of 0.979, indicating a most probable separation distance of about 60 μm.
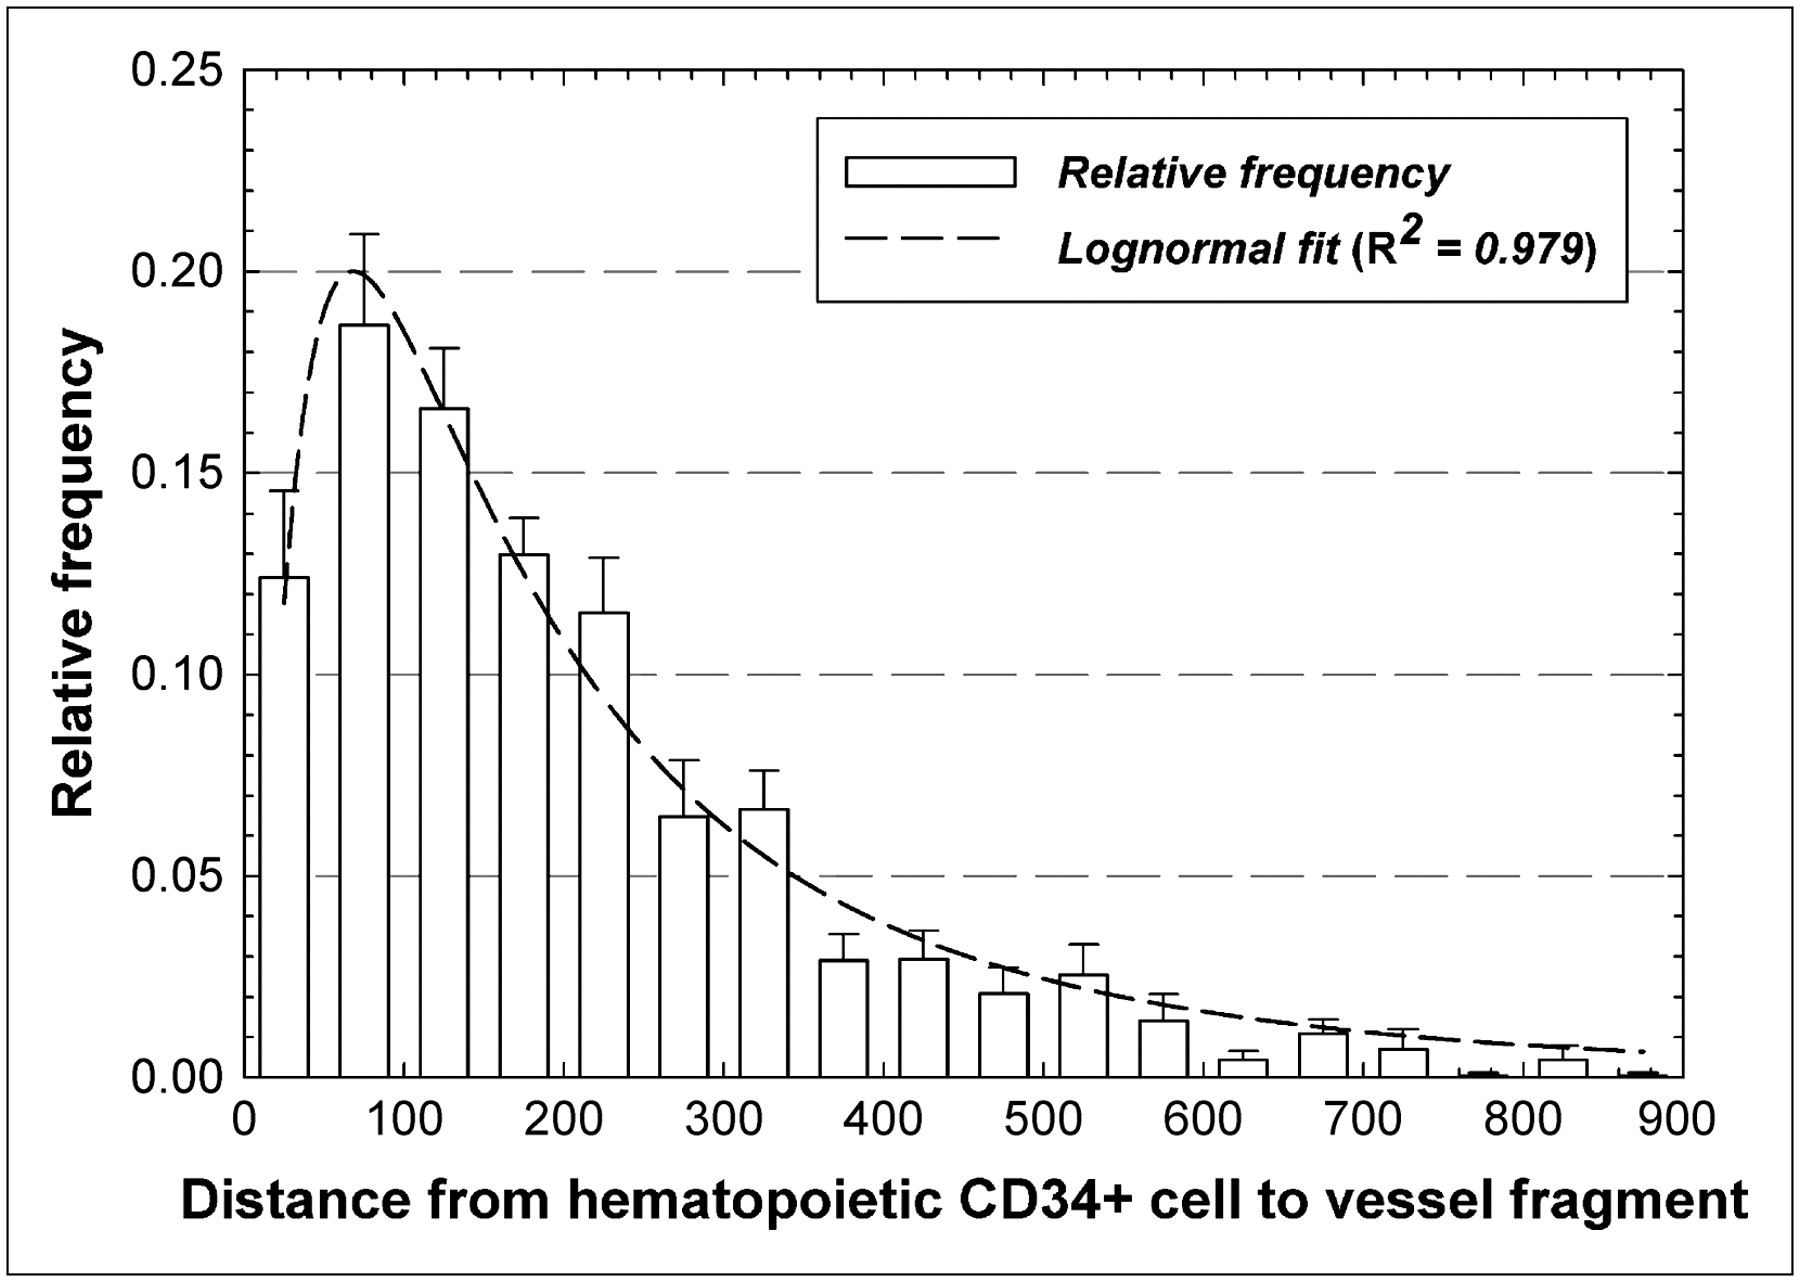
Frequency distribution of distances separating pairs of hematopoietic CD34+ cells and blood vessels within marrow cavities of iliac crest. Dashed line represents lognormal fit to data.
DISCUSSION
The data presented in Figures 3 and 4 support the hypothesis that CD34+ hematopoietic stem and progenitor cells, as well as the blood vessels, follow a spatial gradient within the marrow cavities of human cancellous bone. The data were derived from immunohistochemical staining and image analysis of histologic sections of biopsy cores of normal bone marrow taken from the iliac crest. This particular skeletal site has certain advantages for a study of this nature, because the os coxae is not subject to directionally specific biomechanical loading and thus the spatial orientation of the bone trabeculae within the iliac crest has been shown to be fairly isotropic (17). It remains to be seen whether the linear and exponential spatial distributions of Figures 3 and 4, respectively, would be similarly valid in those bone sites with highly anisotropic trabeculae such as in the femoral head and neck. Other advantages to iliac crest biopsies are that they are regularly performed in clinical practice for evaluation of marrow disease and that the os coxae accounts for roughly 20% of all hematopoietically active bone marrow in adults—the largest percentage of any other skeletal site (1). Accordingly, the present study can be expanded to include a larger subject population as needed to characterize any potential dependence of these spatial gradients on age, cellularity, disease, or treatment (e.g., chemotherapy).
Reliance on bone marrow biopsies does, however, lead to field-of-view limitations related to the finite size of the core biopsy needle. For example, the outer edges of the biopsy core shown in Figure 1 provide no information on adjacent tissues. As a result, the locations of hematopoietic CD34+ cells or vascular endothelium near the outer edges of the images are presently tallied to bone trabeculae interior to the image and not to trabeculae that may be present outside the core boundary. If trabeculae are present very near the outer edges of the core image, then the distributions of Figures 3 and 4 would tend to shift to smaller distances and the spatial gradients would potentially be greater than shown presently. However, the mean chord length for the iliac crest is approximately 1,500 μm (18) and the mean cell concentrations for both cell types are very small out to distances of about 700 μm, thus suggesting that edge effects might not be substantial. Nevertheless, further study using tissue sections with wider fields of view is warranted.
Another possible complication is that all cell–to–bone-surface measurements were made on 2-dimensional images of the iliac crest spongiosa, whereas truly 3D measurements would be useful in dosimetry modeling studies. Nevertheless, stereologic arguments would suggest that if sufficient numbers of 2-dimensional distances were taken for the subject specimens and for multiple and sufficiently distant microtome sections of each biopsy specimen, the results from multiple 2-dimensional images should closely approximate their 3D distribution. This assumption is further supported by the fact that the bone trabeculae are isotropically arranged in the os coxae, and thus sampling of different core angles would not be required (19).
Although larger fields of view and 3D image analyses should be pursued to further validate the distributions shown here, it is clear that the spatial gradients seen in the mouse femur study of Cui et al. (16) are also present in human bone marrow. In the mouse femur, colony-forming cells responding to IL-3 demonstrated an approximately lognormal concentration gradient with distance away from the corticomedullary interface moving toward the femoral central artery. In their study, a distributional peak was observed at approximately 50 μm, a region shown in Figure 3 to be of a higher concentration of hematopoietic CD34+ cells in human iliac crest spongiosa.
Recent studies have indicated that the osteoprogenitor cells are localized near the bone surfaces, perhaps out to 50 μm from the trabecular surfaces (20,21). The findings of the present study are thus congruent with the growing recognition of the functional and spatial interaction of hematopoiesis and osteoprogenitors. Some data suggest a common marrow progenitor for both osteoblasts and hematopoietic stem cells after transplantation (22); an important role for a matrix glycoprotein, osteopontin, and hematopoietic stem cell number and function (23); and the regulation of the hematopoietic stem cell niche by osteoblastic cells (24,25).
Given further confirmation of the cell concentration data shown in Figures 3 and 4 (e.g., wider fields of view, 3D imaging sets, and other skeletal sites), values of relative cell concentration with depth could conceivably be applied in marrow dosimetry models for improved estimates of target cell dose (26). In cases in which a radiopharmaceutical is uniformly distributed in the red bone marrow and the particle energy range is high (e.g., 90Y β-particles), the absorbed dose to the hematopoietic stem and progenitor cells would be faithfully represented by the mean absorbed dose to regions of red bone marrow tissue, as is current dosimetry practice, and thus the presence or absence of a spatial gradient in cell concentration would be inconsequential (i.e., all cells receive the same absorbed dose regardless of their location in the marrow cavities). If, on the other hand, the radiopharmaceutical is nonuniformly distributed (e.g., bone surfaces) and the particle range is low (e.g., α-particles or low-energy β-particles), then a spatial gradient in absorbed dose would exist and thus (according to the data of Fig. 3) the dose averaged over the entire bone marrow cavity would not faithfully represent the dose actually seen by many of the hematopoietic stem and progenitor cells close to the bone trabecula surfaces.
Current marrow dosimetry techniques implicitly assume that the spatial concentration of target cells is uniform across the marrow cavities and invariant with depth in bone marrow. Consider for a moment a radiopharmaceutical distributed in source region rS (e.g., surfaces of the bone trabeculae or cellular elements in the marrow tissues). According to the traditional MIRD schema, the mean absorbed dose to the red bone marrow in a given skeletal region would be given as Eq. 4where ÃS is the integral number of decays in the source tissue, ΔI is the energy emitted per decay particle i, mRBM is the total mass of red bone marrow (RBM) in the skeletal region of interest, and ϕ(RBM ← rS), Φ(RBM ← rS), and S(RBM ← rS) are the absorbed fraction, specific absorbed fraction, and radionuclide S value, respectively. The red bone marrow in both the mass term and the absorbed fraction terms of Equation 4 is the total RBM within the skeletal site. If, however, the red bone marrow in the dosimetric model could be subdivided as a function of distance x from the trabecular surfaces (similar to that shown digitally in Fig. 2), then Equation 4 could be reformulated as follows:
 Eq. 5where
  is a distance-dependent weighting factor given as the mean fractional mass (or volume) of red bone marrow at marrow depth x; mRBM,x and ϕ(RBMx ← rS) are, respectively, the mass of and absorbed fraction to the red bone marrow at that same depth; and S(RBMx ← rS) is the radionuclide S value for marrow depth x. Values of
  for the present study (reported here as areal values, although volumetric fractions would ideally be used) are shown in Figures 6A and 6B as solid lines. Inherent in Equation 5, however, is the assumption that the target cell concentration is constant with marrow depth and that the fraction of total target cells at depth x is directly proportional to the marrow area (or volume) at depth x.

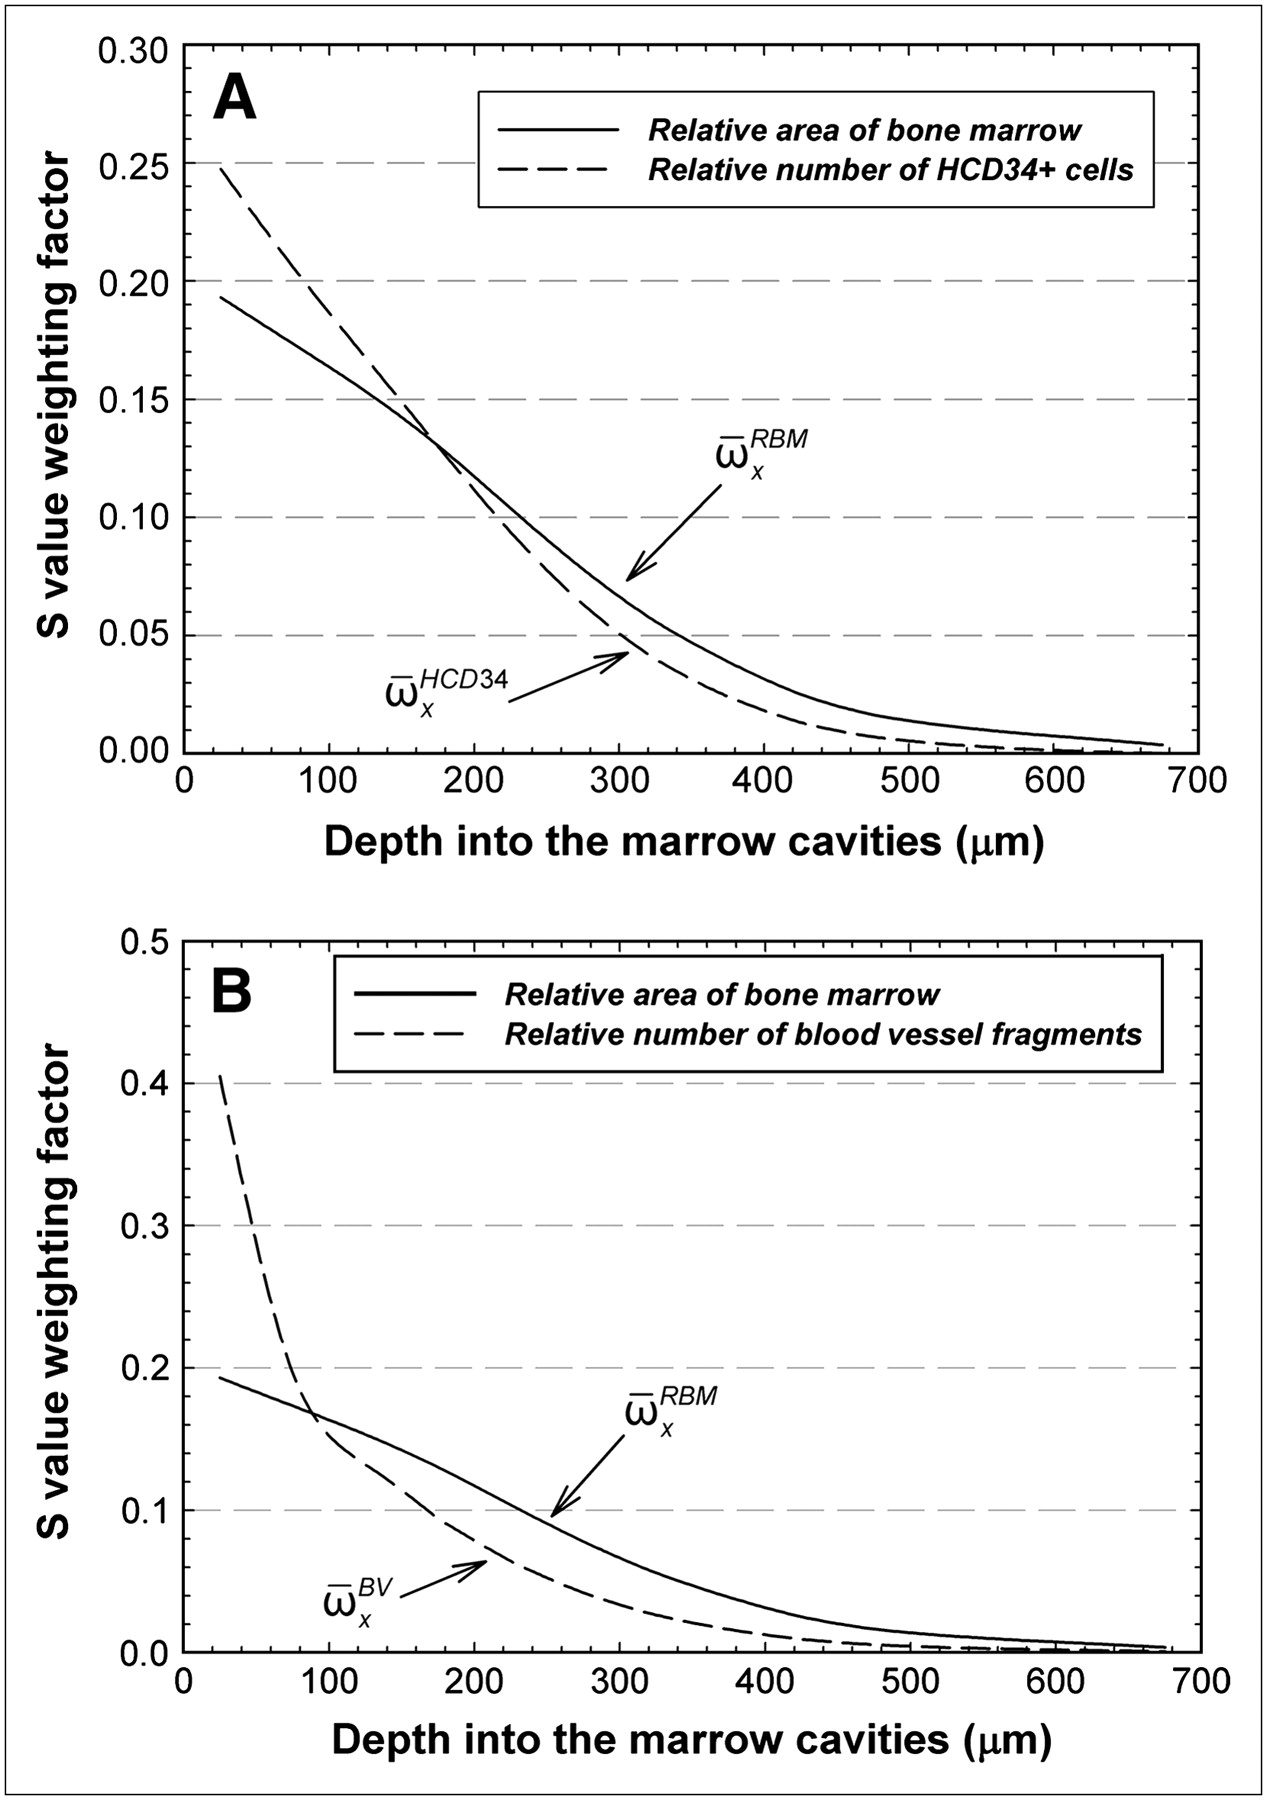
Distance-dependent weighting factors for radionuclide S values given in voxel-based skeletal dosimetry models. Solid lines indicate fraction of total area of bone marrow seen as function of distance into marrow cavities of iliac crest (average for the 14 specimens in current study). Dashed lines indicate relative number of hematopoietic CD34+ cells (A) or blood vessel fragments as function of distance into marrow cavities (B). HCD34+ = hematopoietic CD34+.
Values of  in Figure 6A can be scaled by the data of Figure 3 and then renormalized to yield an alternative weighting factor,
  , representing the relative number of hematopoietic CD34+ cells at marrow depth x (dashed line in Fig. 6A). Replacement of
  with
with  in Equation 5 thus yields the mean absorbed dose to the target cells of interest (not the mean RBM dose):
 Eq. 6Equation 6 with values of
  would thus more heavily weight the dose to bone marrow within its first 150 μm from the bone surfaces (∼54% of total bone marrow in the iliac crest) than would Equation 5 with values of
  . Conversely, less weight would be given to the marrow dose at greater depths, for which the value of
  tends to overestimate the number of target cells. For example, the ratio of
  to
to  is 1.28 within the first 50 μm of the marrow cavities but is only 0.43 at a marrow depth of 450–500 μm. Again, these differences in distance-dependent weighting factors are important only for scenarios in which the radiopharmaceutical delivers a nonuniform absorbed dose across the marrow cavities, as would be seen for bone surface deposition, or perhaps antibody binding to marrow cellular elements that themselves are nonuniformly distributed in the marrow spaces.
A similar refinement of Equation 5 can be made for the absorbed dose to blood vessels in normal bone marrow through exponential reweighting of values of  to yield a new weighting factor
  as shown in Figure 6B (dashed curve):
 Eq. 7Ratios of
  to
to  as a function of depth indicate that the estimates of the mean absorbed dose to the vascular endothelium via Equation 7 would require enhanced weighting of the RBM absorbed at marrow depths of less than 100 μm (weighting factor ratio of 2.1 at 0–50 μm) and reduced weighting of the RBM absorbed dose at greater depths (ratio of only 0.33 at 450–500 μm).
For current 1D chord-based skeletal dosimetry models (4,5), calculations of the ϕ(RBMx ← rS) are not feasible because the position of the electron energy deposition events cannot be indexed to the region of bone marrow at known distances from the 3D bone trabecula surfaces. However, 3D image-based skeletal dosimetry models (6,7) can readily tabulate values of the absorbed fraction indexed to the voxel depth within the marrow cavities, at least to the resolution of the microimages on which they are based. Similarly, the mass of red bone marrow (and thus the radionuclide S value) as a function of distance x from the bone surfaces can be determined using 3D digital images of the trabecular microstructure.
The clinical implications of a spatial gradient of target cells in molecular radiotherapy can be significant. For example, it has generally been assumed that marrow toxicity can be lowered for surface-seeking radiopharmaceuticals if one chooses emitters of lower energy, such that particle ranges are shortened and less particle energy reaches deeper regions of the marrow cavity. However, the data of Figure 3 indicate that in these deeper regions, the concentration of target cells is lower than in regions immediately adjacent to the bone surfaces (within a few hundred micrometers). Consequently, the selection of a lower-energy β-emitter, whose ionization tracks terminate (at high linear energy transfer) in that first few hundred micrometers from the bone surfaces, might in fact enhance (not decrease) marrow toxicity in comparison with particles of higher-energy emitters that traverse that same tissue region (at lower linear energy transfer). Although possibly acceptable for conditioning for hematopoietic cell transplantation, in which ablation of recipient hematopoiesis is desirable, this property is a disadvantage in other nontransplant therapies. Again, the spatial gradient of marrow target cells in human cancellous bone should further be explored to allow a better understanding of these issues in the selection of optimal particle energies for enhanced therapeutic response.
In addition to their dosimetric consequences, the data regarding vascular distances and distances between hematopoietic stem and progenitor cells and blood vessels may have clinical implications in both molecular radiotherapy and bone marrow transplantation. Data in Figure 5 would indicate that blood vessels and CD34+ hematopoietic cells share a similar spatial niche in human cancellous bone marrow. In molecular radiotherapy, high radiation-absorbed doses to the hematopoietic stem and progenitor cells will likely be delivered to the marrow vasculature as well. Additional studies have demonstrated that hematopoietic stem cells develop from vascular endothelium in the embryo and fetus (27). This interaction between these 2 tissues appears to be supported by their close proximity as shown in the lognormal distribution of Figure 5. In bone marrow transplantation, the use of radioimmunotherapy for myeloablation has the potential to spare nontarget tissues of the body and improve the efficacy of transplantation (28). Nevertheless, ablation of the hematopoietic stem and progenitor cells may also result in potential vasculature damage to the marrow tissues. Further investigation is thus needed into the implications of vascular irradiation on the ability of irradiated marrow tissues to subsequently support transplanted marrow stem cells and other grafted tissues.
Our studies were conducted on normocellular bone marrow specimens in which no disease was evident. The spatial distributions of the normal stem cells and blood vessels may be different in hypocellular marrow or in marrow that is diseased, such as that affected by medical conditions resulting in fibrosis or by cancer. Different types of cancer have different skeletal distributions. For example, lymphomas tend to be peritrabecular, epithelial cancers tend to exist in focal aggregates, and leukemias are diffusely infiltrative. Accordingly, such conditions may considerably alter the spatial distribution of the marrow stem cells, and additional studies are thus needed in this regard. Fortunately, the immunohistochemical staining and image-processing techniques presented in this study of normocellular marrow can readily be extended to the study of cellular spatial gradients in bone marrow altered by metabolic or metastatic bone disease.
CONCLUSION
Study results confirm that previous measurements of a spatial gradient of hematopoietic stem and progenitor cells in mouse femur are seen as well within human cancellous bone. The dosimetric implication of these results may be significant for those scenarios in which the absorbed dose itself is nonuniformly delivered across the marrow tissues, as would be the case for a low-energy β- or α-particle emitter localized on the bone surfaces. Under these conditions, the mean value of the absorbed dose to red bone marrow may not realistically represent the absorbed dose actually delivered to the target cells of interest. Techniques for modifying the MIRD schema to account for a spatial gradient of target cells are presented. These techniques may be implemented with 3D image-based models of the trabecular microarchitecture (6,7). Such an approach permits a computational bridge between image-based dosimetry techniques and cellular-level information on the target cell type and location.
The results of this study should be confirmed using larger tissue sections, which would alleviate the limitations of field of view and could potentially permit direct measurements of the 3D microarchitecture of human cancellous bone. Development of 3D models that allow for viewing of multiple marrow cavities may further improve our knowledge of the location of stem and progenitor cells and the marrow vasculature. Potentially greater delineation of cell types is possible if additional immunohistochemical agents are used to directly differentiate between cell types. Additional investigations of the ways in which disease may change the spatial distribution of hematopoietic stem cells and their progenitors in human bone marrow are also merited. Improved descriptions of each cell type, with respect to normal and pathologic bone marrow, along with the hematopoietic lineage may allow for other absorbed dose weighting schemes that could further improve dose–response relationships with respect to specific forms of marrow toxicity.
Acknowledgments
We thank Tim Vaught at the UF McKnight Brain Institute for his assistance with and expertise in the optical imaging facilities. We also thank Elaine Dooley at the Shands Rocky Point Immunohistology Laboratory for her assistance with and expertise in specimen preparation and antigen staining. This work was supported by grant RO1 CA96411 from the National Cancer Institute with the University of Florida and by the U.S. Department of Energy.
Footnotes
-
COPYRIGHT © 2007 by the Society of Nuclear Medicine, Inc.
References
- Received for publication August 1, 2006.
- Accepted for publication September 25, 2006.


Jump to section
Related Articles
Cited By...
- Specific Uptake in the Bone Marrow Causes High Absorbed Red Marrow Doses During [177Lu]Lu-DOTATATE Treatment
- Specific Uptake in the Bone Marrow Causes High Absorbed Red Marrow Doses During [177Lu]Lu-DOTATATE Treatment
- The relationship between bone, hemopoietic stem cells, and vasculature
- Spatial gradients of blood vessels and hematopoietic stem and progenitor cells within the marrow cavities of the human skeleton
- Further Explorations of Cellular Uptake of Radioactivity
- Toward Patient-Friendly Cell-Level Dosimetry