


Abstract
α-Particles are of current interest in radionuclide therapy due to their short range and high rates of energy transfer to target tissues. Published values of α-particle absorbed fraction φ in the skeletal tissues, as needed for patient-specific dosimetry under the MIRD schema, do not generally account for its variation with particle energy or skeletal site. Furthermore, variations in α-particle absorbed fraction with marrow cellularity have yet to be fully considered. Methods: In this study, a 3-dimensional (3D) chord-based radiation transport model (or 3D-CBIST) is presented, which combines (a) chord-based techniques for tracking α-particles across bone trabeculae, endosteum, and marrow cavities and (b) a spatial model of the marrow tissues that explicitly considers the presence of marrow adipocytes. Chord-length distributions are taken from a 44-y male subject (ICRP [International Commission on Radiological Protection] Reference Male) and are identical to those used currently for clinical dose estimates for β-particle emitters. Results: Values of φ(active marrow←active marrow) given by the 3D-CBIST model are shown to be considerably lower than φ = 1.0 assumed under the ICRP Publication 30 and 2003 Eckerman bone models. For example, values of absorbed fraction for the self-dose to active bone marrow in the ribs, cervical vertebra, and parietal bone are 0.81, 0.80, and 0.55 for 6-MeV α-particles and are 0.74, 0.72, and 0.43 for 9-MeV α-particles, where each is evaluated at ICRP reference cellularities in the 3D-CBIST model (72%, 72%, and 42%, respectively, at age 25 y). Conclusion: Improvements in patient-specific dosimetry of skeletal tissues require explicit consideration of not only changes in target mass with variable patient marrow cellularity (i.e., active marrow) but also corresponding changes in values of the absorbed fraction. The data given in this study provide a more-firm basis for application of the MIRD schema to patient-specific dosimetry for newly developing therapies using α-particle emitters.
Beta-particle emitters have played a prominent role in the development of radionuclide-based cancer therapy. More recently, increased interest has been shown in the potential of α-emitters for radioimmunotherapy, particularly for leukemia and micrometastases (1–4). α-Particles provide an attractive alternative to β-particles owing to their higher collisional stopping power (providing increased absorbed dose to tumor cells) and correspondingly shorter range (providing increased sparing of nontargeted tissues). Examples of α-emitters under clinical investigation for radionuclide therapy are listed in Table 1 (5). When α-emitters are localized at low-activity concentrations in targeted tissues, techniques of microdosimetry are generally required to characterize the frequency distribution of absorbed dose to individual target cells. At high-activity concentrations, as would be expected in clinical α-particle radioimmunotherapy, the variation in cellular dose is small, and macroscopic dosimetry techniques may be applied as formulated under the MIRD schema (6).
Candidate α-Particle Emitters for Radionuclide Therapy
At present, standardized values of absorbed fraction (φ) for α-particles in the skeletal tissues are limited to two principal sources: the International Commission on Radiological Protection (ICRP) in their Publication 30 (7) and the 2003 Eckerman model as published by Stabin and Siegel (8) for use in the OLINDA (Organ Level INternal Dose Assessment) code (9). Although the ICRP has provided many important updates to both physiologic and anatomic reference values for the skeleton (10, 11), no fundamental updates to its skeletal dosimetry model have been issued. The ICRP Publication 30 bone model, developed to provide a conservative dosimetric framework for radiation protection of the skeletal tissues, gives values of α-particle absorbed fraction that are independent of both particle energy and skeletal site. Literature sources cited as references for the ICRP 30 model include studies by Thorne (12, 13) and by Mays and Sears (14), in which simple geometric configurations were adopted such as infinite parallel planes (representing the bone–marrow interface) and spheres (representing the marrow space with an endosteum layer on its surface). The β-particle results of Whitwell and Spiers (15) are also used as reference values for α-particles irradiating the active marrow from bone volume sources. In the 2003 Eckerman model, an energy dependence is introduced for some source–target tissue combinations, whereas for others, values from the ICRP 30 model are adopted.
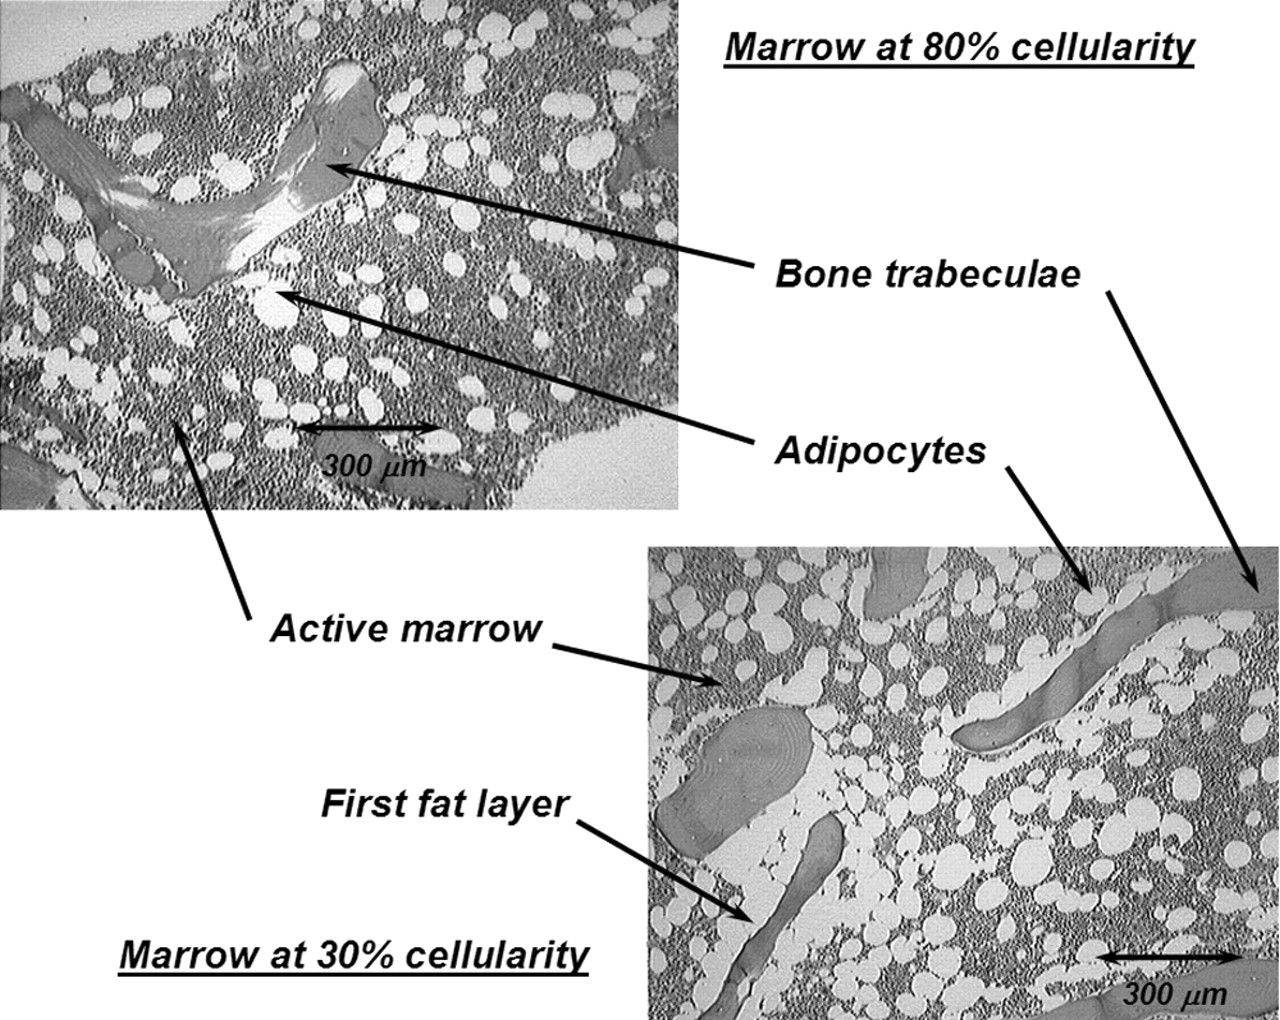
In the present study, an expanded model of α-particle transport in the skeletal tissues is given that explicitly accounts for absorbed fraction variations with not only particle energy but also with skeletal site and marrow cellularity. Each parameter is potentially important in improving the patient specificity of the skeletal dose estimate. As shown in Table 1, α-energies of clinically relevant radionuclides range from ∼5.5 to 9 MeV. In contrast, those of interest in occupational radiation protection (for which the ICRP 30 model was established) range from only ∼4 to 5.5 MeV. Furthermore, when bone-site-specific radionuclide therapies are applied, variations in the trabecular microarchitecture (bone trabeculae and marrow cavity sizes) may alter patterns of α-energy deposition beyond that predicted by a single skeletal-averaged set of absorbed fractions. Finally, marrow cellularity can vary greatly among different patients (16) and is not considered in either of the two existing models. As shown in Figure 1, adipocytes localized along the trabecular surfaces at low marrow cellularities can significantly reduce the α-particle energy available for deposition to active bone marrow.

Histology slides of normal human bone marrow at 2 different marrow cellularities. At lower cellularity, a greater proportion of bone trabecula surface is covered by adipocytes (i.e., the first fat layer).
MATERIALS AND METHODS
In this study, α-particle transport in the skeletal tissues is accomplished using techniques similar to those developed for electrons in models published by Eckerman and Stabin (17) and by Bouchet et al. (18). The 3-dimensional (3D) microstructure of individual bone trabeculae and marrow cavities are taken from the chord-length distributions published by Whitwell and Spiers (15) and Whitwell (19) at the University of Leeds for 7 skeletal sites from a 44-y male subject. The unique feature of the present model, however, is the use of a supplemental 3D spatial model of the active and inactive tissues within the marrow space. Through the use of range–energy relationships, absorbed fractions to active marrow, as well as bone endosteum and bone trabeculae, are calculated for α-particle emissions up to 10 MeV. The details of this 3D chord-based infinite spongiosa transport (3D-CBIST) model for skeletal dosimetry are outlined below. In the model, we adopt the following nomenclature to define various source and target tissues: TBV, trabecular bone volume; TBE, trabecular bone endosteum; TBS, trabecular bone surfaces; TAM, trabecular active (“red”) marrow; and TIM, trabecular inactive (“yellow”) marrow. The modifying phrase “infinite spongiosa transport” indicates that we are only considering α-transport within the tissues of trabecular spongiosa (marrow, endosteum, and bone trabeculae). Any cross-fire from cortical bone to the interior spongiosa regions of the skeletal site is thus ignored. Though this assumption is rarely valid for higher-energy β-particles in the skeleton (20), the model is considered to be quite adequate for α-particles even at energies approaching 10 MeV. For TBV sources, the radiopharmaceutical is assumed to be distributed uniformly within the volume of the bone trabeculae. Future extensions of the model may accommodate its variation with depth when the physical half-life exceeds bone remodeling half-times. Generally, however, TBS and TBE sources would be more appropriate for bone-seeking agents in radionuclide therapy. The former would correspond to agents initially incorporated in the osseous tissues at bone-remodeling sites, whereas the latter would correspond to agents directly targeting osteoblasts or osteoclasts.
Tissue Composition and Range–Energy Data
Elemental compositions and mass densities for the tissues of trabecular spongiosa were taken from Report 46 of the International Commission on Radiation Units and Measurements (ICRU) (21) (Table 2). Range–energy functions were calculated for active (red) marrow, inactive (yellow) marrow, and trabecular endosteum using the Bragg–Kleeman rule (22) with liquid water (23) as the reference media for range scaling:
 Eq. 1 where RT is the CSDA (continuous slow-down approximation) range in the desired tissue (TAM, TIM, or TBE), RH2O is the corresponding linear range in water, and ρT and ρH2O are their respective mass densities. In Equation 1, the effective atomic number of these tissues, AT (as well as AH2O), is calculated as:
 Eq. 2 where wi is the mass fraction for the ith element within that tissue. Trabecular bone was similarly scaled using ICRU Report 49 compact bone as the reference tissue (23). Tabular data for the CSDA range versus particle energy were thus created for all tissues for use by the transport code. Ranges at intermediate energies were assessed via interpolation of tabular values.
Elemental Composition (% by Mass) of Tissues of Skeletal Spongiosa
Spatial Model for Marrow Tissue Transport
As previously noted by Bolch et al. (24), the chord-based skeletal models of both Eckerman and Stabin (17) and of Bouchet et al. (18) were constructed in such a fashion that considerations of marrow cellularity could not be made explicitly during particle transport (only via energy-independent scaling of absorbed fractions after particle transport). To permit such considerations during α-particle transport, a spatial model of the marrow tissues was created as demonstrated schematically in Figure 2. Each model consists of 2 regions: (a) an inner sphere of marrow in which randomly selected marrow chords are started (each representing the potential trajectory of an α-particle track emitted within the active marrow or emerging from the endosteal layer into the marrow space), and (b) a buffer region in which marrow chords (and, thus, the α-particle tracks) may terminate, but not begin. The buffer region (scaled to the active marrow range of 10-MeV α-particles) thus ensures that the sampled marrow-cavity chord will always fully lie within tissues of the marrow spatial model. The 1,000-μm diameter of the marrow spatial model corresponds roughly to the nominal chord-length seen for marrow cavities in the Leeds 44-y male.

Geometric model used to partition sampled marrow cavity chords into subtrajectories of α-particle through active (red) marrow and inactive (yellow) marrow, the latter represented by individual adipocytes (white spheres).
As shown in Figure 2, regions of inactive (or yellow) marrow are simulated as a series of randomly placed spheric fat cells (adipocytes). Adipocyte diameters are randomly sampled from a 5-bin histogram (92, 72, 56, 40, and 20 μm) that approximate the gaussian distribution of sizes reported by Reverter et al. (25) in normal human bone marrow (mean diameter, 56.7 ± 5.6 μm). Marrow models of varying marrow cellularity (from 10% to 100%) are generated by increasing the number of randomly placed adipocytes within the marrow sphere. For marrow cellularities greater than 50%, adipocyte overlap is prohibited as cell clustering is only prominent at cellularities below 50% (26).
For marrow cellularities below 50%, the 50% cellularity model is modified through stepwise increases in adipocyte diameter (5% each) and by abandoning the restriction on adipocyte overlap. Adipocyte diameter increases (representing multicellular adipocyte clusters) are continued until the desired overall marrow cellularity is achieved. Transverse views through marrow models at cellularities of 70% (no cell clusters), 40% (few cell clusters), and 20% (multiple cell clusters) are shown in the lower portion of Figure 2. Note that in all 3D spatial models of the marrow space, neither of the bone trabeculae for the trabecular endosteum are represented; their influence on particle transport is handled separately by chord-based techniques as described.
Chord-Based Model for Spongiosa Tissue Transport
α-Particle transport in the present study is performed through random and alternate sampling of cumulative density functions (CDFs) for μ-random (external) chord-lengths across bone trabeculae (dT) and the marrow cavities (dMC) in each of the 7 skeletal sites of the Leeds 44-y male. Corresponding distributions under I-randomness (interior) are applied in regions of α-particle source emissions (27). For consistency with the sample preparation and scanning methods of the Leeds studies, we make a distinction between the marrow cavity (MC, total volume of tissue between bone trabeculae inclusive of the endosteal layer) and the marrow space (MS, total marrow tissue volume between bone trabeculae exclusive of the endosteal layer). Explicit treatment of the endosteal layer, as well as the active and inactive tissues of the bone marrow, is discussed below.
The transport methodology is best described by first considering an α-emitter uniformly distributed within the tissues of the bone trabeculae (i.e., TBV source). The transport code first randomly samples a bone chord-length dmaxT from the I-random CDFI (dmaxT) for the skeletal site of interest (e.g., cervical vertebra). This sampled chord-length is treated as the maximum possible distance that an α-particle may travel within its bone trabecula before entering the endosteal layer. The transport distance actually taken, dT, is thus uniformly sampled across this interval: [0, dmaxT]. The range–energy function for α-particles in bone tissue is then used to determine the total energy expended by the particle within that bone trabecula. If residual kinetic energy remains, the particle is further transported into (and potentially across) the adjacent endosteal layer.
For the α-particle emerging from a bone trabecula, a random marrow-cavity chord-length dMC is sampled under μ-randomness (CDFμ) for the same skeletal site. The value of dMC is at most composed of 2 endosteal chord-lengths (near and far side of the marrow cavity) and an intervening chord-length across the marrow space:
 Eq. 3 Values ofdE1 and dE2 (and thus dMS) are determined through uniform sampling of the cosine of the entry angle (η) across each 10-μm endosteal layer:
 Eq. 4 The assignment of dmaxT in this and in other chord-based skeletal models is discussed in Appendix A. If (dE1 + dE2) < dmaxT, then:
 Eq. 5 If, however, (dE1 + dE2) ≥ dmaxT, then both near and far endosteal chord-lengths are iteratively rescaled:
 The α-particle range–energy function in endosteal tissues is then used to determine the kinetic energy lost within the first endosteal layer. If residual kinetic energy still exists, and dMS > 0, the α-particle is further transported within the tissues of the marrow space.
At this point, the chord-length dMS is placed at a random location and direction within the transport region of the marrow spatial model (Fig. 2). Consider for the moment that dMS is given as chord A–B. This marrow space chord thus represents the potential trajectory of the α-particle emerging from the surface of the bone endosteum in which the first tissue encountered is active marrow. In this particular case, however, the particle has only sufficient kinetic energy to carry it from starting point A to point B* in the marrow tissues. During its traversal, the α-particle traverses a single adipocyte. Consequently, the particle trajectory A–B* can be divided into 3 marrow subtrajectories: dM1 (distance from point A to the adipocyte entry point), dM2 (distance across the adipocyte), and dM3 (distance from the adipocyte exit point to the particle termination point B*). Energy deposition to active marrow for this particle would be recorded only across active-marrow subtrajectories dM1 and dM3.
As another example, another sampled chord-length dMS might be positioned at chord C–D in Figure 2. In this case, the α-particle “sees” an adipocyte immediately on its emergence from the bone endosteum and must expend some kinetic energy within that fat cell before it enters (and then stops) within the active marrow tissues. As the fat fraction of the geometric model increases (marrow cellularity decreases), this scenario becomes more and more prevalent, thus simulating the presence and increased loss of α-particle energy in the first-fat layer for particles emerging from the trabecular endosteum. Furthermore, the α-particle in this example is able to fully travel the sampled chord-length dMS. In this case, residual kinetic energy still remains at point D and the particle is then transported across the endosteal chord-length dE2 on the far side of the marrow space (via methods described previously).
For a TAM source, transport calculations are performed as described above except that the starting value of dMC is selected from an I-random CDFI (dMC). The corresponding marrow-space chord, dMS, is then placed within the marrow spatial model at a point external to the adipocytes and partitioned into subtrajectories as described earlier. For TBE sources, a transport chord-length is selected uniformly across the interval [0,dE1] followed by transport in either bone (dT) or marrow tissues (dMS), depending on the emission angle. Similarly, for TBS sources of α-particles, they may be directed either within the adjacent bone trabeculae (dT) or across the full chord-length of the endosteal layer (dE1). If residual energy is still present at various tissue interfaces, the transport techniques described above are continued.
RESULTS
Tabulated values of absorbed fraction are presented in supplemental Appendix B (Tables 1B–12B) (available online only at http://jnm.snmjournals.org). A representative tabulation of these data is given in Table 3 for α-particle emissions within the various source tissues of the lumbar vertebrae of the Leeds 44-y male subject. For each source–target combination, energy deposition is tracked within the primary tissue (e.g., TAM←TAM), secondary tissue (e.g., TAM←TBE or TBS), or tertiary tissue (e.g., TAM←TBV) depending on the emission energy (and the resulting CSDA range) of the α-particle. Coefficients of variation (COVs) are ≤1% for primary targets and ≤5% for secondary targets. Errors in absorbed fractions to tertiary targets vary according to the source–target geometry and marrow cellularity selected. Values of COV for φ(TAM←TBV) and φ(TBV←TAM) (both separated by the bone endosteum) are below 20% for α-particle energies of >2.5 MeV. Endosteal and surface sources for α-particle emission yield absorbed fractions with COVs below 3% for both secondary and tertiary target tissues. For each source region, computation times for the 100% cellularity model are noted to be only ∼5 min on a 1-GHz Dell Dimension Pentium V workstation and are ∼1 h on the same system at low cellularities approaching 10%.
Absorbed Fractions to Active Bone Marrow (TAM) for α-Emissions Within Lumbar Vertebrae of Leeds 44-Year Male for Various Source Tissues and Marrow Cellularities
DISCUSSION
Absorbed Fractions to Active Bone Marrow
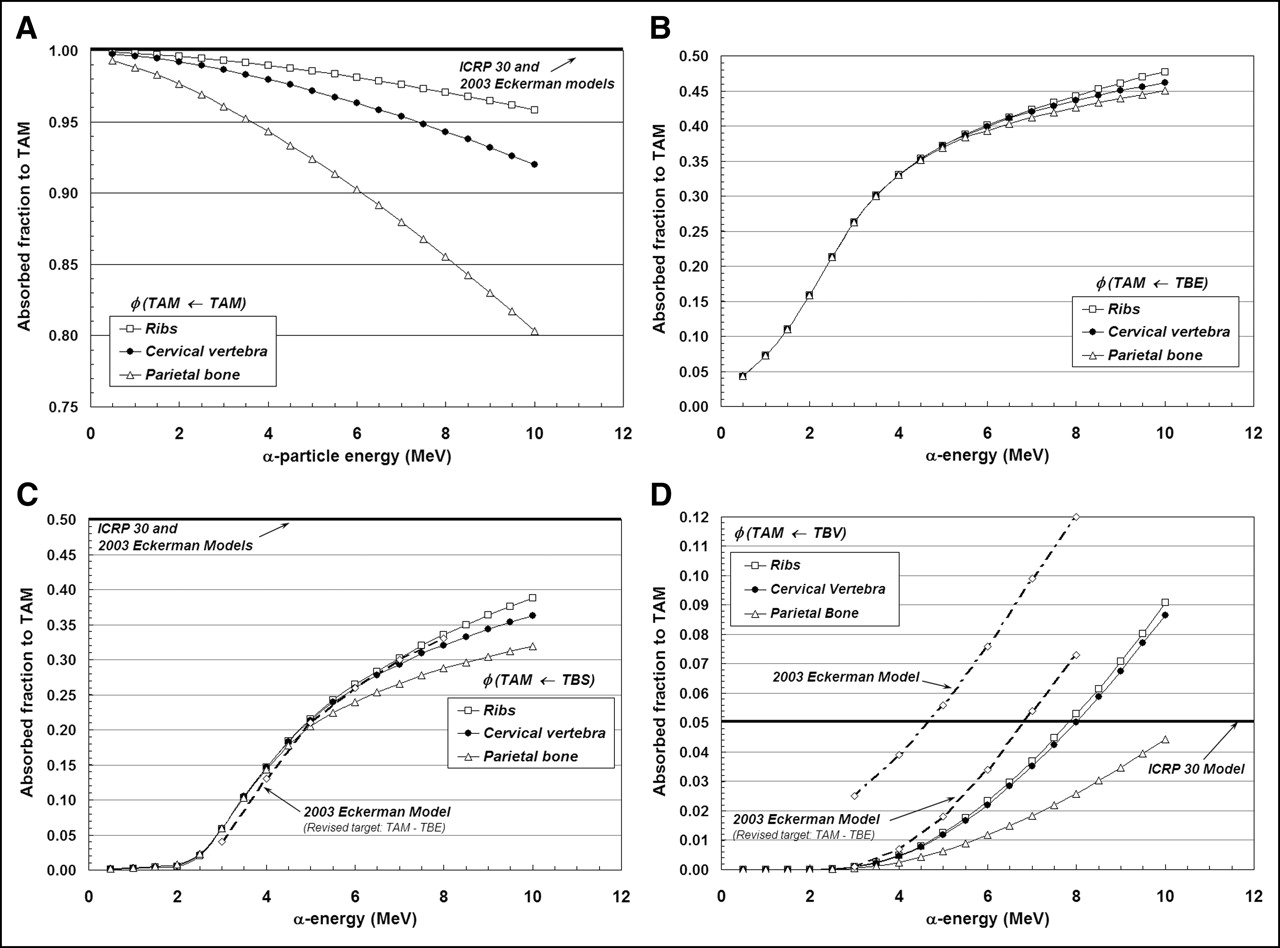
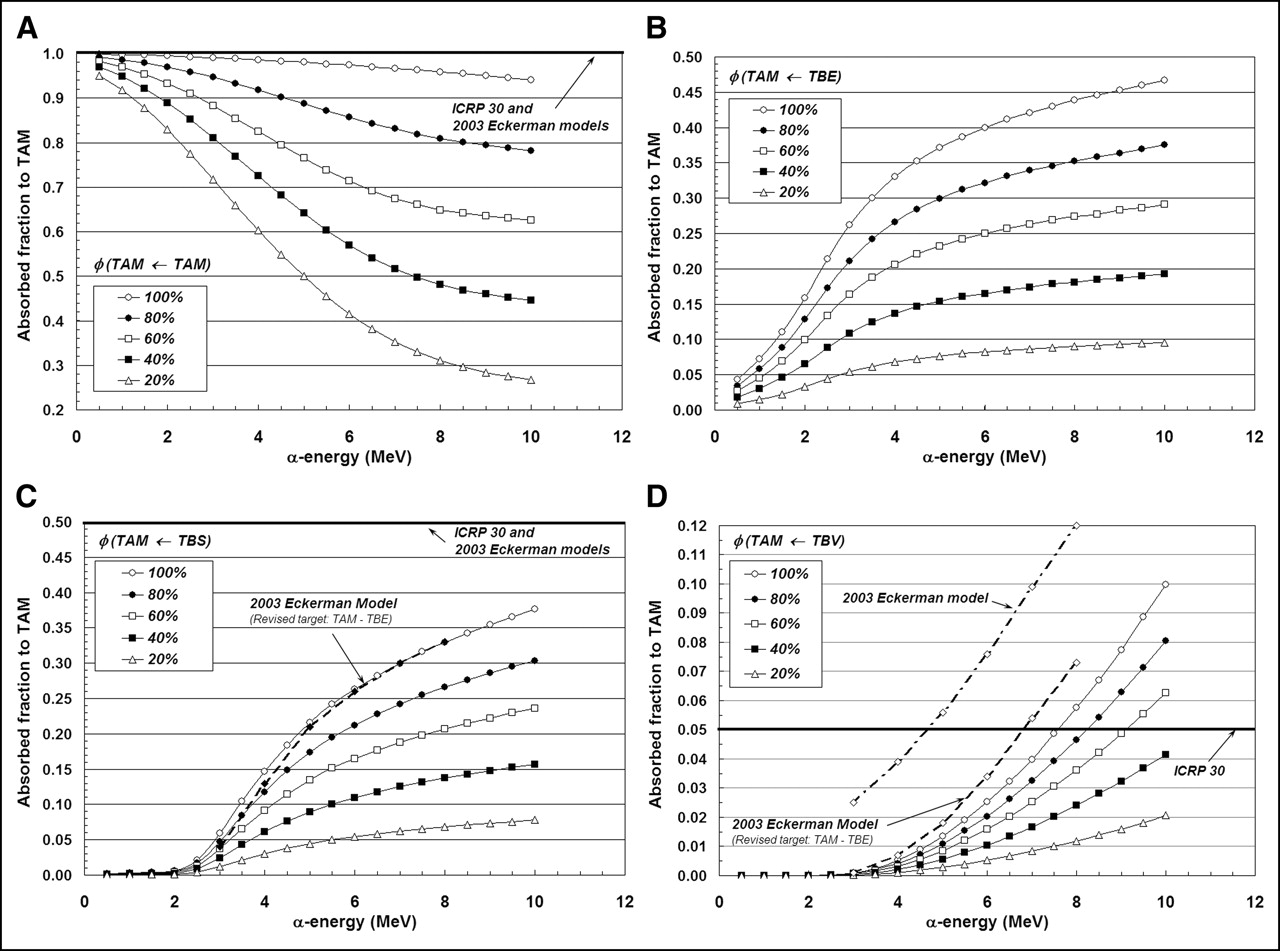
Figures 3A–3D display values of absorbed fraction to active bone marrow as a function of α-particle energy within 3 of the 7 skeletal sites of the Leeds 44-y male. Although the energy range of clinical interest extends down to only ∼5.5 MeV, values at very low energies are displayed as well for visual confirmation of the model (e.g., values of φ should approach unity when the source and target tissue are the same). In each case, the marrow cellularity is set to 100% and, thus, differences in energy dependence of the absorbed fraction are strictly related to differences in the trabecular microstructure of these bone sites. Their dependence on marrow cellularity is discussed separately.

Absorbed fractions for an active marrow target (100% cellularity) from active marrow source (TAM) (A), trabecular bone endosteum source (TBE) (B), trabecular bone surface source (TBS) (C), and trabecular bone volume source (TBV) (D).
The absorbed fraction for self-irradiation of the active bone marrow, φ(TAM←TAM), is shown in Figure 3A for the ribs, cervical vertebra, and parietal bone. At low energies, the absorbed fraction in each bone site is ∼1.0 and, thus, is closely approximated by the energy-independent value assumed under both the ICRP Publication 30 and 2003 Eckerman bone models. As the particle energy increases, however, an increasing amount of kinetic energy is lost to the bone trabeculae and endosteum, leaving less energy available for deposition to bone marrow. The parietal bone demonstrates the greatest divergence from the ICRP Publication 30 and 2003 Eckerman models at all energies (∼0.90 at 6 MeV and ∼0.80 at 10 MeV), as this particular bone site is characterized by relatively small marrow cavities and thick bone trabeculae (28).
Energy-dependent absorbed fractions to active bone marrow (100% cellular) are shown in Figure 3B for α-particles emitted uniformly within the 10-μm tissue layer of the bone endosteum (a source region not considered in the other 2 bone models). For this source tissue, the absorbed fraction to bone marrow is shown to be 0.043 at the lowest energy considered (500 keV) and increases to values of 0.48, 0.46, and 0.45 at 10 MeV in the ribs, cervical vertebra, and parietal bone, respectively. When the α-emitter is localized within the surfaces of the bone trabeculae (Fig. 3C), values of absorbed fraction to the marrow tissues are reduced at all energies as compared with a TBE source. In this case, the α-particle must exceed ∼2 MeV for it to have sufficient energy to penetrate the endosteal layer.
In contrast, the ICRP Publication 30 and 2003 Eckerman bone models assign a value of 0.5 to φ(TAM←TBS) independent of the α-particle emission energy (based on a planar half-space transport geometry). Furthermore, these models do not explicitly treat the endosteum and bone marrow as independent target tissues. At an emission energy of 6 MeV, for example, the ICRP Publication 30 and 2003 Eckerman bone models predict an α-particle dose to bone marrow 1.9, 1.9, and 2.1 times higher in the ribs, cervical vertebra, and parietal bone, respectively, than that given in the present study. However, when energy deposition to the endosteal layer is separately accounted for in the 2003 Eckerman model (dashed curve in Fig. 3C), excellent agreement is noted between the 2 model predictions.
Finally, energy-dependent values of φ(TAM←TBV) are shown in Figure 3D for α-particles emitted uniformly within the volume of the bone trabeculae. The ICRP Publication 30 model applies an energy-independent value, 0.05, to this source–target combination. Our 3D-CBIST model predicts values of φ(TAM←TBV) less than 0.05 at α-energies below ∼8 MeV in the ribs and cervical vertebra, with higher absorbed fractions to bone marrow seen at energies exceeding 8 MeV. The ICRP Publication 30 model is shown to be overly conservative with regard to values of φ(TAM←TBS) in the parietal bone at all energies considered. Improved agreement is seen between energy-dependent values of the present study (for the ribs and cervical vertebra) and those from the 2003 Eckerman model provided that their target definition is again revised to exclude the endosteal layer—that is, the difference between φ(TAM←TBS)2003Eckerman and φ(TBE←TBS)2003Eckerman.
Absorbed Fractions to Bone Endosteum
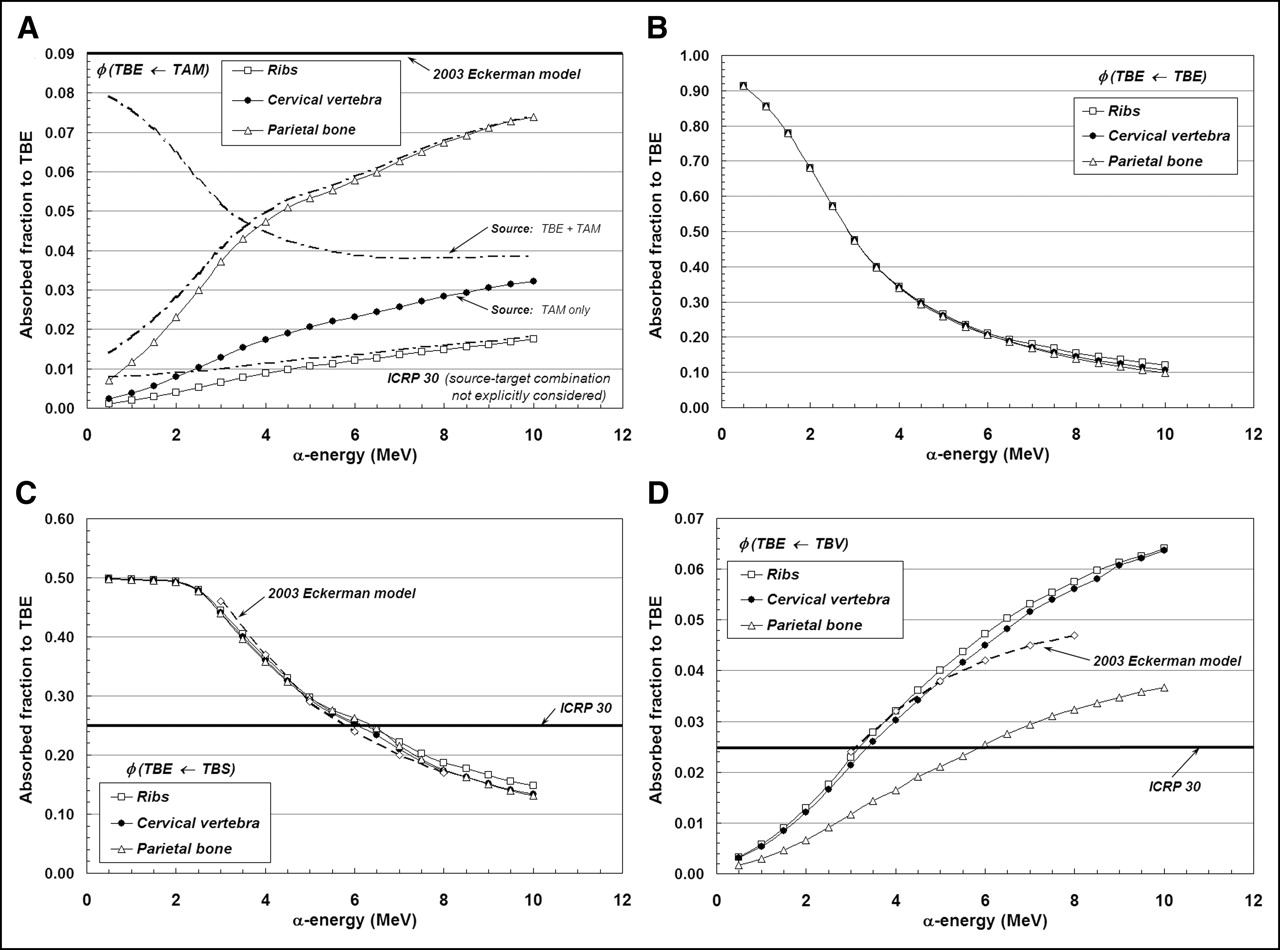
Figures 4A–4D display values of absorbed fraction to the trabecular endosteum as a function of α-particle energy at 3 of the 7 skeletal sites in the Leeds 44-y male subject. In each case, the marrow cellularity is set to 100% and, thus, differences in energy dependence are strictly related to differences in trabecular microstructure.

Absorbed fractions for endosteum target from α-sources emitted within the TAM (A), TBE (B), TBS (C), and TBV (D).
The fraction of α-particle energy deposited within the endosteal layers of trabecular bone is shown in Figure 4A for emissions within the marrow space. Transport results given by the 3D-CBIST skeletal model show values of absorbed fraction to endosteal tissues that begin at ∼0.001–0.007 (500 keV) and increase to values of 0.074, 0.032, and 0.018 (10 MeV) for the parietal bone, cervical vertebra, and ribs, respectively. This particular source–target combination is not discussed in ICRP Publication 30, while an energy- and bone-independent value of 0.09 is assigned for φ(TBE←TAM) in the 2003 Eckerman model. At 6 MeV, the 2003 Eckerman value is 1.56, 3.88, and 7.50 times higher than those given by the present model in the parietal bone, cervical vertebra, and ribs, respectively. If one additionally permits α-emissions in the endosteal layer itself (as is done in the 2003 Eckerman model), revised estimates of φ(TBE←TAM + TBE) from the 3D-CBIST model are given as shown by dot-dashed lines in Figure 4A. Here, we see that the additional contributions from endosteal self-dose increase estimates of φ(TBE←TAM) at very low α-energies for the ribs and parietal bone (where TBE accounts for 0.7% and 0.8% of the revised source mass), but negligibly impact their values at clinically relevant energies (5.5–8 MeV). In contrast, the endosteal layer in the cervical vertebrae accounts for up to 8.5% of the combined source mass and, thus, the endosteal self-dose is more prominent, even at the higher α-energies, although still smaller than predicted under the 2003 Eckerman model.
Values of φ(TBE←TBE) and φ(TBE←TBS) are given in Figures 4B and 4C, respectively. For these source–target combinations, the 3D-CBIST model predicts that the absorbed fraction is negligibly influenced by differences in trabecular microarchitecture across different skeletal sites. In Figure 4B, the absorbed fraction for the self-irradiation of the trabecular endosteum is shown to approach unity for very low-energy α-emissions and to approach values of ∼0.10–0.12 at 10 MeV. When the source of α-emissions is localized to the surfaces of the bone trabeculae (Fig. 4C), the half-space assumption is shown to be valid for α-particles less than ∼2 MeV, above which the absorbed fraction to trabecular endosteum declines to values of ∼0.13 to 0.15 at 10 MeV. These values are compared with the energy-independent assignment of φ(TBE←TBS) = 0.25 under the ICRP Publication 30 bone model. Consequently, for low-energy α-emitters, the dose to trabecular endosteum is underestimated within the ICRP Publication 30 model according to our calculations. Comparisons with the 2003 Eckerman model, on the other hand, demonstrate excellent agreement over the energy range 3–8 MeV.
Finally, Figure 4D displays absorbed fractions to TBE for α-sources localized uniformly within the bone trabeculae. For α-energies exceeding ∼3.0 MeV, the ICRP Publication 30 assumption of φ(TBE←TBV) = 0.025 is shown to underestimate the energy deposited within the trabecular endosteum of the ribs and cervical vertebra. This same model is shown to overestimate energy deposition to TBE within the parietal bone at α-particle energies up to ∼6 MeV. Values of φ(TBE←TBV) given by the 2003 Eckerman model show good agreement with those of the present study in 2 of the 3 skeletal sites shown (ribs and cervical vertebra).
Influence of Marrow Cellularity on α-Particle Absorbed Fractions
In Figures 5A–5D, the same 4 source–target combinations shown in Figures 3A–3D are again considered. In this case, however, we focus on a single bone site (lumbar vertebra) and allow the marrow cellularity to range from 100% to 20%. For the self-irradiation of the active marrow (Fig. 5A), the ICRP Publication 30 and 2003 Eckerman bone models are shown to closely approximate values of φ(TAM←TAM) given by the 3D-CBIST model only for marrow that is 100% cellular. As adipocyte concentrations increase (marrow cellularities decrease), less α-particle energy is deposited within active marrow, and a greater divergence of φ(TAM←TAM) from the unity assumption is noted at all energies. Furthermore, at a given α-energy below 10 MeV, values of φ(TAM←TAM) at different marrow cellularities are shown not to scale as simple ratios of their corresponding cellularities; consequently, full 3D transport is thus required to accurately report values of α-particle absorbed fraction.

Dependence of active marrow absorbed fraction with changes in marrow cellularity within lumbar vertebrae: TAM source (A), TBE source (B), TBS source (C), and TBV source (D).
Shielding effects of increased adipocyte concentration are noticeably demonstrated in Figures 5B and 5C for α-sources localized within the bone endosteum or on the bone surfaces, respectively. As marrow cellularity decreases, α-particles emerging from the endosteal layer increasingly encounter adipocytes along the endosteal surface; values of both φ(TAM←TBE) and φ(TAM←TBS) thus decline in value at all energies. Consequently, energy deposition to active marrow is increasingly overestimated in the ICRP Publication 30 and 2003 Eckerman bone models as the marrow becomes less and less cellular. At 6 MeV, for example, the ICRP Publication 30 model overestimates the energy deposited to active marrow for TBS emissions by factors of 1.9, 3.0, and 9.2 at marrow cellularities of 100%, 60%, and 20%, respectively.
The influence of marrow cellularity on values of φ(TAM←TBV) is demonstrated in Figure 5D for the lumbar vertebra. At marrow cellularities of 100%, 80%, and 60%, the ICRP Publication 30 bone model value of φ(TAM←TBV) = 0.05 is not reached until α-emission energies approach ∼7.5, 8.3, and 9.3 MeV, respectively. At lower marrow cellularities (e.g., 40% and 20%), the ICRP Publication 30 bone model conservatively estimates the energy deposited to active marrow at all energies considered (≤10 MeV). The 2003 Eckerman model is shown to closely match results from the 3D-CBIST model at 100% cellularity, if one accounts for energy lost to the TBE in their definition of the active marrow target.
Intersubject Variability in α-Particle Absorbed Fractions
Chord-length distributions for the 44-y male subject in the Leeds studies form the basis for both the present model and that of the 2003 Eckerman model of the OLINDA code. It is of clinical interest to explore the degree to which α-particle absorbed fractions can potentially vary with corresponding changes in trabecular microstructure seen in different patients. Four additional chord-length distributions are available from the Leeds studies of the lumbar vertebra, which can be used for just such a comparison: those from a 25-y male, a 55-y female, a 70-y female, and an 85-y female (19). Table 4 displays 3D-CBIST values of absorbed fractions of both active marrow and endosteum for the 44-y male subject at 100% cellularity. Ratios of these same values are then shown between each subject and the Leeds 44-y male. For TAM targets (left side of Table 4), variations of <1% are noted for α-emissions in the TAM and on the TBS, whereas ∼12% intersubject variations are seen for TBV sources. These variations are reasonable considering the short ranges of α-particles in the skeletal tissues and the fixed nature of the endosteal layer chord-length algorithm in the 3D-CBIST model. Intersubject variations in bone trabeculae thickness thus translate to increased intersubject variations in values of φ(TAM←TBV) over φ(TAM←TAM) or φ(TAM←TBS). For the TBE as the target tissue, <1% variations in values of φ(TBE←TBS) are noted, whereas ∼11%–13% intersubject variations in φ(TBE←TAM) or φ(TBE←TBV) are seen.
Ratios of α-Particle Absorbed Fractions in Skeletal Tissues of Lumbar Vertebra
Skeletal-Averaged Absorbed Fractions for ICRP Reference Male (RM)
An application of the 3D-CBIST model is presented in Tables 5–7. In Table 5, site-specific reference marrow cellularities for the ICRP Reference Male (RM) at ages 25 and 40 y are shown as given in ICRP Publication 70 (10). In addition, the fractional tissue masses within the ICRP RM for active marrow, bone endosteum, and bone trabeculae (fTAM, fTBS, fTBV, respectively) are given as published previously by Eckerman and Stabin (17). In this example, the fractional distribution of active marrow is given at both reference ages (25 and 40 y), as the latter more closely approximates the age of the Leeds individual from which reference absorbed fractions are given in the 2003 Eckerman bone model. As the Leeds data permit α-particle transport in only 7 skeletal sites, weighted combinations must be used to represent all skeletal regions of the body. Using the data of Table 5, and the site- and cellularity-dependent α-particle absorbed fractions of Appendix B (either directly or via interpolation), skeletal-averaged α-particle absorbed fractions, φSkel, for the ICRP RM can be calculated as given in Table 6 (age, 25 y) and Table 7 (age, 40 y) using the following expression:
 Eq. 7 where rS and rT denote the source and target tissues, respectively, and fs,j and CF are the fractional mass of source tissue and reference cellularity at bone site j, respectively. When estimating skeletal-average radionuclide S values, however, values of φSkel cannot be used directly within the MIRD schema, as both the absolute target tissue mass (mT,j) and its fractional distribution in the skeleton (fT,j) must also be considered:
 Eq. 8
Eq. 8
Marrow Cellularities and Fractional Tissue Distributions in Skeleton of ICRP Reference Male
Skeletal-Averaged α-Particle Absorbed Fractions in ICRP Reference Male with Explicit Consideration of Reference Marrow Cellularities (Age, 25 Years)
Skeletal-Averaged α-Particle Absorbed Fractions in ICRP Reference Male with Explicit Consideration of Reference Marrow Cellularities (Age, 40 Years)
CONCLUSION
A radiation transport model (3D-CBIST) has been developed that combines (a) chord-based techniques for tracking α-particles across bone trabeculae and marrow cavities and (b) a spatial model of the marrow tissues that explicitly considers the presence of marrow adipose tissue across a broad range of marrow cellularities. ICRP Publication 30 absorbed fractions are found to significantly overestimate α-particle energy deposition to active marrow as compared with values given by the 3D-CBIST model for all source regions. A single exception is high-energy α-particles emitted from within the bone trabeculae, irradiating marrow at high cellularity. These deviations become more prominent as marrow cellularity progressively decreases below 100%. In contrast, the ICRP Publication 30 bone model significantly underestimates energy deposition to skeletal endosteum as predicted under the 3D-CBIST model. Exceptions are noted for φ(TBE←TBS) at high energies (>6 MeV) and for φ(TBE←TBV) at low energies (∼3 MeV for ribs and cervical vertebra).
In cases of high marrow cellularity (∼100%), good agreement in values of φ(TAM←TBS) and φ(TAM←TBV) are noted between the 3D-CBIST and 2003 Eckerman models, but only for an equivalent definition of the active marrow (e.g., exclusive of the endosteal layer). In contrast, the energy-independent assumption of unity for φ(TAM←TAM) in the 2003 Eckerman model is seen to be overly conservative in regard to its dependence on both skeletal site (Fig. 3A) and marrow cellularity (Fig. 5A). Excellent model agreement is also seen for values of φ(TBE←TBS) and φ(TBE←TBV). Energy-dependent values of φ(TBE←TAM) given by the 3D-CBIST code, however, are found to be very much lower than φ(TBE←TAM) = 0.09 assumed under the 2003 Eckerman model.
It has been shown that invasive or noninvasive measurements of marrow cellularity can be clinically important to improvements in patient-specific dose estimates to active bone marrow (16, 24, 29). Explicit consideration of marrow cellularity and its role in modifying values of absorbed fraction under the MIRD schema has been made for β-particle emitters either by use of reference cellularity values by skeletal site (17, 30) or by permitting marrow cellularity to be a running variable in the dosimetry model (24). Results presented here provide a firmer basis for patient-specific dosimetry in α-emitter radionuclide therapies through the explicit consideration of absorbed fraction variations with particle energy, skeletal site, and marrow cellularity. Although results given here use the University of Leeds chord-length distributions for a single 44-y male subject (ICRP RM), the 3D-CBIST code can be easily extended to other individuals (i.e., cadavers) for which chord-length distributions are available from 3D microimaging of sectioned samples of trabecular spongiosa (31, 32).
APPENDIX A
A Revised Algorithm for Maximum Endosteal Chord-Length
Trajectories of electrons and α-particles across the near and far endosteal layers of a marrow cavity (dE1 and dE2, respectively) must be considered in tandem with random sampling of the marrow-cavity chord-length dMC as given in Equations 3–6. As shown in Equation 4, individual values of dE1 or dE2 can initially take on large and physically unrealistic values (values of η → 0), and, thus, the total endosteal chord-length (dE1 + dE2) must be limited to some maximum value dmaxE. In the skeletal models of Bouchet et al. (18) and of Eckerman and Stabin (17), dmaxE is set equal to the sampled marrow-cavity chord dMC. Recent studies by Derek W. Jokisch (unpublished data, December 2004) and Shah (33), however, indicate that this approach tends to overestimate particle trajectories across the endosteal layer (e.g., electron endosteal doses are higher in the chord-based models by a factor of ∼2 in comparison with those from image-based skeletal models). In the present study, a revised algorithm for dmaxE is thus adopted.
For each marrow-cavity chord dMC sampled in the 3D-CBIST code, a hypothetical spheric marrow cavity is briefly established with radius RMC such that a distribution of μ-random chords across it would yield a mean chord-length equal to this sampled chord dMC:
 Eq. 1A Interior to the surface of this sphere is placed a 10-μm-thick shell of endosteal tissue, thus defining an interior cocentric sphere of marrow space with radius RMC –10 μm. The value of dmaxE is then defined as the maximum chord-length within the endosteal layer tangent to the interior marrow-space sphere. Its value is given by the Pythagorean theorem and can be expressed as a function of the sampled marrow-cavity chord, dMC:
 Eq. 2A Note that this spheric marrow cavity is referenced only in Eq. 2A for the calculation ofdmaxE and is not related to the spatial model of the marrow tissues shown in Figure 2. For values of dMC ≥ 52.4 μm, dmaxE ≤ dMC and, thus, the revised algorithm is more restrictive than existing algorithms in skeletal dosimetry. The additional restriction in Equation 5 (that dMS ≥ 0) is applicable for those cases in which the sampled marrow-cavity chord dMC < 52.4 μm (first bin in the Leeds chord-length distributions), where dmaxE is slightly greater than dMC. The algorithm given in Eq. A.2 is to be considered a phenomenological correction to the existing algorithm (dmaxE = dMC), and future studies are suggested for improving our ability to accurately model the endosteal tissue layer while accounting for the full 3D microstructure of trabecular spongiosa.
Acknowledgments
This work was supported in part by grant CA96441 from the National Cancer Institute and Grant DE-FG07-02ID14327 from the U.S. Department of Energy with the University of Florida.
Footnotes
Received Aug. 1, 2004; revision accepted Mar. 18, 2005.
For correspondence or reprints contact: Wesley E. Bolch, PhD, Advanced Laboratory for Radiation Dosimetry Studies, Department of Nuclear and Radiological Engineering, University of Florida, Gainesville, FL 32611-8300.
E-mail: wbolch{at}ufl.edu
REFERENCES
In this issue


Jump to section
Related Articles
Cited By...
- Targeted Radionuclide Therapy: Proceedings of a Joint Workshop Hosted by the National Cancer Institute and the Society of Nuclear Medicine and Molecular Imaging
- MIRD Pamphlet No. 22 (Abridged): Radiobiology and Dosimetry of {alpha}-Particle Emitters for Targeted Radionuclide Therapy
- Toward Patient-Friendly Cell-Level Dosimetry
- Linear Regression Model for Predicting Patient-Specific Total Skeletal Spongiosa Volume for Use in Molecular Radiotherapy Dosimetry