


Abstract
Toxicity of the hematopoietically active bone marrow continues to be a primary limitation in radionuclide therapies of cancer. Improved techniques for patient-specific skeletal dosimetry are thus crucial to the development of dose–response relationships needed to optimize these therapies (i.e., avoid both marrow toxicity and tumor underdosing). Current clinical methods of skeletal dose assessment rely heavily on a single set of bone and marrow cavity chord-length distributions in which particle energy deposition is tracked within an infinite extent of trabecular spongiosa, with no allowance for particle escape to cortical bone. In the present study, we introduce a paired-image radiation transport (PIRT) model that can provide a more realistic 3-dimensional geometry for particle transport of the skeletal site at both microscopic and macroscopic levels of its histology. Methods: Ex vivo CT scans were acquired of the lumbar vertebra and right proximal femur excised from a 66-y male cadaver (body mass index, 22.7 kg m−2). For both skeletal sites, regions of trabecular spongiosa and cortical bone were identified and segmented. Physical sections of interior spongiosa were then taken and subjected to nuclear magnetic resonance (NMR) microscopy. Voxels within the resulting NMR microimages were segmented and labeled into regions of bone trabeculae, endosteum, active marrow, and inactive marrow. The PIRT methodology was then implemented within the EGSnrc radiation transport code, whereby electrons of various initial energies are simultaneously tracked within both the ex vivo CT macroimage and the NMR microimage of the skeletal site. Results: At electron initial energies greater than 50–200 keV, a divergence in absorbed fractions to active marrow is noted between PIRT model simulations and those estimated under infinite spongiosa transport techniques. Calculations of radionuclide S values under both methodologies imply that current chord-based models used in clinical skeletal dosimetry can overestimate dose to active bone marrow in these 2 skeletal sites by ∼4%–23% for low-energy β-emitters (33P, 169Er, and 177Lu), by ∼4%–25% for intermediate-energy β-emitters (153Sm, 186Re, and 89Sr), and by ∼11%–30% for high-energy β-emitters (32P, 188Re, and 90Y). Conclusion: The PIRT methodology allows for detailed modeling of the 3D macrostructure of individual marrow-containing bones within the skeleton, thus permitting improved estimates of absorbed fractions and radionuclide S values for intermediate-to-high β-emitters.
- skeletal dosimetry
- marrow dose
- nuclear magnetic resonance microscopy
- radionuclide S value
- absorbed fraction
The skeletal system represents one of the more complex challenges in internal dosimetry. This distributed organ, with its wide variety of bone sizes and configurations, encompasses the hematopoietic tissues of the active (red) bone marrow as well as the osteogenic tissues of the endosteum, both of which are relevant targets for short-term deterministic and long-term probabilistic radiation effects. Of primary importance is the 3-dimensional (3D) microscopic architecture of the bone trabeculae, which separate and define the marrow cavities. For short-ranged radiations (α-particles and lower-energy β-particles), knowledge of this 3D microstructure is necessary and sufficient for accurate computation of particle transport through these skeletal tissues. For longer-ranged radiations (such as intermediate- to high-energy β-particles), further consideration should be given to the 3D macrostructure of the skeletal site, including the location and extent of cortical bone into which escaping particles may penetrate.
The vast majority of initial studies in skeletal dosimetry were conducted at the University of Leeds by Spiers and his students (1–6). Spiers was the first to recognize that the anisotropic structure of trabecular bone required a unique method for characterizing the trabecular geometry as needed for accurate skeletal dosimetry of β-emitters (2,4). Consequently, he and his students constructed an optical bone-scanning system that measured linear chord-length distributions across 2-dimensional radiographs of excised bone tissue slices. Using these frequency distributions of linear chord lengths through both bone trabeculae and marrow cavities, the fraction of a particle’s kinetic energy deposited in each tissue type was estimated. Spiers and his students obtained chord-length distributions in the lumbar vertebrae for several subjects, as well as at several skeletal sites of a 1.7-y child (5 sites), a 9-y child (5 sites), and a 44-y man (7 sites) (7–10). In many ways, the chord-length distribution data measured for the 44-y man has served to define many of the skeletal attributes of Reference Man as defined by the International Commission on Radiological Protection (ICRP) (11,12). Furthermore, all skeletal dosimetry models published and presently used in clinical dose assessment are fundamentally reliant on this single set of adult chord-length distributions (13–17).
In this technique, radiation particles are effectively transported within an infinite region of trabecular spongiosa (defined as the combined tissues of the bone trabeculae, endosteum, and marrow cavities). Models of skeletal dosimetry used in current clinical practice, such as the Eckerman and Stabin model (16) of MIRDOSE3 and its successor codes (18), belong to a class of models called CBIST (Chord-Based Infinite Spongiosa Transport) and do not account for particle escape to cortical bone. Consequently, absorbed fractions to skeletal tissues are potentially overestimated in CBIST models for higher-energy β-emitters.
One of the first attempts to account for energy loss to cortical bone was made by Spiers’ doctoral student J.R. Whitwell (9,10). She introduced a trabecular equilibrium factor, Qtrab, to account for the finite extent of the spongiosa. This correction factor was determined for several radionuclides of interest in radiation protection and for each of the 7 skeletal sites for which chord-length distributions were obtained in the 44-y male subject. For 90Y, the highest correction noted by Whitwell was for the parietal bone (Qtrab = 0.672), whereas the lowest was for the head of the femur (Qtrab = 0.980). Nevertheless, these values of Qtrab were determined using simplified geometries for both spongiosa and cortical bone (e.g., planes and spheres).
In a more recent study by Patton et al. (19), nuclear magnetic resonance (NMR) microscopy was applied to the study of the 3D microstructure of bone trabeculae within the femoral and humeral heads of 3 subjects: a 51-y man, an 82-y woman, and a 89-y woman. To account for energy lost to cortical bone, an ex vivo CT scan of the excised femoral or humeral head was obtained before spongiosa sectioning. From spatial measurements on the CT images, a spheric region of spongiosa was constructed surrounded by a spheric shell of cortical bone. Electrons of various initial energies were thus transported (via the ESG4 radiation transport code) simultaneously within the NMR microimage (constructed of voxels of bone and marrow) and within a stylized model of the femoral or humeral head. Comparisons were subsequently made between energy-weighted absorbed fractions to active marrow under particle transport in either (a) an infinite extent of spongiosa or (b) the stylized model of the bone site. Patton et al. demonstrated that, without explicit consideration of energy loss to cortical bone, radionuclide S values for 32P and 90Y could potentially overestimate active marrow dose by 6% and 11%, respectively, in the femoral head—values that exceeded the 2% corrections predicted by Whitwell. This tendency to overestimate dose to active marrow under infinite spongiosa transport had also been demonstrated by Jokisch et al. (20) for the thoracic vertebra, in which the physical extent of the vertebral spongiosa was delineated in a stylized model of the vertebral body (e.g., truncated circular cylinder). Due to their geometric complexity, however, no attempt was made to include the vertebral processes in the stylized vertebral model (which account for up to ∼25% of vertebral spongiosa).
In the present study, we significantly extend the skeletal modeling approach originally explored by Jokisch et al. (20) and Patton et al. (19) to fully account for the 3D macrostructural dimensions of skeletal sites within which dose estimates are desired. A Paired-Image Radiation Transport or PIRT model for skeletal dosimetry is introduced, in which radiation particles are tracked simultaneously within 2 different segmented digital images: (a) an ex vivo CT image of the entire skeletal site outlining regions of trabecular spongiosa, cortical bone, and surrounding tissues and (b) an ex vivo NMR microscopy image of the interior bone trabeculae and marrow cavity microstructure representative of that found in spongiosa volumes of the larger CT image. The PIRT model is demonstrated within 2 skeletal sites obtained from a single male cadaver: the L4 vertebra and the right proximal femur. In addition, representative site-specific S values are calculated and compared with those obtained under particle transport within infinite regions of spongiosa for a variety of radionuclides of interest in skeletal imaging and therapy.
MATERIALS AND METHODS
Cadaver Selection
Candidate subjects for study were obtained through the State of Florida Anatomic Board located on the University of Florida (UF) campus. Cadaver selection criteria included (a) an age between 50 and 75 y (representative of typical radionuclide therapy patients), (b) a body mass index (BMI) of 18.5–25 kg m−2 (Centers for Disease Control and Prevention–recommended healthy range), and (c) a cause of death that would preclude significant skeletal deterioration. The subject identified was a 66-y male, approximately 68 kg in total mass and 173 cm in total height at the time of death (BMI, 22.7 kg m−2). The subject died suddenly of complications associated with cardiomyopathy.
In Vivo CT
Before bone harvesting, the male cadaver was subjected to whole-body imaging via multislice helical CT at a pitch necessary to reconstruct contiguous 1-mm axial slices. The images were acquired on a Siemens Sensation 16 unit within the Department of Radiology at UF Shands Hospital. Image reconstruction was performed with a bone filter at an in-plane pixel resolution of 977 × 977 μm. The CT image sets were then transferred to workstations within the Advanced Laboratory for Radiation Dosimetry Studies (ALRADS) in the UF Department of Nuclear and Radiological Engineering for image processing and data storage. The in vivo CT scans provided image data for (a) selecting the anatomic region from which the bone site would be harvested and (b) constructing 3D anatomic models of skeletal sites where bone harvesting (and thus ex vivo CT) might be incomplete (e.g., facial bones of the skull).
Bone Harvesting and Ex Vivo CT
After detailed review of the whole-body in vivo CT images, bone harvesting was conducted. Thirteen major skeletal sites were taken from the male cadaver, including the entire vertebral column and both proximal femora. Once each skeletal site was excised, it was cleaned of excess tissue, bagged, labeled, and stored frozen until ex vivo CT could be scheduled. After harvest, ex vivo CT was conducted at higher resolution (1.0-mm slice thickness with an in-plane resolution of 0.3 × 0.3 mm) than permitted for in vivo scans. The ex vivo CT scans provided image data for (a) identifying the location and extent of trabecular spongiosa to be sectioned for NMR microscopy, (b) quantifying volumes of trabecular spongiosa and cortical bone within the bone site, and (c) constructing 3D anatomic models of the bone site for subsequent PIRT simulations.
After detailed review of the ex vivo CT scans, physical sections of trabecular spongiosa were taken from each bone site. Sections represented as large a region of spongiosa as possible, given the constraints of the bone shape and the NMR imaging system (e.g., cuboidal samples taken from a spherically shaped femoral head). Marrow-intact sections of spongiosa were bagged, labeled, and kept frozen until NMR microimaging sessions could be arranged. For the lumbar vertebra, 2 cuboidal sections (roughly, 1.25 × 1.25 × 2.5 cm on edge) were cut from the vertebral body representing ∼24% of the total vertebral body spongiosa. For the right proximal femur, 4 cuboidal sections were cut from the femoral head (∼20% of total spongiosa within the head) and 4 sections were cut from the femoral neck (∼16% of the total spongiosa within the neck).
Image Segmentation of Spongiosa and Cortical Bone Regions
To create tomographic anatomic models for use in internal dosimetry, radiation transport codes must be able to decipher the boundaries of each tissue region for which an independent dose assessment is to be made. Limitations of CT image acquisition can result in an overlap of gray-scale values for tissues of interest, thus precluding the use of simple automated methods of boundary definition. In the present study, the program CT_Contours was adopted for use in segmenting spongiosa and cortical bone within each ex vivo CT image set (21). This program is based on Interactive Data Language version 5.5 and can output labeled contour files in a variety of formats, including binary files for EGSnrc (22) and ASCII text for MCNP (23). CT_Contours displays the current CT information as well as a color overlay of the contours being edited. The contours can be created using a variety of tools, including basic thresholding, pixel growing, voxel growing, region growing, and manual segmentation. The voxels contained in the individual contours are filled with the desired segmentation value, generating volumes of voxels with identical tag values. In the present study, these volumes represent individual regions of either trabecular spongiosa or cortical bone within the skeletal site. CT_Contours was written to have the option of displaying the images using 15 different filters, including gaussian smoothing (3 × 3, 5 × 5, or 7 × 7), median (3 × 3, 5 × 5, or 7 × 7), Roberts edge detection, Sobel edge detection, Prewitt edge detection, isotropic edge detection, histogram equalization, adaptive histogram equalization, sharpening, and Kuwahara (3 × 3 or 5 × 5) filtering. By altering regions of a separate contour dataset, the desired segmentation can be performed. CT_Contours was designed so that ROI creation or modification can be performed in the transverse, sagittal, or coronal plane.
NMR Microscopy of Trabecular Spongiosa
NMR microscopy of trabecular bone for the purposes of skeletal dosimetry has been discussed previously (20,24–27). NMR imaging requires physical sectioning of the excised sample and digestion of the marrow tissues. Samples of trabecular bone sections are first immersed and suspended within a circulating solution of sodium hypochlorite for ∼3 h. The samples are then rinsed in water and reimmersed in a new solution. This process is repeated up to 3 times depending on the size of the sample. Visual inspection is used to determine the number of repetitions needed. To ensure that water completely fills all marrow cavities, each sample is placed in a container filled with Gd-doped water under vacuum. While immersed, the sample is placed in a smaller container needed for insertion into the magnet. This imaging container is then sealed and taken to the Advanced Magnetic Resonance Imaging and Spectroscopy facility at the UF McKnight Brain Institute for NMR microscopy.
NMR microscopy images in the present study were acquired on a Bruker 40-cm wide-bore imaging spectrometer, operated at a 470-MHz proton resonance frequency (11-T magnetic field strength). The system is fitted with a small gradient set (for microimaging), consisting of 3-axes magnetic-field gradients, with a maximum gradient amplitude of 22 G/cm in all 3 orthogonal directions. A 35-mm-diameter quadrature birdcage coil of 45-mm length is used to obtain the best signal-to-noise ratio (SNR). For all imaging sessions, a 3D RARE (rapid acquisition with relaxation enhancement) spin-echo pulse sequence is used to obtain fully 3D images of the samples. Fields of view are typically 3.2 × 3.2 × 3.2 cm with matrix dimensions of 512 × 512 × 512. The resulting spatial resolution of the 3D images is thus 63 × 63 × 63 μm. Smaller voxel dimensions can be achieved at UF (∼58 μm), but at the cost of smaller sample sizes and increased imaging time (to preserve SNR). Postacquisition image processing, including gray-level thresholding, voxel segmentation, and 3D median filtering, have been reported previously (24,28). For use in radiation transport simulations, interior ROIs are taken to avoid physical distortions (bone saw tearing) or imaging distortions (NMR aliasing) at the edges of the sectioned specimen.
Voxel-Based Infinite Spongiosa Transport (VBIST) Model
After NMR microscopy of our skeletal samples, a series of VBIST models were created to approximate (via 3D transport) the results of current CBIST models. First, marrow voxels within the binary NMR microscopy image are further labeled into voxels of active (red) marrow and inactive (yellow) marrow at a predetermined value of marrow cellularity. This process has been outlined previously by Shah et al. and is based on microscopy measurements of the spatial distribution of adipocytes within normal bone marrow biopsies covering a broad range of marrow cellularities (25). Skeletal endosteum is further defined as a 10-μm tissue layer at the bone-marrow interface as previously described by Jokisch et al. (20). The resulting 4-tissue 3D model of trabecular spongiosa is coupled to the EGSnrc radiation transport code (22) for electron and β-particle transport simulations. Source tissues include the trabecular active marrow (TAM), trabecular bone surfaces (TBS), and trabecular bone volume (TBV). Bone surface sources are approximated as a 0.1-μm layer on the marrow side of the bone-marrow voxel interface. Target tissues include the TAM and the trabecular bone endosteum (TBE). Once a given electron reaches the physical edge of the 3D NMR microscopy image, that particle is reintroduced to the image at a corresponding location at its opposing edge. The processes of particle transport within the image of spongiosa and its reintroduction are continued until all initial kinetic energy is expended. Particle histories are continued (50,000–2,000,000) until coefficients of variation on the absorbed fraction are <1%. It is noted, however, that results given here for our voxel-based Infinite Spongiosa Transport (IST) model are only approximate to those given from chord-based IST models. In previous studies by Jokisch et al. (20,29), the authors question the sampling independence of the marrow and bone chord-length distributions within existing CBIST models and suggest a 3D joint distribution might be more appropriate to describing the full 3D microarchitecture of particle transport within the spongiosa regions of trabecular bone.
PIRT Model: L4 Vertebra
In contrast to the VBIST model, the PIRT model supplements the 3D microscopic histology provided by the NMR microscopy image with the 3D macroscopic histology given in the corresponding ex vivo CT image. The latter provides additional data for particle transport, including (a) the spatial extent of the trabecular spongiosa (e.g., vertebral processes and body) and (b) the spatial extent of the surrounding cortical bone (which laterally encompasses the vertebral body, forms the lamina separating the vertebral processes, and is absent at the superior and inferior body-disk interfaces).
A schematic of the PIRT model for the L4 vertebra of the 66-y man is given in Figure 1. The ex vivo CT image is shown in the top left, in which segmented regions of spongiosa and cortical bone surfaces are highlighted in orange and white, respectively. Two representative transverse slices are shown (top middle and top right), where regions of spongiosa (orange) and cortical bone (light blue) are again differentiated. Superimposed over the entire ex vivo CT image is a 3D array of the replicate cuboidal NMR microscopy images, each representing the 3D microstructure of the individual bone trabeculae and marrow cavities. A 3D rendering of the NMR microimage is thus shown in the bottom left of Figure 1. Finally, a single transverse slice through the NMR microimage is shown in the bottom right, displaying individual voxels of bone (black) and total marrow (white).
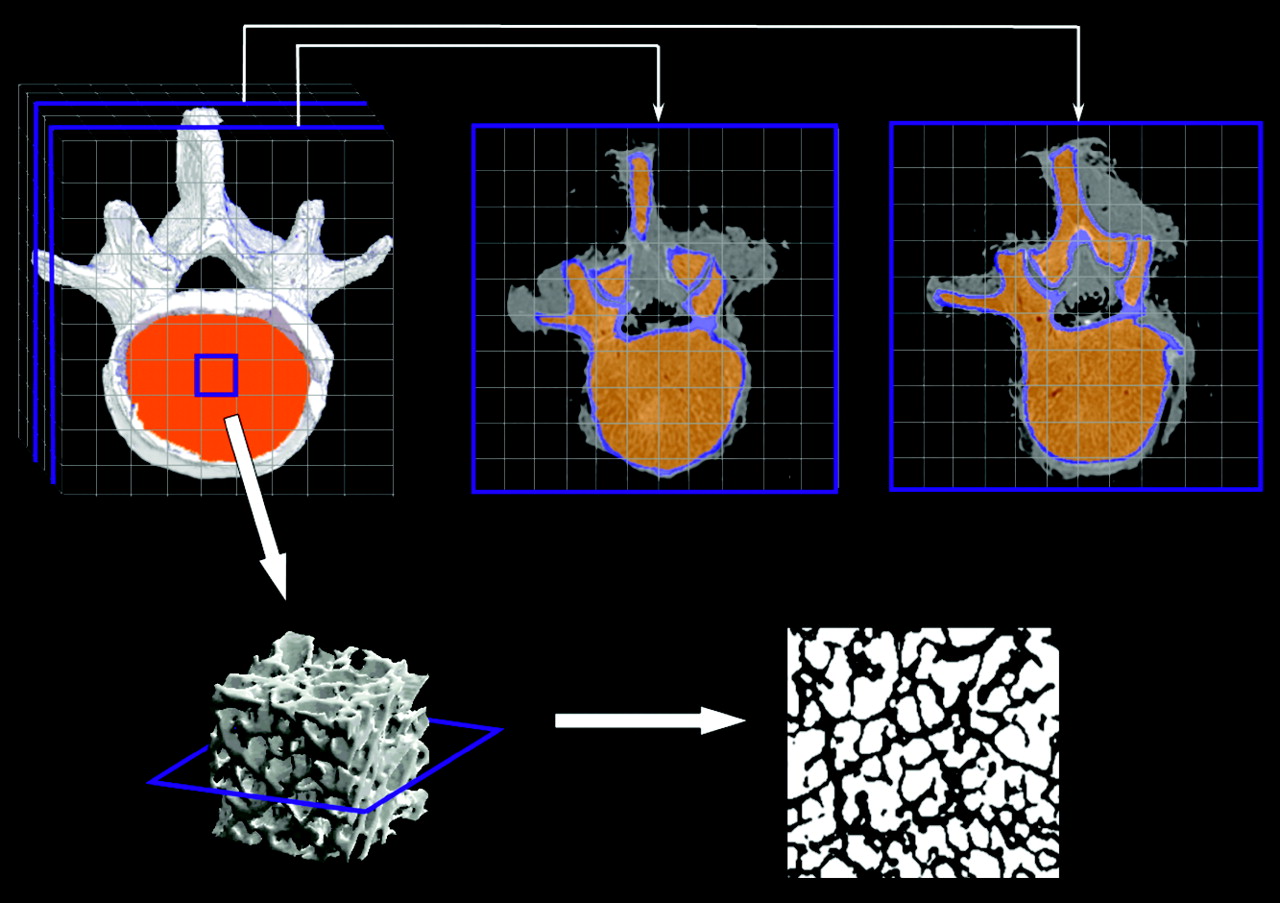
Schematic of PIRT model constructed for L4 vertebra.
In the EGSnrc implementation of the vertebral PIRT model, individual electrons are tracked simultaneously within the coordinates of the NMR microimage (indicating locations in TBV, TBE, TAM, or trabecular inactive marrow [TIM]) and the coordinates of the CT macroimage (indicating locations in spongiosa, cortical bone volume [CBV], or surrounding tissues—muscle, soft tissue, or vertebral disks). Elemental compositions and mass densities assumed within the PIRT model were taken from Report 46 of the International Commission on Radiation Units and Measurements (30) (see Table 1). When the particle is shown to leave the spongiosa of the CT macroimage, tracking within the NMR microimage is halted and the particle is transported within a homogeneous region of cortical bone defined only by the larger voxels of the ex vivo CT macroimage. Upon particle escape from outer surface of the bone site, particle tracking is terminated. In cases in which the particle leaves cortical bone and reenters the interior spongiosa, particle tracking in the NMR microimage is resumed. The PIRT model is thus far more anatomically realistic than is the geometry provided by either the CBIST or VBIST model, especially for higher-energy, longer-ranged electrons and β-particles.
Elemental Tissue Compositions (% by Mass) and Mass Densities Used in Either VBIST or PIRT Model of Skeletal Dosimetry
The principal approximation inherent within the PIRT model is that the trabecular microstructure given by the physical section of spongiosa (as imaged via NMR) is uniform across all CT-segmented regions of spongiosa within the skeletal site. As a result, the trabecular microstructures of the various vertebral processes (spinal, superior articular, and transverse) are implicitly assumed to be approximated by that imaged within the vertebral body. In cases in which more than one physical section of spongiosa has been imaged by NMR, the PIRT model can be rerun using different NMR microimages. The resulting microimage-specific absorbed fraction profiles can thus be averaged either uniformly or weighted by the volume of spongiosa sectioned. Finally, it is noted that the PIRT model permits explicit consideration of a cortical bone volume (CBV) as a potential radioactivity source—a feature not permitted within the CBIST or VBIST model of skeletal dose.
PIRT Model: Proximal Femur
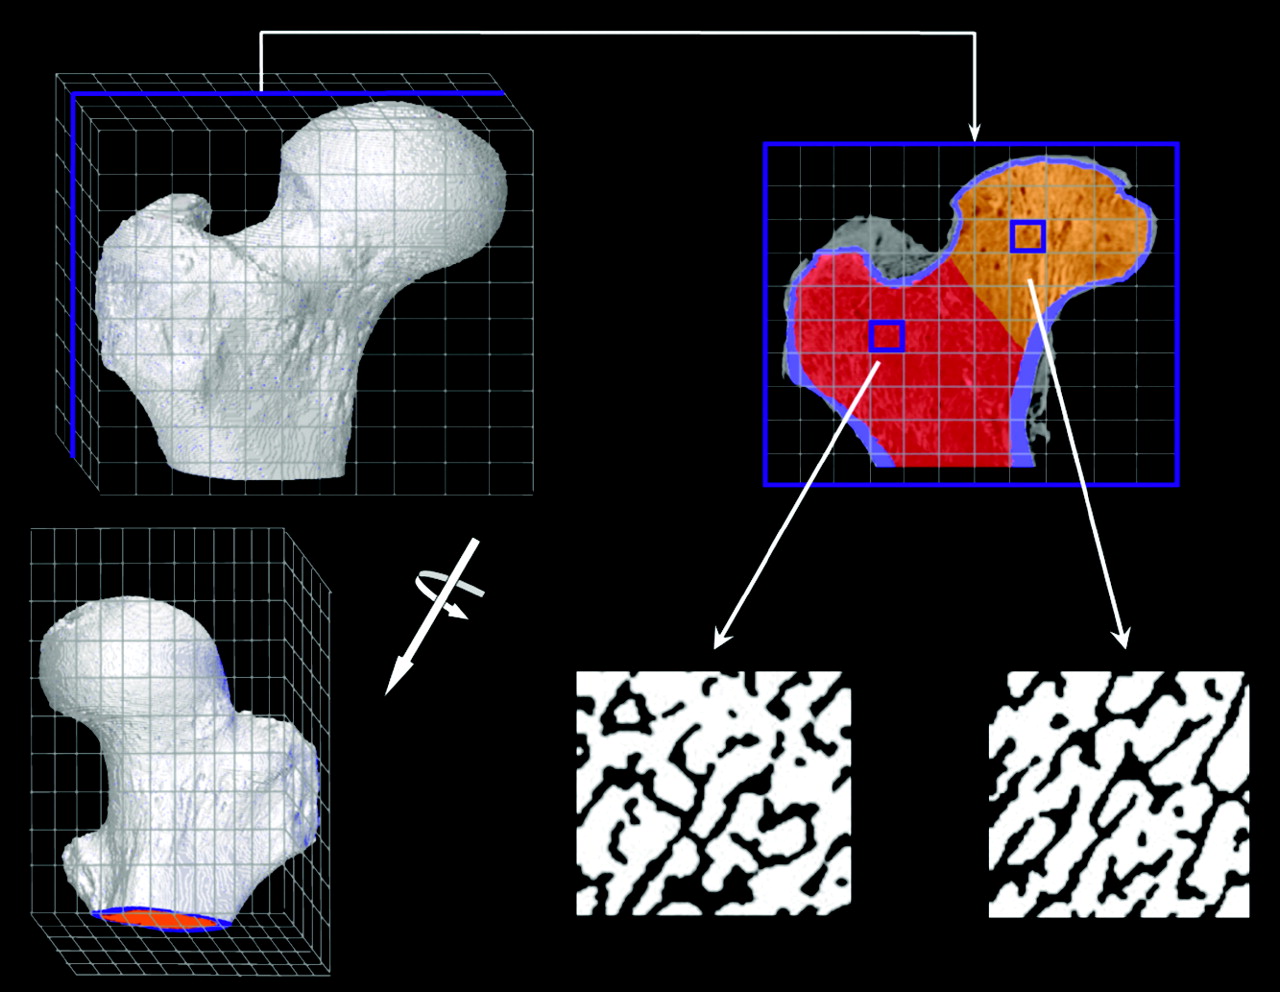
A corresponding schematic of the PIRT model for the right proximal femur of the 66-y male subject is shown in Figure 2. In adults, hematopoiesis occurs primarily within the proximal epiphysis of the femur and, thus, the macrostructural model (shown in the top right of Fig. 2 and given by the ex vivo CT) is terminated inferiorly at the point where the lesser trochanter merges anatomically with the femoral diaphysis. As with the University of Leeds chord-length measurements for their 44-y man, the biomechanics and, thus, the trabecular microstructure are notably different within the femoral head and femoral neck; consequently, 3D NMR microscopy images were taken separately from the head and neck regions of the proximal femur. Representative transverse NMR image slices are shown in the bottom middle and bottom right of Figure 2. For each tissue source region in the model (TAM, TBV, or TBS), 2 different transport simulations are performed—one in which electrons are started within the spongiosa of the femoral head (orange voxels of the ex vivo CT transverse slice) and one in which electrons are started within the spongiosa of the femoral neck (red voxels of the ex vivo CT transverse slice). In each case, only the corresponding NMR microscopy image is used within the PIRT model (head or neck microimage). Final absorbed fraction results for the entire proximal femur are taken as mass weighted averages of results from the head-only and neck-only spongiosa source transport calculations. Table 2 displays the various source and target tissue masses for both the proximal femur and lumbar vertebra PIRT dosimetry models (given as the product of their segmented volume and the reference densities of Table 1). The bottom row of Table 2 gives values of marrow volume fraction (MVF) defined as the fraction of all voxels within the NMR microimage that are assigned to marrow tissues after image thresholding. Here it is noted that the MVF of the femoral head is 64.5%, whereas it is 75.5% within the femoral neck. The MVF within the L4 vertebral body, however, was measured at 87%.

Schematic of PIRT model constructed for right proximal femur.
Tissues Masses Used in PIRT Model (100% Marrow Cellularity)
RESULTS
Absorbed Fractions to Active Marrow Within L4 Vertebra
Figure 3 displays values of electron-absorbed fraction to active (red) bone marrow within the L4 vertebra of the 66-y male subject. Figure 3A corresponds to an assumption of 100% marrow cellularity (no voxels of adipose tissue are labeled within the NMR microimage), whereas Figure 3B corresponds to an assumed marrow cellularity of 70% (reference value in both ICRP Publications 70 and 89 (12,31)). In each graph, solid lines indicate energy-dependent absorbed fractions obtained from PIRT model simulations, whereas dashed lines indicate those derived from VBIST model simulations. For either model and at both cellularities, 3 source tissues are considered: TAM (diamonds), TBS (triangles), and TBV (circles).

Electron-absorbed fractions to active bone marrow within L4 vertebrae for 3 source tissues: TAM, TBV, and TBS. Data shown by solid lines are from PIRT model, whereas those given by dashed lines are from VBIST model. Data for A correspond to 100% marrow cellularity, whereas those for B correspond to ICRP 70 reference cellularity of 70% (31).
At source energies below ∼100 keV, the 2 model types yield essentially equivalent results, as boundary effects at the spongiosa–cortical bone interface (within the PIRT model) play a negligible role in modifying the pattern of energy deposition to active marrow voxels (as seen within the VBIST model). Model equivalency is noted to extend to electrons of ∼200-keV initial energy when emitted within the volume of the bone trabeculae (TBV sources).
As the electron initial energy increases above 100–200 keV, energy deposition to active marrow as predicted under VBIST model simulations increasingly overpredicts that given by the more anatomically realistic PIRT model. As previously noted for chord-based skeletal models under either CBIST or VBIST simulations, absorbed fractions asymptotically approach a limited value independent of the source tissue (13,15,20). At 100% cellularity, the VBIST model absorbed fraction to active marrow approaches a value of 0.76 at high electron energies, whereas it approaches a limiting value of 0.53 at 70% cellularity (70% of 0.76). Similarly, absorbed fractions to active marrow predicted under PIRT model simulations also converge in a source-independent manner, but this convergence value is energy dependent as more and more electron energy is lost to the surrounding cortical bone (and potentially surrounding tissues). With the PIRT model results serving as the local standard, percentage errors in the self-absorbed fraction to active marrow given by the VBIST model are 7% at 500 keV, 16% at 1 MeV, and 85% at 4 MeV. Corresponding percentage errors are 7%, 16%, and 88% for TBS sources and 7%, 18%, and 89% for TBV sources. These percentage errors are roughly equivalent at both marrow cellularities.
Absorbed Fractions to Active Marrow Within Proximal Femur
Figure 4 displays values of electron-absorbed fraction to active marrow for TAM, TBS, and TBV sources located within the spongiosa of the right proximal femur of the 66-y male subject. Figures 4A and 4B correspond to marrow cellularities of 100% and 25%, respectively, where the latter is the default cellularity for the upper femur given in ICRP Publications 70 and 89 (12,31). In each graph, the individual absorbed fraction profiles for electron sources in the femoral head and in the femoral neck have been averaged according to the total mass of source tissue in the head and neck regions of the proximal femur, respectively. In Figure 4B, the ordinate has been expanded to better view differences in modeling results at high electron energies. At the lowest energy considered (10 keV), a value of φ(TAM←TAM) = 0.98 is seen under both VBIST and PIRT simulations.

Electron-absorbed fractions to active bone marrow within proximal femur for 3 source tissues: TAM, TBV, and TBS. Data shown by solid lines are from PIRT model, whereas those given by dashed lines are from VBIST model. Data for A correspond to 100% marrow cellularity, whereas those for B correspond to ICRP 70 reference cellularity of 25% (31).
Patterns of divergence between the 2 modeling approaches (VBIST vs. PIRT) in the proximal femur are seen to occur at lower energies compared with those found within the L4 vertebra (∼100 keV for TAM sources, ∼50 keV for TBS sources, and ∼100 keV for TBV sources). Furthermore, it is seen that at 4 MeV (the highest energy considered), full convergence of the absorbed fraction to active marrow under both VBIST and PIRT model simulations has not yet been reached for the 3 source regions. Nevertheless, the energy-independent (VBIST) and energy-dependent (PIRT) patterns of convergence are still evident at electron initial energies of >1 MeV. With the PIRT model results serving as the local standard, percentage errors in self-absorbed fraction to active marrow (100% cellularity) given by the VBIST model are 6% at 500 keV, 12% at 1 MeV, and 31% at 4 MeV. Corresponding percentage errors are 22%, 27%, and 44% for TBS sources and 12%, 21%, and 44% for TBV sources. These percentage errors are ∼20%–50% higher when the marrow cellularity of the proximal femur is reduced to 25% (fat fraction of ∼75%).
Absorbed Fractions to Endosteal Tissues
Figure 5 displays values of absorbed fraction to the trabecular endosteal tissues defined as a 10-μm layer of soft tissue on the marrow side of the bone–marrow interface within the NMR microimages. Figure 5A gives results for TBS, TBV, and TAM electron sources emitted within the L4 vertebra containing bone marrow at 70% cellularity. Figure 5B shows data for these same source tissues within the right proximal femur at 25% marrow cellularity. In both graphs, the ordinate scale is expanded to a maximum value of 0.16 to facilitate viewing model differences at higher energies. At the lowest energy considered (10 keV), a value of φ(TBE←TBS) = 0.5 is seen under both VBIST and PIRT simulations.

Electron-absorbed fractions to trabecular bone endosteum within L4 vertebra (A) and proximal femur (B) for 3 source tissues: TAM, TBV, and TBS. Data shown by solid lines are from PIRT model, whereas those given by dashed lines are from VBIST model.
At each energy for each model, higher absorbed fractions are noted for electron sources on the trabecular surfaces, whereas lower absorbed fractions are seen for electron sources emitted within the active bone marrow. Intermediate absorbed fractions are shown for bone volume sources that peak in value at a source energy of ∼100 keV in both skeletal sites. As expected, VBIST model simulations approach energy- and source-independent convergence values at high electron initial energies (0.032 in the L4 vertebra, and 0.045 in the proximal femur), whereas source-independent convergence values for the PIRT model are shown to continually decline with increasing source energy above 1 MeV. This decline is slightly more prominent in the L4 vertebra than seen in the proximal femur and is accountable in part by cortical bone losses within the vertebral processes. In these anatomic regions of the vertebra (which encompass ∼25% of total vertebral spongiosa), the surface-to-volume ratio of trabecular spongiosa is higher than that found in the vertebral body and, thus, electron escape to cortical bone is greater for individual electron emissions.
DISCUSSION
As a further means of comparing the VBIST and PIRT model results, radionuclide S values were calculated for a wide range of β-particle emitters of interest in skeletal tissue imaging and radionuclide therapy. Absorbed fractions to active bone marrow given in Figures 3A and 3B and Figures 4A and 4B, along with tissue mass data of Table 2 and β-particle energy spectra from Eckerman et al. (32), were used to calculate S values under the MIRD schema for 9 different radionuclides. Ratios of the S value based on VBIST-model absorbed fractions to that using PIRT-model absorbed fractions are displayed in Table 3 for both skeletal sites and at both 100% and ICRP reference marrow cellularities. For low-energy β-emitters such as 33P, 169Er, and 177Lu, absorbed fractions given by the VBIST model simulations overestimate radionuclide S values for TAM, TBS, and TBV sources by only 1%–5% in the L4 vertebra. Higher errors are noted in the proximal femur, particularly for bone trabeculae volume sources (ratios of 1.17–1.23). For radionuclides at intermediate β-energies (Eave of 225–583 keV), S value ratios range from 1.05 to 1.14 in the L4 vertebra and from 1.04 to 1.26 in the proximal femur. For radionuclides in the highest β-energy range (Eave of 695–934 keV), S value ratios range from 1.15 to 1.24 in the L4 vertebra and from 1.11 to 1.30 in the proximal femur. It is reasonable to assume that similar errors are also present in radionuclide S values derived from chord-based models (14,16), which, as in the VBIST simulations of the present study, assume an infinite region of spongiosa during particle transport.
Ratio of Radionuclide S Value for Active Marrow (TAM) Target as Given by Voxel-Based VBIST Model to That Given by PIRT Model
Before the full development of the PIRT methodology given here, the UF ALRADS research group had attempted to correct for energy loss to cortical bone by applying a stylized model of the skeletal site macrostructure. For example, in the study by Patton et al. (19), a spheric region of spongiosa surrounded by a spheric shell of cortical bone was applied to the femoral heads of 3 different individuals based on CT image analysis. In that study, it was demonstrated that infinite spongiosa transport yielded radionuclide S values for 32P that were ∼5%–8% higher than those in which cortical bone energy loss was accounted for via stylistic modeling of the femoral head. For the higher-energy 90Y, the infinite spongiosa transport results gave S values 8%–11% higher. In the present study, however, the full 3D histologic macrostructure of the proximal femur (head as well as neck and trochanter regions) is treated within the PIRT model simulations. Corresponding corrections to infinite spongiosa transport are shown in the present study (by the PIRT model) to be significantly higher (up to 1.26 for 32P and up to 1.30 for 90Y) than indicated previously by Patton et al. (19) for the femoral head. These larger corrections are attributed to enhanced particle energy loss at 3 spongiosa regions of the PIRT femur model: the femoral neck, the trochanters, and the bottom interface of the model (where particles are lost to inactive marrow of the femoral diaphysis; Fig. 2). These regions of enhanced electron escape were not present within the spheric femoral head model of the Patton et al. study.
Improved macrostructural modeling of the skeleton via the PIRT model methodology will potentially lead to improvements in correlations between marrow dose estimates and observed patient myelotoxicity. For example, clinical studies of the bone pain palliation agents 153Sm-ethylenediaminetetramethylene phosphonate (153Sm-EDTMP) (33–35) and 186Re-hydroxyethylidene diphosphonate (186Re-HEDP) (36–38) have shown patient marrow toxicities that were lower than expected based on marrow dose estimates from standard CBIST skeletal dose models (e.g., MIRDOSE2 and MIRDOSE3). Although various studies have been initiated to explain these discrepancies, including improvements in activity uptake quantification (39,40), the data of Table 3 indicate that perhaps values of marrow dose were simply overestimated in these studies, as the standard clinical models do not properly account for particle escape from marrow-filled regions of spongiosa. For both bone surface and volume sources, infinite spongiosa transport is shown in Table 3 to overestimate the femoral marrow self-dose by 10%–22% for 153Sm and 13%–24% for 186Re, whereas the vertebral marrow self-dose is overestimated by 6% for 153Sm and 9% for 186Re.
CONCLUSION
A PIRT model for skeletal dosimetry is presented in which electrons and β-particles are tracked simultaneously within 2 different segmented digital images: (a) an ex vivo CT image of the skeletal site with segmented regions of trabecular spongiosa, cortical bone, and surrounding tissues and (b) an ex vivo NMR microscopy image of the interior bone trabeculae and marrow cavity microstructure representative of that found within spongiosa regions of the ex vivo CT image. Example dose calculations under the PIRT methodology within the L4 vertebra and right proximal femur of an adult 66-y male subject demonstrate a divergence from standard infinite spongiosa transport (VBIST) methods at energies as low as 50–200 keV, depending on the source tissue and skeletal site. Calculations of radionuclide S values under both methodologies imply that current chord-based models used in clinical skeletal dosimetry may overestimate dose to active bone marrow in these 2 skeletal sites by ∼4%–23% for low-energy β-emitters (33P, 169Er, and 177Lu), by ∼4%–25% for intermediate-energy β-emitters (153Sm, 186Re, and 89Sr), and by ∼11%–30% for high-energy β-emitters (32P, 188Re, and 90Y). Higher errors are noted for bone-volume seekers, whereas lower errors are seen for source emissions within the active bone marrow. Though the proximal femur and lumbar vertebra are investigated in the present study, potentially larger errors in skeletal dosimetry are presumed to exist in skeletal sites with disproportionately smaller volumes of spongiosa (e.g., ribs, cranium, and sternum).
The PIRT methodology supersedes previous stylized modeling attempts by the UF ALRADS research group to account for the finite spatial extent of trabecular spongiosa and the presence of cortical bone. This approach thus renders obsolete any need for mathematic modeling of the either simple or complex bone site geometries. Furthermore, the technique increases the prospects for expanded availability of reference skeletal dosimetry models for both genders and of individuals of varying stature and skeletal size for use in radionuclide therapy treatment planning of cancer in which marrow toxicity is of concern.
Acknowledgments
This work was supported in part by grant CA96441 from the National Cancer Institute and grant DE-FG07-02ID14327 from the U.S. Department of Energy with the University of Florida.
Footnotes
Received Jul. 6, 2004; revision accepted Sep. 13, 2004.
For correspondence or reprints contact: Wesley E. Bolch, PhD, Advanced Laboratory for Radiation Dosimetry Studies, Department of Nuclear and Radiological Engineering, University of Florida, Gainesville, FL 32611-8300.
E-mail: wbolch{at}ufl.edu
REFERENCES
In this issue


Jump to section
Related Articles
Cited By...
- SPECT/CT Image-Derived Absorbed Dose to Red Marrow Correlates with Hematologic Toxicity in Patients Treated with [177Lu]Lu-DOTATATE
- Recombinant Human Thyroid-Stimulating Hormone Versus Thyroid Hormone Withdrawal in 124I PET/CT-Based Dosimetry for 131I Therapy of Metastatic Differentiated Thyroid Cancer
- MIRD Pamphlet No. 23: Quantitative SPECT for Patient-Specific 3-Dimensional Dosimetry in Internal Radionuclide Therapy
- Bone Marrow Dosimetry Using 124I-PET
- MRI Measurement of Bone Marrow Cellularity for Radiation Dosimetry
- Lognormal Distribution of Cellular Uptake of Radioactivity: Monte Carlo Simulation of Irradiation and Cell Killing in 3-Dimensional Populations in Carbon Scaffolds
- Spatial Distribution of Blood Vessels and CD34+ Hematopoietic Stem and Progenitor Cells Within the Marrow Cavities of Human Cancellous Bone
- Linear Regression Model for Predicting Patient-Specific Total Skeletal Spongiosa Volume for Use in Molecular Radiotherapy Dosimetry