
Main menu

  • Home
  • Content
    • Current
    • Ahead of print
    • Past Issues
    • JNM Supplement
    • SNMMI Annual Meeting Abstracts
    • Continuing Education
    • JNM Podcasts
  • Subscriptions
    • Subscribers
    • Institutional and Non-member
    • Rates
    • Journal Claims
    • Corporate & Special Sales
  • Authors
    • Submit to JNM
    • Information for Authors
    • Assignment of Copyright
    • AQARA requirements
  • Info
    • Reviewers
    • Permissions
    • Advertisers
  • About
    • About Us
    • Editorial Board
    • Contact Information
  • More
    • Alerts
    • Feedback
    • Help
    • SNMMI Journals
  • SNMMI
    • JNM
    • JNMT
    • SNMMI Journals
    • SNMMI

User menu

  • Subscribe
  • My alerts
  • Log in
  • My Cart

Search

  • Advanced search
Journal of Nuclear Medicine
  • SNMMI
    • JNM
    • JNMT
    • SNMMI Journals
    • SNMMI
  • Subscribe
  • My alerts
  • Log in
  • My Cart
Journal of Nuclear Medicine

Advanced Search

  • Home
  • Content
    • Current
    • Ahead of print
    • Past Issues
    • JNM Supplement
    • SNMMI Annual Meeting Abstracts
    • Continuing Education
    • JNM Podcasts
  • Subscriptions
    • Subscribers
    • Institutional and Non-member
    • Rates
    • Journal Claims
    • Corporate & Special Sales
  • Authors
    • Submit to JNM
    • Information for Authors
    • Assignment of Copyright
    • AQARA requirements
  • Info
    • Reviewers
    • Permissions
    • Advertisers
  • About
    • About Us
    • Editorial Board
    • Contact Information
  • More
    • Alerts
    • Feedback
    • Help
    • SNMMI Journals
  • View or Listen to JNM Podcast
  • Visit JNM on Facebook
  • Join JNM on LinkedIn
  • Follow JNM on Twitter
  • Subscribe to our RSS feeds
OtherClinical Investigations

Cause and Magnitude of the Error Induced by Oral CT Contrast Agent in CT-Based Attenuation Correction of PET Emission Studies

Elena Dizendorf, Thomas F. Hany, Alfred Buck, Gustav K. von Schulthess and Cyrill Burger
Journal of Nuclear Medicine May 2003, 44 (5) 732-738;
Elena Dizendorf
  • Find this author on Google Scholar
  • Find this author on PubMed
  • Search for this author on this site
Thomas F. Hany
  • Find this author on Google Scholar
  • Find this author on PubMed
  • Search for this author on this site
Alfred Buck
  • Find this author on Google Scholar
  • Find this author on PubMed
  • Search for this author on this site
Gustav K. von Schulthess
  • Find this author on Google Scholar
  • Find this author on PubMed
  • Search for this author on this site
Cyrill Burger
  • Find this author on Google Scholar
  • Find this author on PubMed
  • Search for this author on this site
  • Article
  • Figures & Data
  • Info & Metrics
  • PDF
Loading

Article Figures & Data

Figures

  • Tables
  • FIGURE 1.
    • Download figure
    • Open in new tab
    • Download powerpoint
    FIGURE 1.

    Linear attenuation coefficient extrapolated from narrow-beam measurements at different photon energies (4). Plots 1 and 2 represent content of iodine and barium in oral CT contrast agents Gastrografin and Micropaque Scanner, respectively, mixed with water, cortical bone (plot 3), and soft tissue (plot 4). High attenuation of bone at 511 keV is due to its high density.
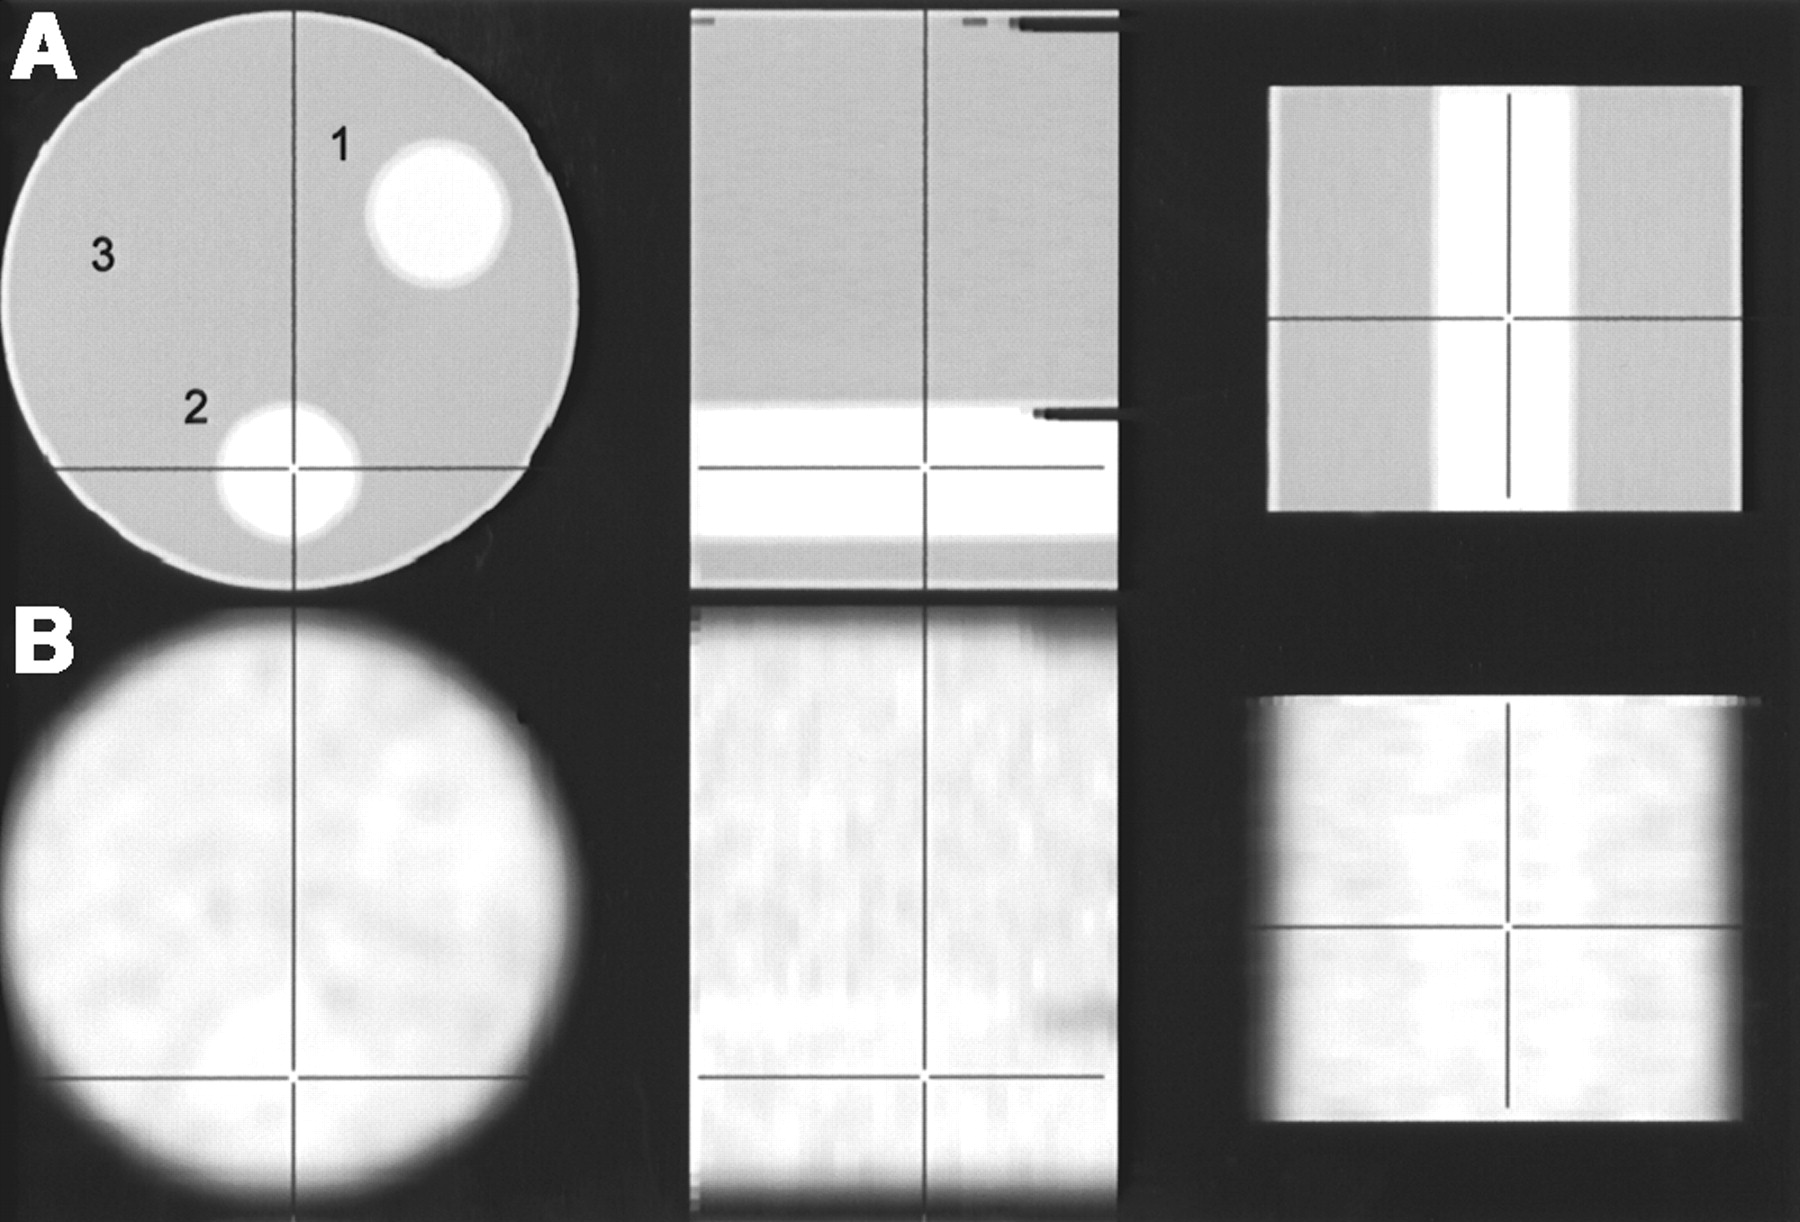
  • FIGURE 2.
    • Download figure
    • Open in new tab
    • Download powerpoint
    FIGURE 2.

    Attenuation images of NEMA phantom containing 2 cylindric acrylic inserts with oral CT contrast agent in clinical concentrations. Row A shows orthogonal CT sections (140 kV, 160 mA); row B shows matched PET transmission images acquired with 68Ge rods in 30 min. Slight attenuation increase originating from insert walls is notable in transmission images. 1 = Micropaque Scanner; 2 = Gastrografin; 3 = water.
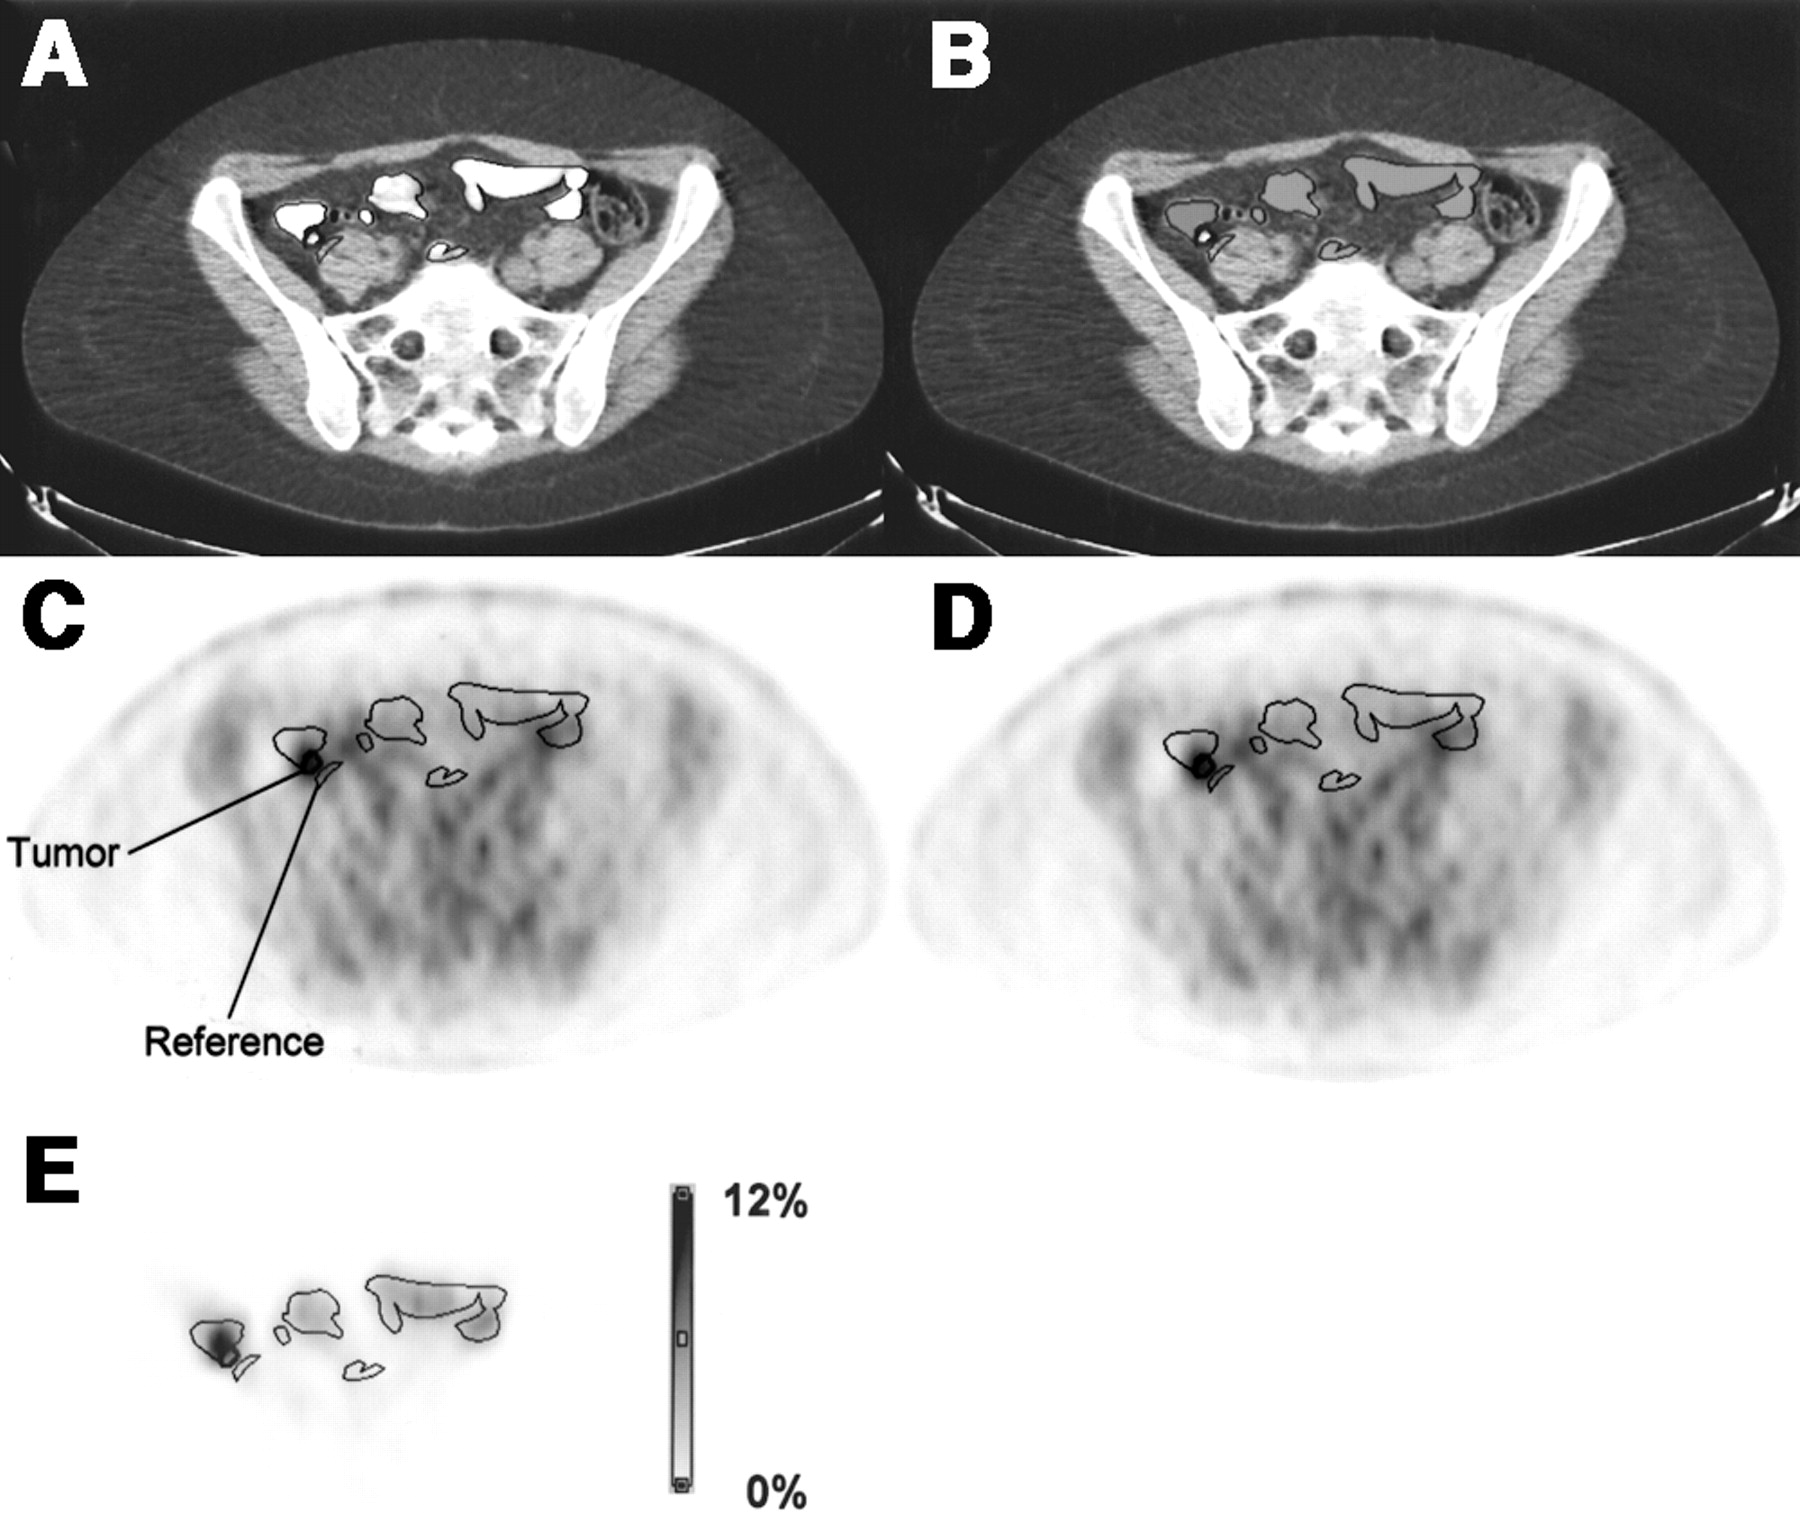
  • FIGURE 3.
    • Download figure
    • Open in new tab
    • Download powerpoint
    FIGURE 3.

    Example of the performed analysis. (A) CT image with thresholds [−160 HU, 240 HU] showing regions that define oral CT contrast, tumor, and reference tissue. (B) CT image after replacement of contrast-enhanced pixels by normal values. (C) PET emission image attenuation corrected with CT image A. (D) PET emission image attenuation corrected with CT image B, resulting in approximation of true 18F-FDG uptake. (E) Difference image C − D normalized to D, showing percentage error due to attenuation correction with CT contrast-enhanced pixels. Maximal difference is 9.6%.
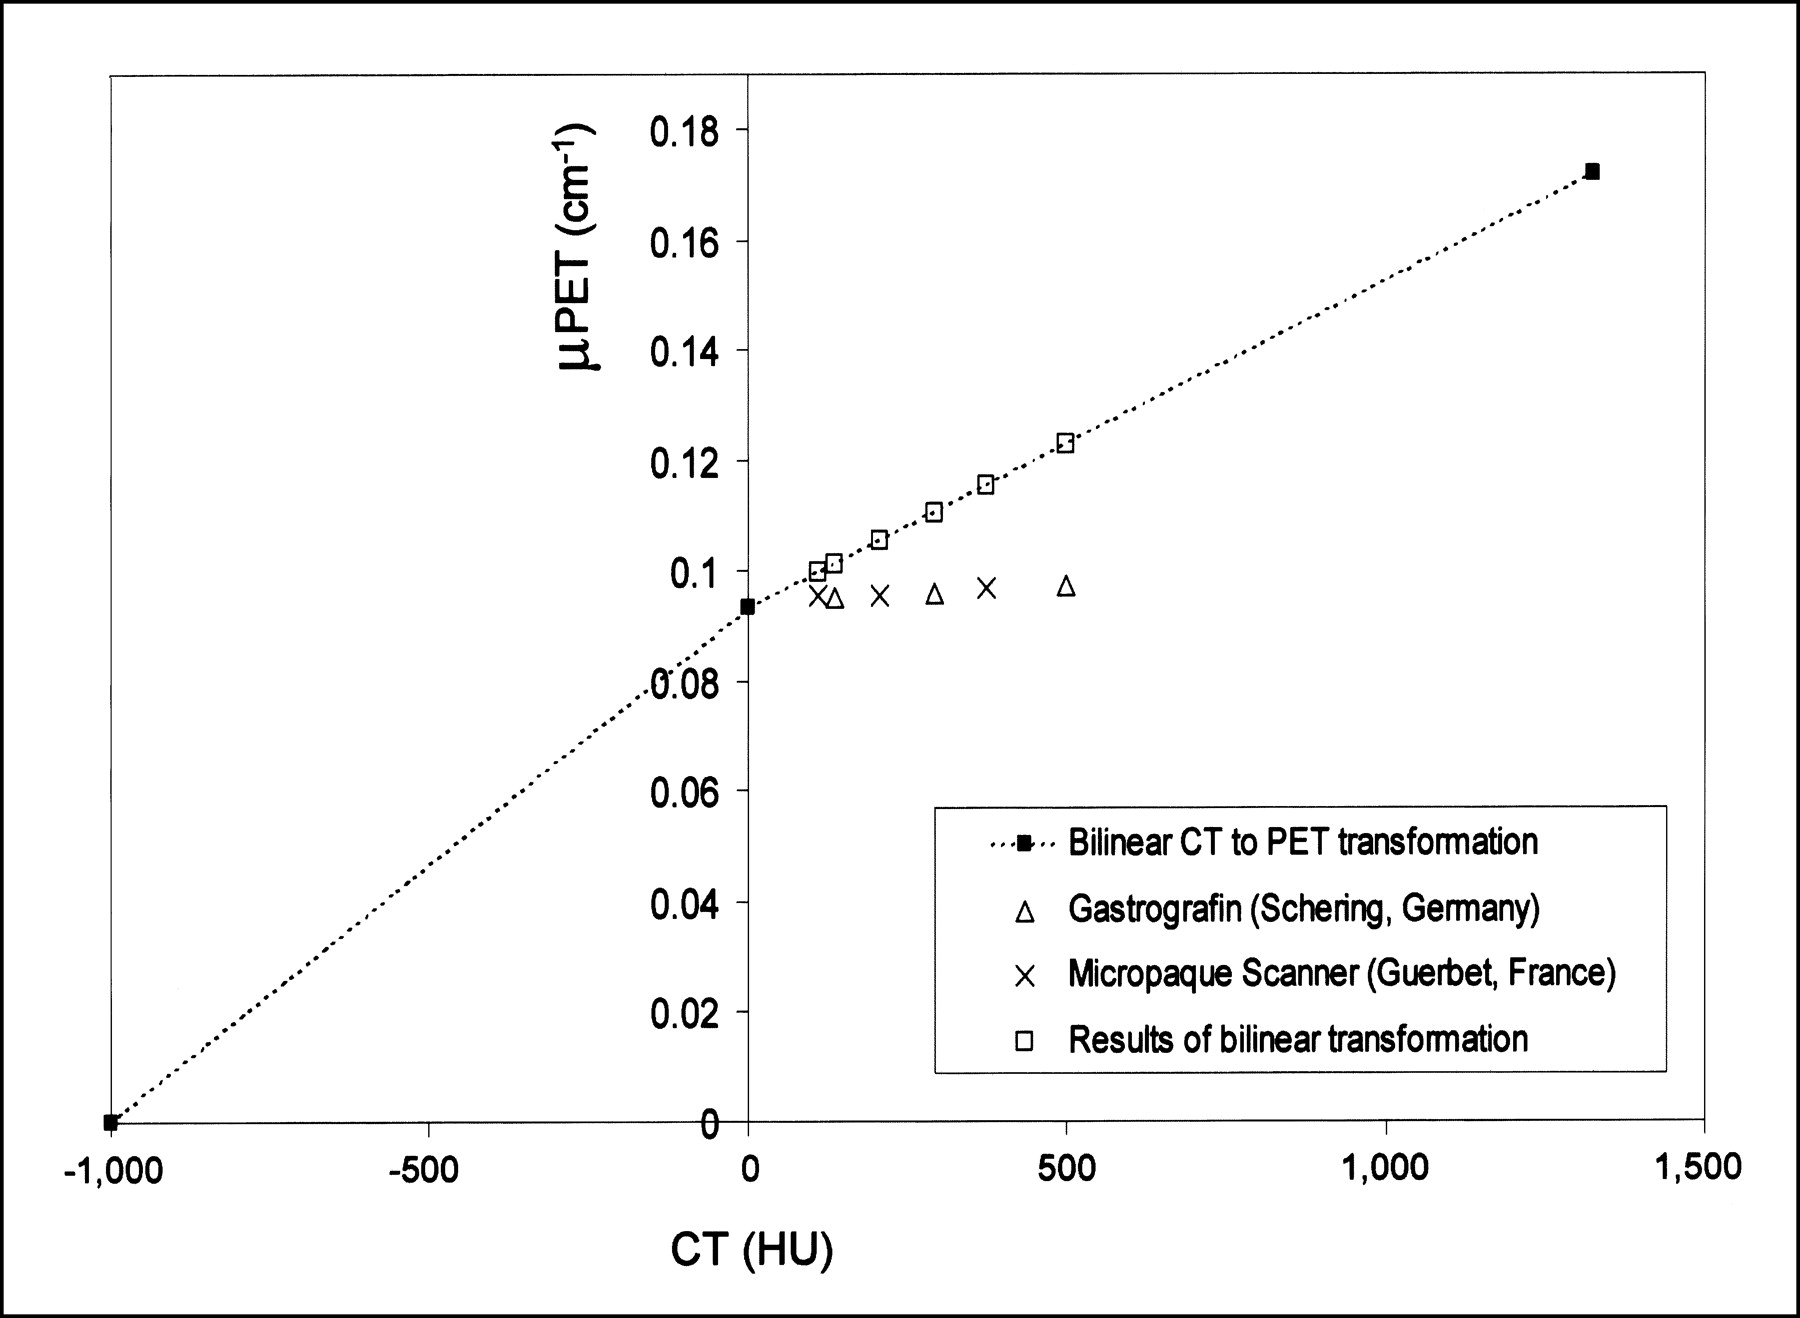
  • FIGURE 4.
    • Download figure
    • Open in new tab
    • Download powerpoint
    FIGURE 4.

    Average attenuation of 2 oral CT contrast agents at 3 different concentrations measured in CT and with PET 511-keV transmission scans. CT attenuation increases with increasing concentration of contrast agent. PET attenuation, however, depends minimally on concentration of contrast agent and is only slightly higher than attenuation of water. Transformation applied by scanner software to convert CT numbers into PET attenuation coefficients in Discovery LS scanner is indicated as dashed line (3). If it is applied to measured CT numbers, too high PET attenuation coefficients are calculated (□).
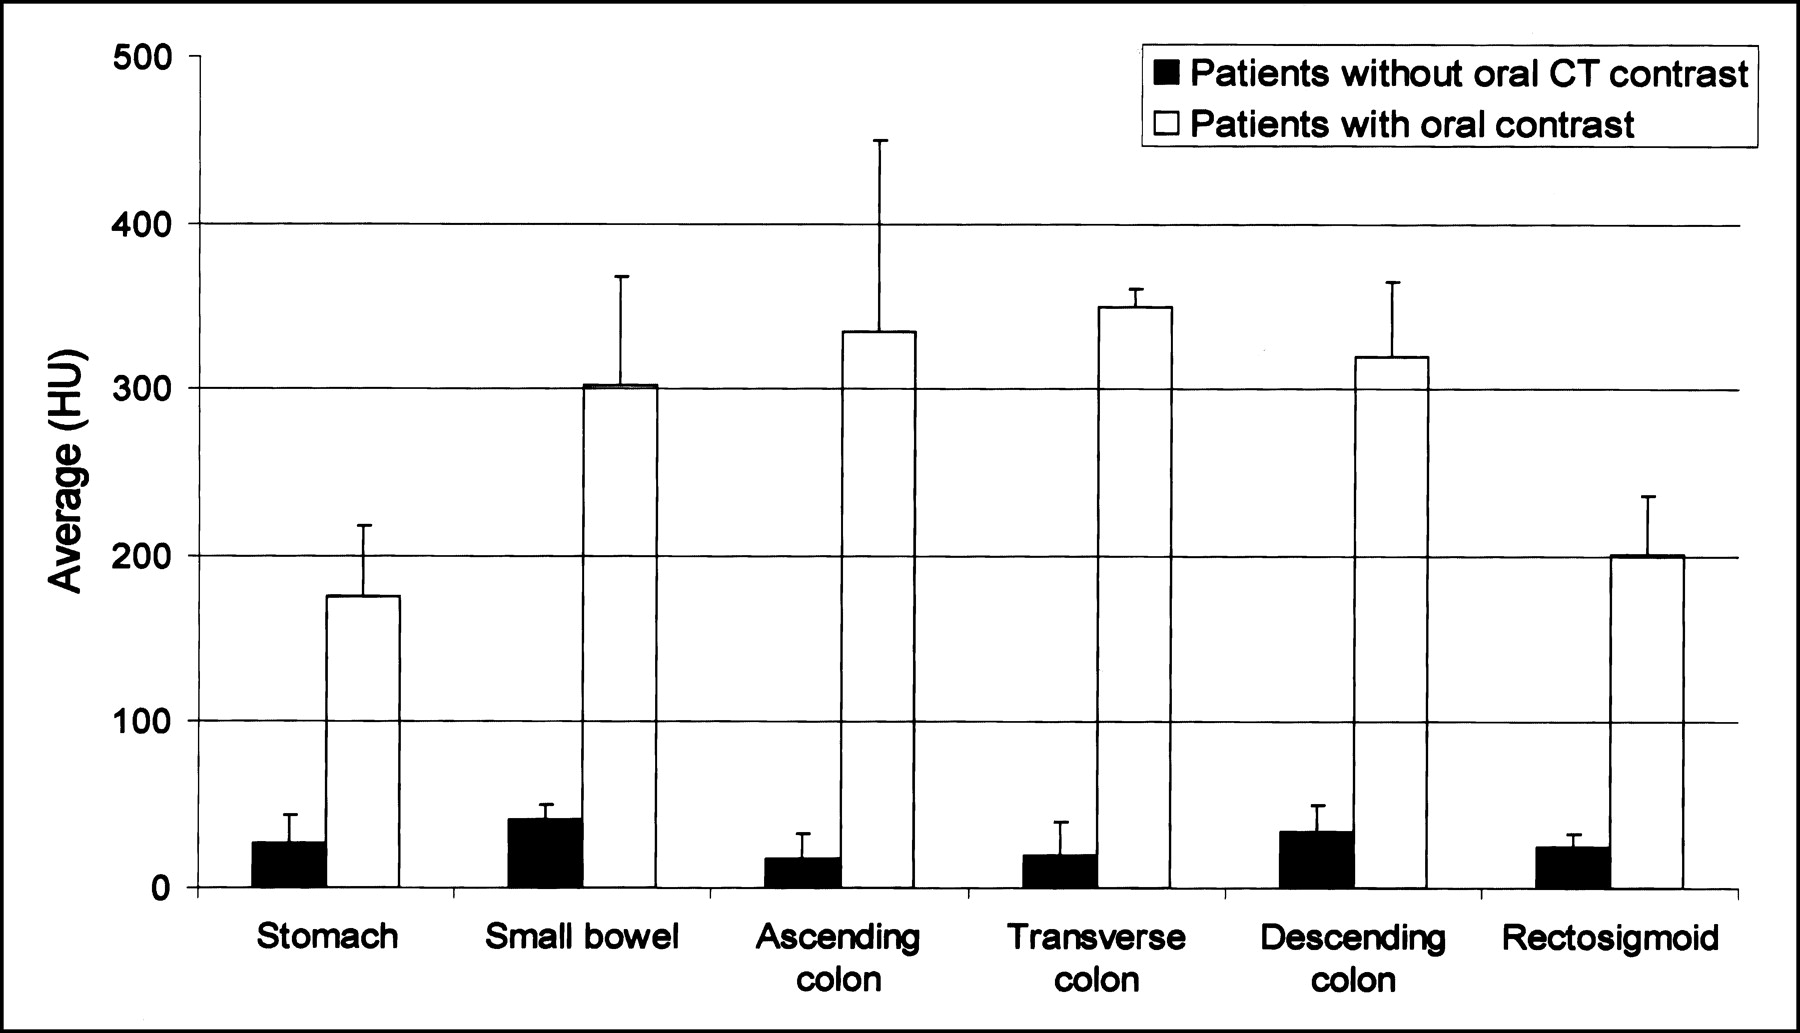
  • FIGURE 5.
    • Download figure
    • Open in new tab
    • Download powerpoint
    FIGURE 5.

    Average HU and SD measured in different sections of gastrointestinal tract for control group studied without oral contrast agent and for patient group.
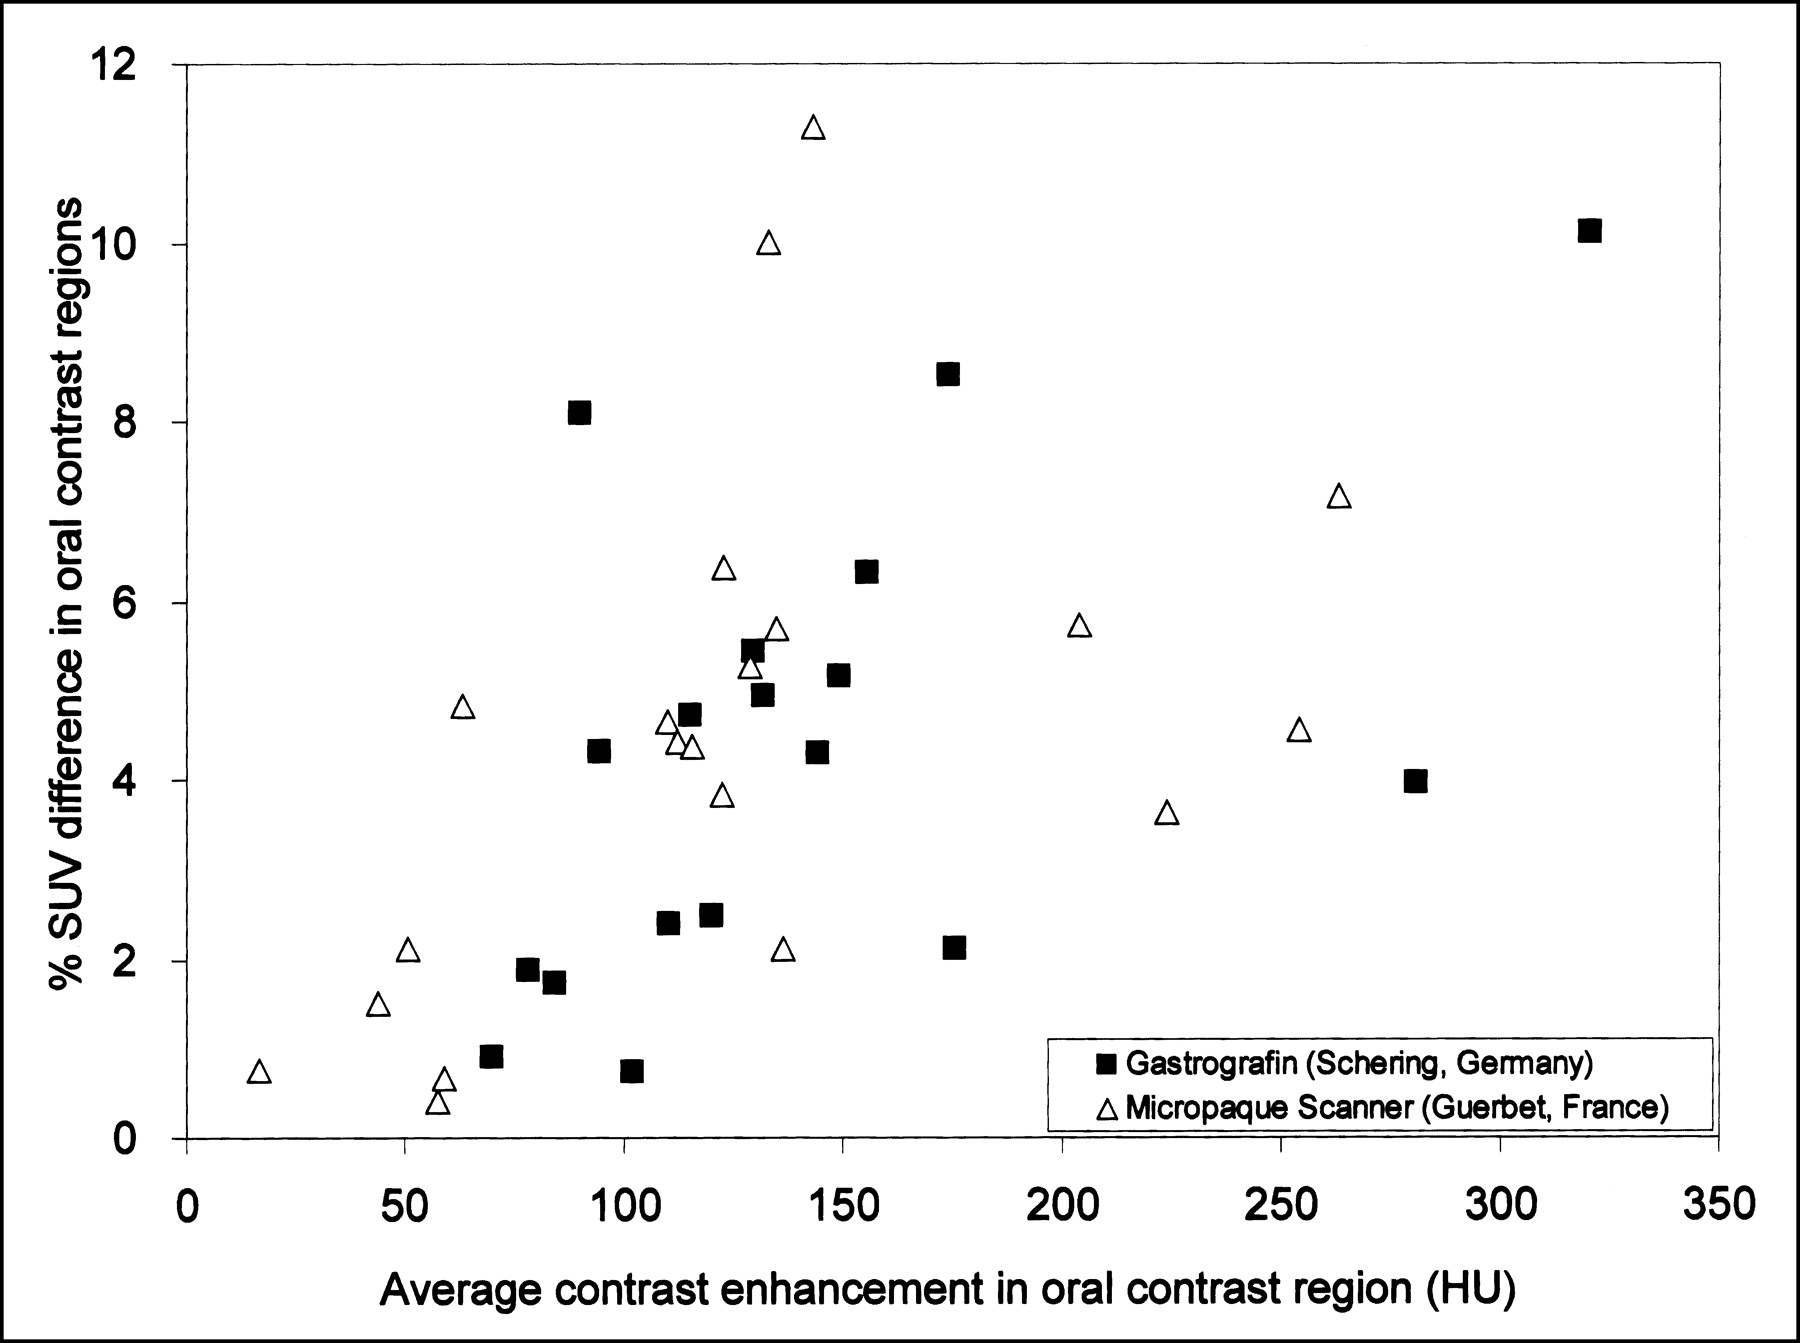
  • FIGURE 6.
    • Download figure
    • Open in new tab
    • Download powerpoint
    FIGURE 6.

    Overestimation of SUV in image regions containing oral CT contrast agent. Shown is percentage SUV error induced by CT-based PET attenuation correction with contrast enhancement present in CT images.
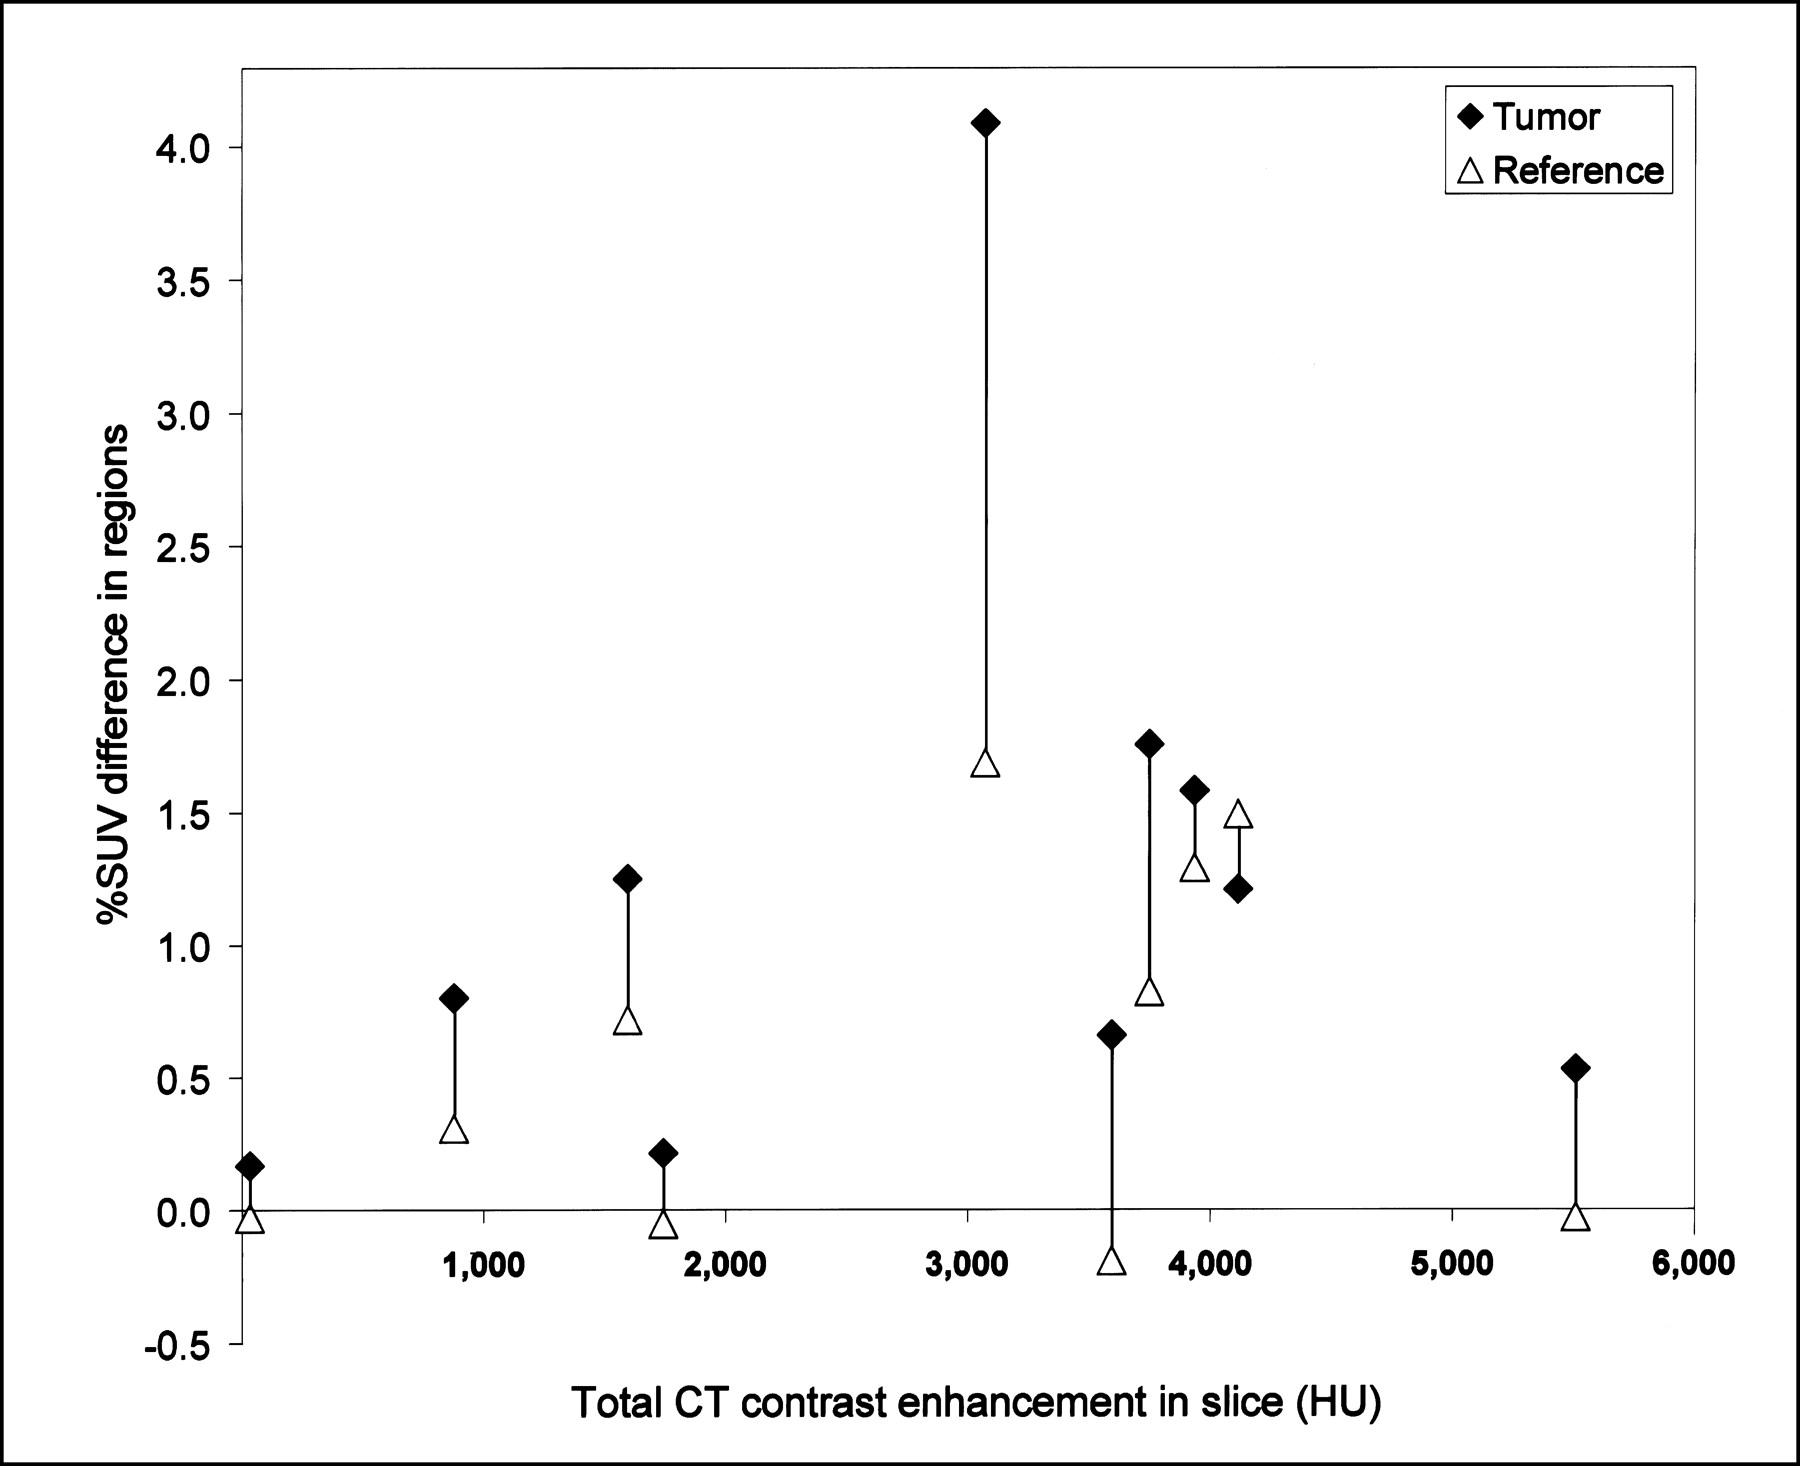
  • FIGURE 7.
    • Download figure
    • Open in new tab
    • Download powerpoint
    FIGURE 7.

    Overestimation of SUV in image regions absent of oral CT contrast agent. Shown is percentage SUV error induced by CT-based PET attenuation correction with CT contrast enhancement present in other parts of image.

Tables

  • Figures
    • View popup
    TABLE 1

    CT Values Measured in ROIs of Different Gastrointestinal Tract Sections

    SectionControl groupPatient group
    Mean ± SDMaximumnMean ± SDMaximumn
    Stomach25.9 ± 18.1175.010175.6 ± 42.2366.09
    Small bowel40.5 ± 9.6146.010302.6 ± 65.8485.010
    Ascending colon17.1 ± 15.1171.010335.0 ± 115.8520.05
    Transverse colon18.9 ± 20.8118.010350.0 ± 11.3488.04
    Descending colon33.5 ± 15.9156.010319.7 ± 45.3440.03
    Rectosigmoid23.9 ± 9.0170.010201.0 ± 35.1340.02
    • Data are in HU.

PreviousNext
Back to top

In this issue

Journal of Nuclear Medicine
Vol. 44, Issue 5
May 1, 2003
  • Table of Contents
  • Index by author
Print
Download PDF
Article Alerts
Sign In to Email Alerts with your Email Address
Email Article

Thank you for your interest in spreading the word on Journal of Nuclear Medicine.

NOTE: We only request your email address so that the person you are recommending the page to knows that you wanted them to see it, and that it is not junk mail. We do not capture any email address.

Enter multiple addresses on separate lines or separate them with commas.
Cause and Magnitude of the Error Induced by Oral CT Contrast Agent in CT-Based Attenuation Correction of PET Emission Studies
(Your Name) has sent you a message from Journal of Nuclear Medicine
(Your Name) thought you would like to see the Journal of Nuclear Medicine web site.
Citation Tools
Cause and Magnitude of the Error Induced by Oral CT Contrast Agent in CT-Based Attenuation Correction of PET Emission Studies
Elena Dizendorf, Thomas F. Hany, Alfred Buck, Gustav K. von Schulthess, Cyrill Burger
Journal of Nuclear Medicine May 2003, 44 (5) 732-738;

Citation Manager Formats

  • BibTeX
  • Bookends
  • EasyBib
  • EndNote (tagged)
  • EndNote 8 (xml)
  • Medlars
  • Mendeley
  • Papers
  • RefWorks Tagged
  • Ref Manager
  • RIS
  • Zotero
Share
Cause and Magnitude of the Error Induced by Oral CT Contrast Agent in CT-Based Attenuation Correction of PET Emission Studies
Elena Dizendorf, Thomas F. Hany, Alfred Buck, Gustav K. von Schulthess, Cyrill Burger
Journal of Nuclear Medicine May 2003, 44 (5) 732-738;
Twitter logo Facebook logo LinkedIn logo Mendeley logo
  • Tweet Widget
  • Facebook Like
  • Google Plus One
Bookmark this article

Jump to section

  • Article
    • Abstract
    • MATERIALS AND METHODS
    • RESULTS
    • DISCUSSION
    • CONCLUSION
    • Acknowledgments
    • Footnotes
    • REFERENCES
  • Figures & Data
  • Info & Metrics
  • PDF

Related Articles

  • No related articles found.
  • PubMed
  • Google Scholar

Cited By...

  • SPECT/CT Assessment of Infected Intracardiac Devices With and Without Attenuation Correction
  • Standards for PET Image Acquisition and Quantitative Data Analysis
  • Measuring Response with FDG-PET: Methodological Aspects
  • Integrated PET/CT in the staging of nonsmall cell lung cancer: technical aspects and clinical integration
  • Limitations of CT During PET/CT
  • Effective Methods to Correct Contrast Agent-Induced Errors in PET Quantification in Cardiac PET/CT
  • Evaluation of Image Registration in PET/CT of the Liver and Recommendations for Optimized Imaging
  • Detection of extrapulmonary lesions with integrated PET/CT in the staging of lung cancer
  • The 2006 Henry N. Wagner Lecture: Of Mice and Men (and Positrons)--Advances in PET Imaging Technology
  • PET/CT in Lymphoma: Prospective Study of Enhanced Full-Dose PET/CT Versus Unenhanced Low-Dose PET/CT
  • Procedure Guideline for SPECT/CT Imaging 1.0
  • PET/CT Imaging Artifacts
  • Concurrent PET/CT with an Integrated Imaging System: Intersociety Dialogue from the Joint Working Group of the American College of Radiology, the Society of Nuclear Medicine, and the Society of Computed Body Tomography and Magnetic Resonance
  • Do Implanted Pacemaker Leads and ICD Leads Cause Metal-Related Artifact in Cardiac PET/CT?
  • Optimized Intravenous Contrast Administration for Diagnostic Whole-Body 18F-FDG PET/CT
  • Accuracy of Whole-Body Dual-Modality Fluorine-18-2-Fluoro-2-Deoxy-D-Glucose Positron Emission Tomography and Computed Tomography (FDG-PET/CT) for Tumor Staging in Solid Tumors: Comparison With CT and PET
  • Technical Issues in Performing PET Studies in Pediatric Patients
  • To Enhance or Not to Enhance? 18F-FDG and CT Contrast Agents in Dual-Modality 18F-FDG PET/CT
  • PET/CT: Panacea, Redundancy, or Something in Between?
  • PET/CT in Colorectal Cancer
  • Google Scholar

More in this TOC Section

  • Feasibility of Ultra-Low-Activity 18F-FDG PET/CT Imaging Using a Long–Axial-Field-of-View PET/CT System
  • Cardiac Presynaptic Sympathetic Nervous Function Evaluated by Cardiac PET in Patients with Chronotropic Incompetence Without Heart Failure
  • Validation and Evaluation of a Vendor-Provided Head Motion Correction Algorithm on the uMI Panorama PET/CT System
Show more Clinical Investigations

Similar Articles

SNMMI

© 2025 SNMMI

Powered by HighWire