


Article Figures & Data
Figures
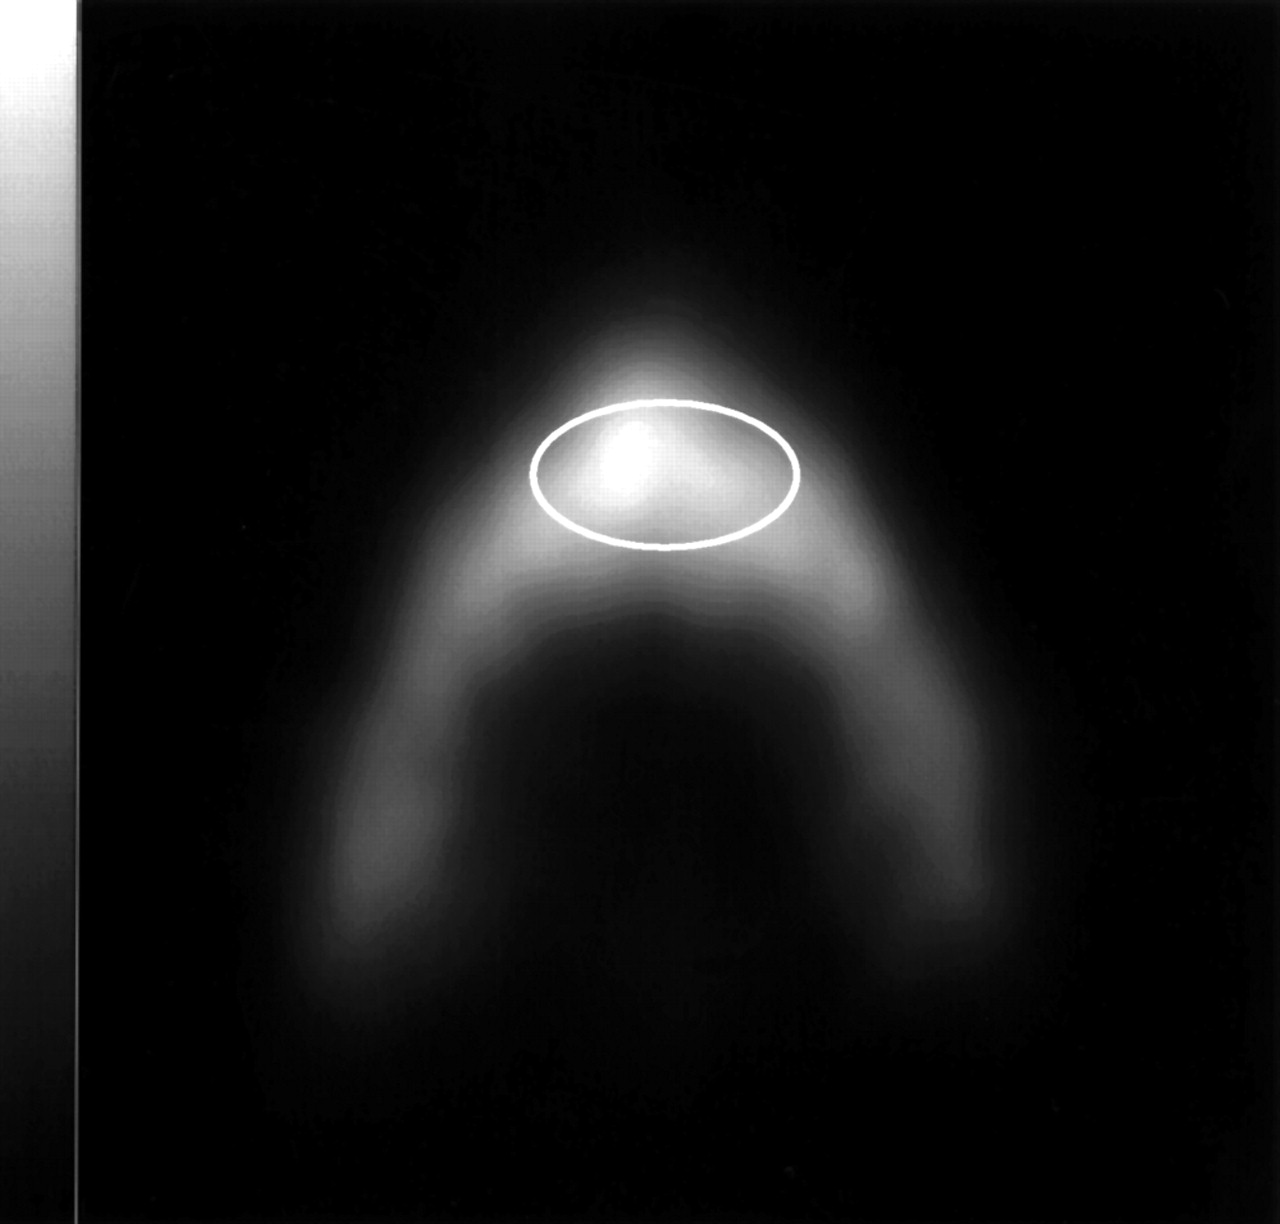
- FIGURE 1.
Transaxial [18F]fluoride ion PET of lumbar vertebra of mini pig. Image was obtained after intravenous injection of 11.0 MBq of [18F]fluoride ion per kilogram of body weight (frame between 110 and 120 min). Oval ROI (1.1 cm2) is defined in center of vertebral body (image scale, 0–206 kBq/cm3).
- FIGURE 2.
Typical time courses of decay-corrected activities from 18F in arterial plasma (•) and bone tissue (◊) of ROI in Figure 1. Dotted line with ▴ represents least squares fit to measured tissue data. Dashed line with ▿ illustrates unbound tracer activity within bone tissue, and dashed line with ▪ illustrates bound tracer activity within bone tissue.
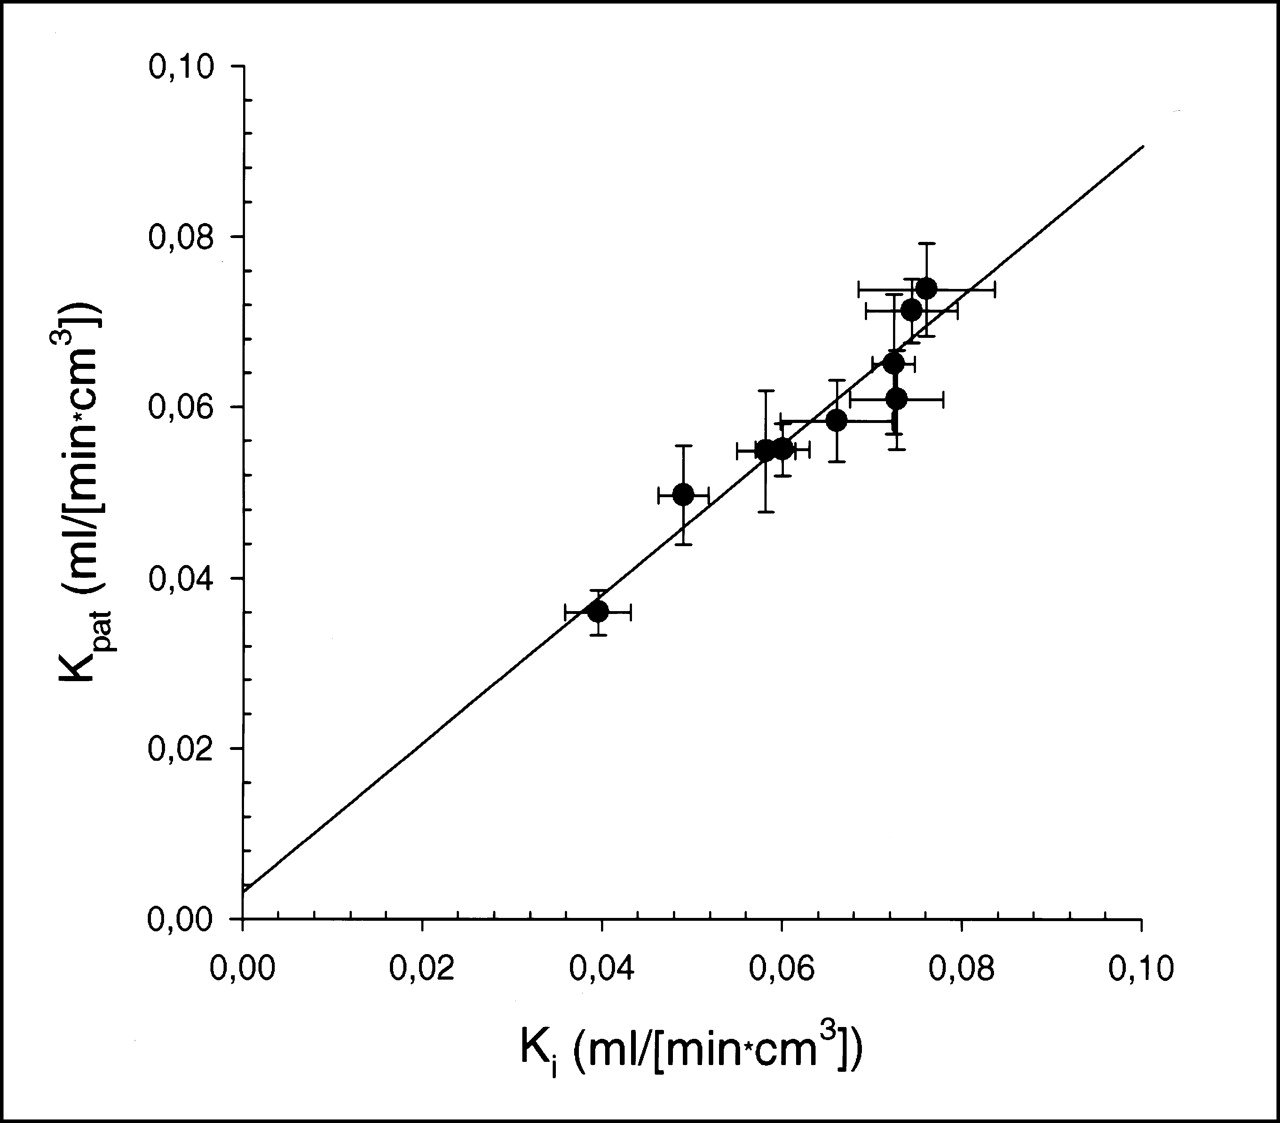
- FIGURE 3.
Plot of macroparameters for [18F]fluoride ion influx rates Ki and Kpat. Data represent mean of 6 ROIs with their respective SDs as error bars in both directions (x- and y-axes). Linear regression analysis yielded highly significant correlation (y = 0.003 + 0.87x; r2 = 0.92; P < 0.001).
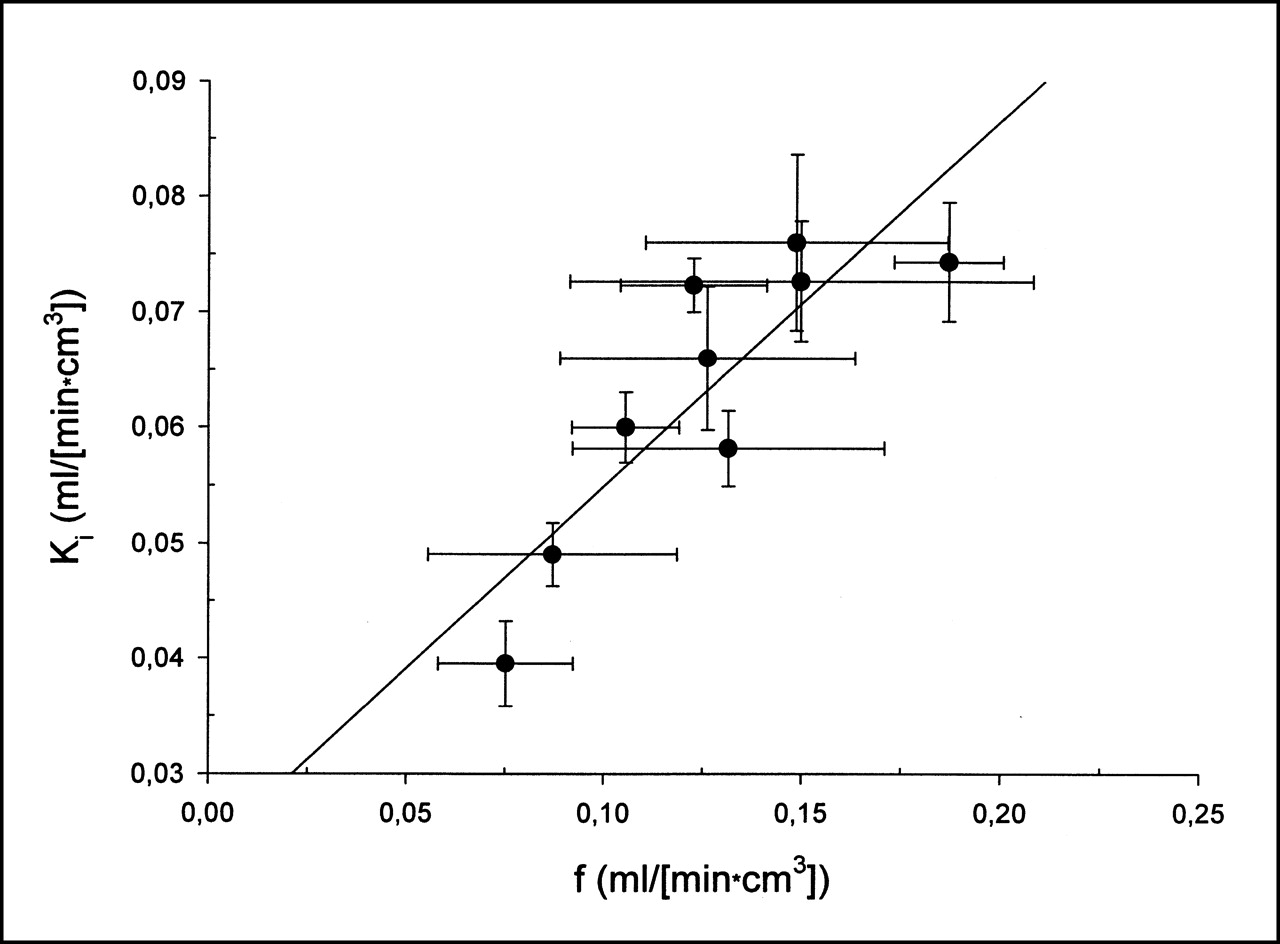
- FIGURE 4.
Plot of blood flow estimates f and [18F]fluoride ion influx rate Ki. Data represent mean of 6 ROIs with their respective SDs as error bars in both directions (x- and y-axes). Linear regression analysis yielded highly significant correlation (y = 0.023 + 0.32x; r2 = 0.74; P < 0.001).
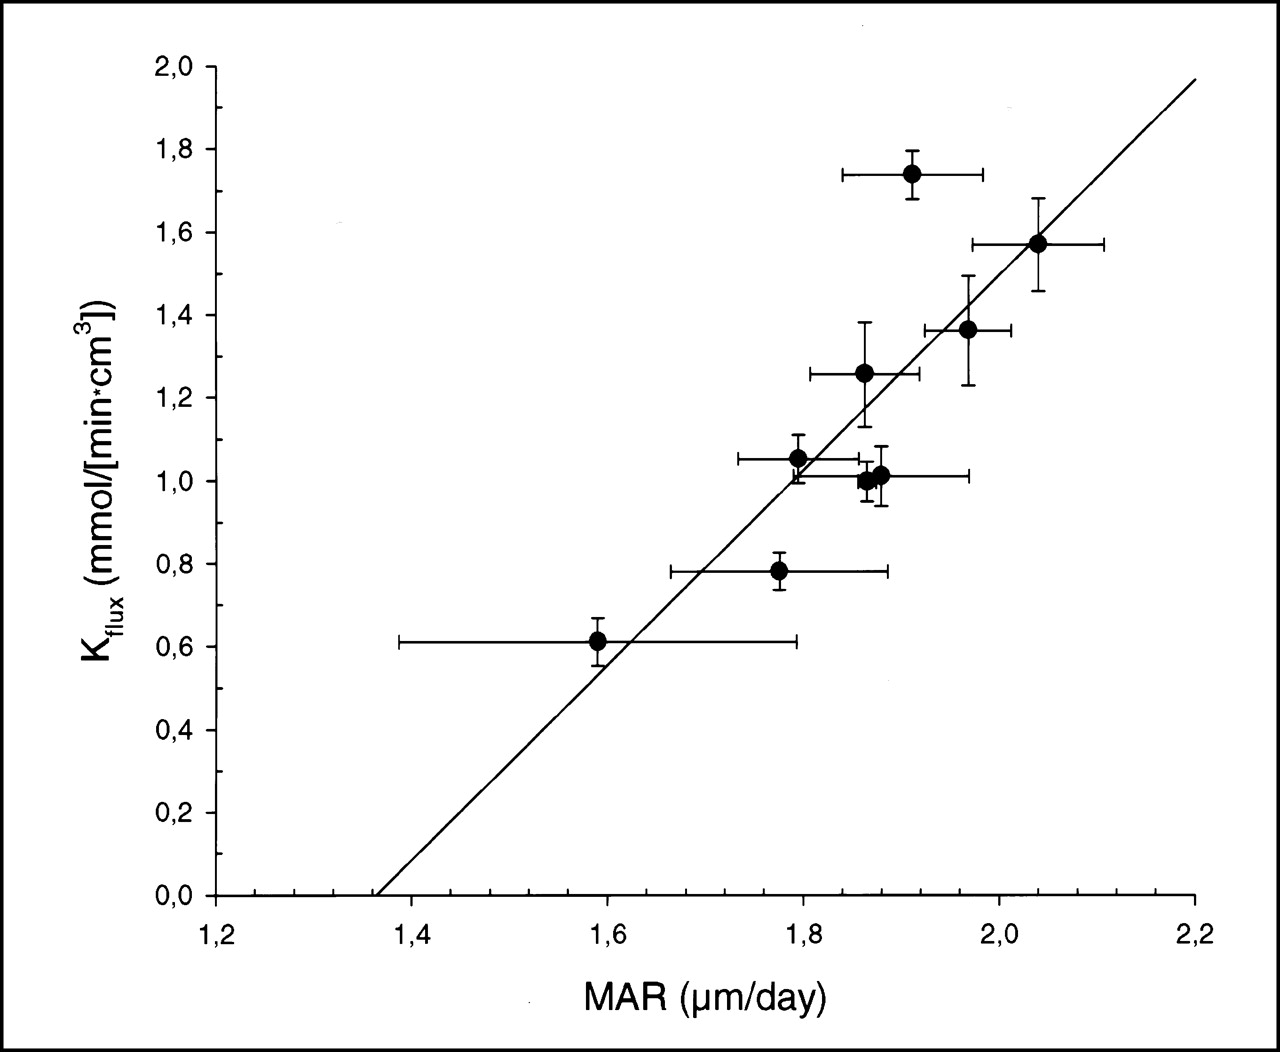
- FIGURE 5.
Plot of MAR obtained from iliac crest bone biopsies versus fluoride volume flux (Kflux) in 9 mini pigs. Data represent mean of 20 sites of particular bone biopsy and 6 ROIs with their respective SDs as error bars in both directions (x- and y-axes). Linear regression analysis yielded highly significant correlation (y = −3.2 + 2.23x; r2 = 0.65; P < 0.01).


Tables
Parameter Mean ± SD Fluoride ion in plasma (nmol/L) 18.0 ± 3.4* Calcium (mmol/L) 2.6 ± 0.2* Phosphate (mmol/L) 1.6 ± 0.2* Alkaline phosphate (units/L) 87.0 ± 63.0* Parathyroid hormone (pmol/L) 6.7 ± 1.5* Albumin (μmol/L) 548.0 ± 46.0* Iron (μmol/L) 24.6 ± 4.1* Hemoglobin (mmol/L) 5.4 ± 2.1† Arterial pCO2 (mm Hg) 33.3 ± 4.7† Arterial pO2 (mm Hg) 277.1 ± 89.3† Heart rate (min−1) 104.0 ± 25.0† Mean arterial blood pressure (mm Hg) 77.2 ± 10.4† Pig no. Age (y) f (mL/[min · cm3]) E K1 (mL/[min · cm3]) k2 (min−1) k3 (min−1) k4 (min−1) BV (mL/cm3) Ki (mL/[min · cm3]) Kflux (μmol/[min · L]) Kpat (mL/[min · cm3]) Kpat120 (mL/[min · cm3]) 1 6.7 0.075 ± 0.017 0.95 ± 0.32 0.068 ± 0.015 0.096 ± 0.108 0.113 ± 0.089 0.005 ± 0.003 0.034 ± 0.017 0.040 ± 0.004 0.610 ± 0.058 0.036 ± 0.002 0.032 ± 0.002 2 3.1 0.132 ± 0.039 0.82 ± 0.27 0.100 ± 0.016 0.025 ± 0.012 0.037 ± 0.018 0.003 ± 0.002 0.058 ± 0.010 0.058 ± 0.003 1.052 ± 0.058 0.055 ± 0.007 0.032 ± 0.002 3 2.2 0.196 ± 0.017 0.73 ± 0.08 0.142 ± 0.006 0.038 ± 0.013 0.044 ± 0.017 0.004 ± 0.003 0.030 ± 0.029 0.076 ± 0.003 1.031 ± 0.046 0.073 ± 0.002 0.051 ± 0.005 4 3.3 0.149 ± 0.058 1.00 ± 0.06 0.131 ± 0.014 0.251 ± 0.171 0.292 ± 0.159 0.008 ± 0.001 0.024 ± 0.010 0.073 ± 0.005 1.568 ± 0.112 0.061 ± 0.006 0.052 ± 0.004 5 2.5 0.087 ± 0.032 0.81 ± 0.01 0.069 ± 0.018 0.053 ± 0.041 0.134 ± 0.046 0.021 ± 0.048 0.040 ± 0.021 0.049 ± 0.003 0.780 ± 0.046 0.050 ± 0.006 0.042 ± 0.005 6 3.9 0.122 ± 0.019 0.88 ± 0.11 0.106 ± 0.009 0.046 ± 0.051 0.106 ± 0.127 0.008 ± 0.004 0.032 ± 0.025 0.072 ± 0.002 1.736 ± 0.058 0.065 ± 0.008 0.058 ± 0.008 7 6.7 0.149 ± 0.038 0.90 ± 0.23 0.126 ± 0.010 0.049 ± 0.032 0.076 ± 0.045 0.005 ± 0.004 0.008 ± 0.010 0.076 ± 0.008 1.255 ± 0.126 0.074 ± 0.006 0.064 ± 0.003 8 1.5 0.106 ± 0.014 0.88 ± 0.17 0.092 ± 0.011 0.050 ± 0.041 0.088 ± 0.060 0.006 ± 0.003 0.018 ± 0.005 0.060 ± 0.003 0.997 ± 0.047 0.055 ± 0.003 0.050 ± 0.003 9 1.6 0.126 ± 0.037 0.97 ± 0.36 0.112 ± 0.014 0.127 ± 0.119 0.167 ± 0.124 0.009 ± 0.006 0.026 ± 0.024 0.066 ± 0.006 1.360 ± 0.133 0.058 ± 0.005 0.052 ± 0.005 All pigs 3.5 ± 2.0 0.127 ± 0.036 0.89 ± 0.10 0.105 ± 0.026 0.081 ± 0.071 0.117 ± 0.077 0.008 ± 0.005 0.030 ± 0.014 0.063 ± 0.012 1.154 ± 0.360 0.058 ± 0.011 0.050 ± 0.009 Data are for 6 vertebral bodies of each mini pig. In addition, estimates of f and E derived from K1 values using permeability surface product of 0.25 min−1 are given. [18F]fluoride ion influx rate was also estimated with Patlak graphic approach using 2 different intervals (20–60 and 40–120 min).
Pig no. MAR (μm/d) B.Pm. (μm/mm2) Tb.Wi. (μm) B.Ar. (%) O.Wi. (μm) O.Ar. (%) Osteoblasts (No./mm2) Osteoclasts (No./mm2) 1 1.59 5,158.0 84.0 21.7 4.7 1.4 16.5 2.2 2 1.44 6,092.0 86.0 26.2 4.7 1.7 24.9 3.2 3 1.88 6,422.0 86.0 27.5 6.2 2.5 31.1 4.2 4 2.04 4,027.0 137.0 27.6 5.4 1.6 21.6 3.1 5 1.78 6,252.0 95.0 29.7 4.6 1.1 22.4 3.9 6 1.91 4,559.0 121.0 27.5 5.5 1.1 19.6 2.5 7 1.86 5,375.0 111.0 30.0 5.8 2.7 38.8 2.2 8 1.87 3,549.0 144.0 26.5 5.1 1.6 25.8 2.2 9 1.97 3,872.0 108.0 21.0 5.2 2.1 27.9 3.7 Mean ± SD 1.84 ± 0.11 5,034.0 ± 1,087.2 108.0 ± 22.4 26.4 ± 3.1 5.2 ± 0.5 1.8 ± 0.6 25.4 ± 6.6 3.1 ± 1.1 B.Pm. = trabecular bone perimeter; Tb.Wi. = trabecular width; B.Ar. = area of trabecular bone; O.Wi. = osteoid width; and O.Ar. = osteoid area.
MAR was calculated using double tetracycline labeling.
In this issue


Jump to section
Related Articles
Cited By...
- Is Response Assessment of Breast Cancer Bone Metastases Better with Measurement of 18F-Fluoride Metabolic Flux Than with Measurement of 18F-Fluoride PET/CT SUV?
- Quantification of 18F-Fluoride Kinetics: Evaluation of Simplified Methods
- Dynamic Bone Imaging with 99mTc-Labeled Diphosphonates and 18F-NaF: Mechanisms and Applications
- Semiautomatic Region-of-Interest Validation at the Femur in 18F-Fluoride PET/CT
- Molecular Mechanisms of Bone 18F-NaF Deposition
- Kinetic Analysis of 18F-Fluoride PET Images of Breast Cancer Bone Metastases
- Effects of Alendronate on Bone Metabolism in Glucocorticoid-Induced Osteoporosis Measured by 18F-Fluoride PET: A Prospective Study
- Quantitative Radionuclide Studies of Bone
- Long-Term Precision of 18F-Fluoride PET Skeletal Kinetic Studies in the Assessment of Bone Metabolism
- Characterization of Osteolytic, Osteoblastic, and Mixed Lesions in a Prostate Cancer Mouse Model Using 18F-FDG and 18F-Fluoride PET/CT
- Skeletal PET with 18F-Fluoride: Applying New Technology to an Old Tracer
- 18F-Fluoride PET for Monitoring Therapeutic Response in Paget's Disease of Bone
- Comparison of Different Quantitative Approaches to 18F-Fluoride PET Scans
- PET Imaging of Osteosarcoma
- Increased Sensitivity in Detection of a Porcine High-Turnover Osteopenia After Total Gastrectomy by Dynamic 18F-Fluoride Ion PET and Quantitative CT