


Abstract
18F-fluoride PET is a promising noninvasive method for measuring bone metabolism and bone blood flow. The purpose of this study was to assess the performance of various clinically useful simplified methods by comparing them with full kinetic analysis. In addition, the validity of deriving bone blood flow from K1 of 18F-fluoride was investigated using 15O-H2O as a reference. Methods: Twenty-two adults (mean age ± SD, 44.8 ± 25.2 y), including 16 patients scheduled for bone surgery and 6 healthy volunteers, were studied. All patients underwent dynamic 15O-H2O and 18F-fluoride scans before surgery. Ten of these patients had serial PET measurements before and at 2 time points after local bone surgery. During all PET scans, arterial blood was monitored continuously. 18F-fluoride data were analyzed using nonlinear regression (NLR) and several simplified methods (Patlak and standardized uptake value [SUV]). SUV was evaluated for different time intervals after injection and after normalizing to body weight, lean body mass, and body surface area, and simplified measurements were compared with NLR results. In addition, changes in SUV and Patlak-derived fluoride influx rate (Ki) after surgery were compared with corresponding changes in NLR-derived Ki. Finally, 18F-fluoride K1 was compared with bone blood flow derived from 15O-H2O data, using the standard single-tissue-compartment model. Results: K1 of 18F-fluoride correlated with measured blood flow, but the correlation coefficient was relatively low (r = 0.35, P < 0.001). NLR resulted in a mean Ki of 0.0160 ± 0.0122, whereas Patlak analysis, for the interval 10–60 min after injection, resulted in an almost-identical mean Ki of 0.0161 ± 0.0117. The Patlak-derived Ki, for 10–60 min after injection, showed a high correlation with the NLR-derived Ki (r = 0.976). The highest correlation between Ki and lean body mass–normalized SUV was found for the interval 50–60 min (r = 0.958). Finally, changes in SUV correlated significantly with those in Ki (r = 0.97). Conclusion: The present data support the use of both Patlak and SUV for assessing fluoride kinetics in humans. However, 18F-fluoride PET has only limited accuracy in monitoring bone blood flow.
The uptake of 18F-fluoride in the skeleton depends both on bone blood flow (BBF) and on osteoblastic activity. In an experimental study, a significant correlation was found between 18F-fluoride kinetics in porcine bone and a histomorphometric index of bone formation (1). Quantitative 18F-fluoride PET has been used for the evaluation of hip revision surgery, bone graft viability, and medical treatment of osteoporosis (2–4). Quantification of 18F-fluoride kinetics has been performed using several methods. Hawkins et al. used a 2-tissue-compartment model together with nonlinear regression (NLR) to estimate 4 kinetic parameters (5). NLR in combination with an appropriate compartment model provides the most accurate method to quantify 18F-fluoride uptake, but it is also the most complicated one. Simpler methods for quantification of 18F-fluoride uptake have been proposed, including Gjedde–Patlak graphical analysis and calculation of standardized uptake value (SUV) (3,5–7). In healthy volunteers, a good correspondence between NLR and Patlak was observed (5). Moreover, Brenner et al. found significant linear relationships between NLR and Patlak-derived fluoride influx rate (Ki) values and between NLR-derived Ki and SUV (7). Hence, these simplified methods may be useful for quantifying fluoride uptake. On the other hand, in the latter study (7), kinetic modeling was based on venous blood samples, resulting in a dispersed (i.e., biased) input function. Furthermore, in humans, the ratio of venous to arterial 18F-fluoride activity may not be constant during the first 20 min after injection (8). Consequently, venous sampling is not ideal for quantitative kinetic analysis, and it is well accepted that arterial sampling is the gold standard for defining the input function.
BBF may have a significant role in normal bone metabolism, and an altered BBF might be important in bone disease. BBF can be measured using 15O-H2O PET (3,4,9,10), but 18F-fluoride PET has been used as an alternative for evaluating bone perfusion (9). Use of 18F-fluoride for bone perfusion is based on the high extraction fraction of fluoride, which has been demonstrated in an experimental rabbit model (11). Therefore, K1 (extraction fraction × BBF) derived from kinetic analysis of 18F-fluoride data may possibly be used as an estimate of BBF. Experimental studies in pigs have shown a relationship between BBF and 18F-fluoride K1 (9). To date, however, confirmation of this relationship in humans is lacking.
The purpose of this study was to compare SUV and Patlak measures of 18F-fluoride uptake with full kinetic analysis, including arterial sampling, and to assess whether K1 of 18F-fluoride can be used as measure of BBF using 15O-H2O as a reference.
MATERIALS AND METHODS
Study Design
Twenty-two adults (mean age ± SD, 44.8 ± 25.2 y), including 6 healthy volunteers and 16 consecutive patients scheduled for bone surgery, were studied prospectively. Ethical consent for this study was obtained from the Medical Ethics Review Committee of the VU University Medical Center. Patients were asked to participate in this study, and all patients provided written consent after being fully informed about the study purpose and any potential risks. The results of the PET imaging studies were not used for clinical patient assessment or management. The 6 volunteers and 6 patients, diagnosed with a mandibular asymmetry, underwent a single 18F-fluoride/15O-H2O PET scan before surgery. Ten patients were scheduled for a total hip prosthesis implantation. These 10 patients had serial PET measurements before and twice after a total hip prosthesis implantation surgery. In patients undergoing both pre- and postoperative PET scans, differences between pre- and postoperative Ki values were compared with differences in simplified kinetic parameters (e.g., SUV).
PET Data Acquisition
All studies were performed on an EXACT HR+ scanner (Siemens/CTI), which records 63 continuous planes over an axial field of view of 15.7 cm.
First, a 10-min transmission scan was obtained using 3 rotating 68Ge sources. Next, a bolus injection (15 s; 10 mL⋅min−1) of 1,000 MBq of 15O-H2O was administered in an antecubital vein, and simultaneously a dynamic emission scan was started. The scanning sequence consisted of the following frames: 12 × 5, 12 × 10, 6 × 20, and 10 × 30 s (total, 10 min). With an online sampler, arterial blood was withdrawn and monitored continuously during the 15O-H2O scan. After a waiting period of 10 min to allow for decay of 15O activity, a second dynamic emission scan was acquired after injection of 100 MBq of 18F-fluoride. The sequence of this emission scan was 6 × 5, 6 × 10, 3 × 20, 5 × 30, 5 × 60, 8 × 150, and 6 × 300 s (total, 60 min). Again, arterial blood was withdrawn and measured continuously throughout this dynamic scan. All dynamic emission data were corrected for decay, scatter, randoms, and (measured) photon attenuation. Images were reconstructed as 128 × 128 matrices using filtered backprojection with a Hanning filter (cutoff at 0.5 cycles per pixel).
The combined 15O-H2O/18F-fluoride PET study resulted in an estimated dose of 3.2 mSv.
Data Analysis
Regions of interest (ROIs) were drawn in bone directly adjacent to the hip endoprosthesis or in the condylar region of the mandible. The last 10 frames (i.e., 20–60 min after injection) of the 18F-fluoride scans were summed to enhance anatomic orientation and facilitate correct positioning of the ROI. Next, tissue time–activity curves were generated by projecting these ROIs on all individual frames of the dynamic image sequence.
BBF was obtained by fitting 15O-H2O tissue time–activity curves to the standard single-tissue-compartment model (12,13) using the measured arterial time–activity curve as an input function. Similarly, kinetic parameters for the 18F-fluoride scans were obtained by fitting to standard 2-tissue-reversible (4 rate constants) and -irreversible (3 rate constants) compartment models. Selection of the preferred model was based on the Akaike criterion (14).
Apart from full kinetic analysis, 18F-fluoride data were also analyzed using 11 simplified methods. First, Patlak graphical analysis was evaluated for the time intervals 10–30 and 10–60 min after injection. Next, SUV normalized for weight (SUVW) was calculated from summed activity images for the intervals 40–60 and 50–60 min after injection using SUVW = tissue concentration (kBq/mL) × body weight (kg)/injected dose (MBq). In addition to a normalization to body weight, SUV was also normalized to lean body mass (SUVLBM) and body surface area (SUVBSA) (15).
SUV, Patlak, and Ki are expressed as mean ± SD. NLR-derived K1, Patlak-derived Ki, and the various SUV estimates were correlated using simple linear regression. A paired t test was used to compare NLR and Patlak-derived Ki values. The Wilcoxon signed-rank test was used to evaluate differences between BBF obtained from the 15O-H2O scan and K1 derived from the 18F-fluoride scan. The Mann–Whitney test was used to compare SUVs before and after surgery. SPSS 10 (SPSS Inc.) was used for all statistical tests, and a P value of less than 0.05 was considered significant.
RESULTS
NLR and Patlak Graphical Analysis
On the basis of the Akaike criterion, the irreversible 2-tissue-compartment model (3 rate constants) was preferred over the reversible 2-tissue-compartment model (4 rate constants) for 117 of the 128 time–activity curves. Therefore, the irreversible model was used for further analysis of 18F-fluoride kinetics in bone, providing a mean Ki of 0.0160 ± 0.0122. Patlak graphical analysis provided a nearly identical Ki of 0.0161 ± 0.0117 for the interval 10–60 min after injection. The correlation between Patlak and NLR-derived Ki values was highest for the Patlak interval of 10–60 and 20–60 min after injection (r = 0.976; Table 1; Fig. 1A).
18F-Fluoride Quantification Methods

(A) Relationship between Patlak (interval, 10–60 min after injection) and NLR-derived Ki values. Regression line: y = 0.940x + 0.001; r = 0.976. (B) Relationship between SUVw (interval, 50–60 min after injection) and NLR-derived Ki values. Regression line: y = 186.7x + 0.4 ( r = 0.944).
Patlak-derived Ki of 18F-fluoride varied with the time interval used for analysis (Table 1). For example, Patlak-derived Ki for the interval 10–30 min after injection had a significantly higher mean value of 0.0174 ± 0.0128 (P < 0.001). From Table 1, it follows that exclusion of data obtained after 30 min after injection resulted in an overestimation of Ki, whereas an underestimation was found when data before 30 min after injection were excluded.
The subgroup analysis of patients undergoing hip surgery revealed significant correlation between NLR-derived Ki and Patlak-derived Ki for all time intervals, with correlation coefficients higher than 0.94. In the subgroup of patients with mandibular scans, Patlak-derived Ki for the interval 10–30 min after injection had a lower correlation coefficient, with an r of 0.88. For the other time periods, however, correlation coefficients higher than 0.94 were found.
SUV
The correlation between different SUVs and the gold standard, that is, NLR-derived Ki, showed little variation, with r values ranging from 0.94 to 0.96 (Table 1). As an example, Figure 1B shows the relationship between SUVW and NLR-derived Ki for the interval 50–60 min after injection. The highest correlation between SUV and Ki was found for SUVLBM 50–60 min after injection (r = 0.958). Correlation coefficients for SUV based on the interval of 40–60 min after injection did not exceed this value. Hence, there was no evidence to support longer scan times when calculating SUV.
The subgroup analysis of patients undergoing hip surgery and the patients undergoing a mandible PET scan revealed significant correlation between NLR-derived Ki and SUV for all time intervals, with correlation coefficients higher than 0.94.
Changes in Ki, Patlak-Derived Ki, and SUV
In 10 patients undergoing hip prosthesis surgery, 23 serial 18F-fluoride PET measurements were available. In these patients, the periprosthetic SUVW 50–60 min after injection increased from 3.06 ± 3.45 before surgery to 5.59 ± 4.48 (P = 0.07) at 2 wk after surgery. At 12 wk after surgery, SUVW was 4.81 ± 2.88 (P < 0.05 vs. baseline SUVw 50–60 min). The correlation between changes in NLR-derived Ki, Patlak-derived Ki, and different SUVs showed minor variation, with r values ranging from 0.966 to 0.992 (Table 2). As an example, Figure 2 shows the relationship between SUVW 50–60 min after injection and NLR-derived Ki.
Changes in 18F-Fluoride Uptake
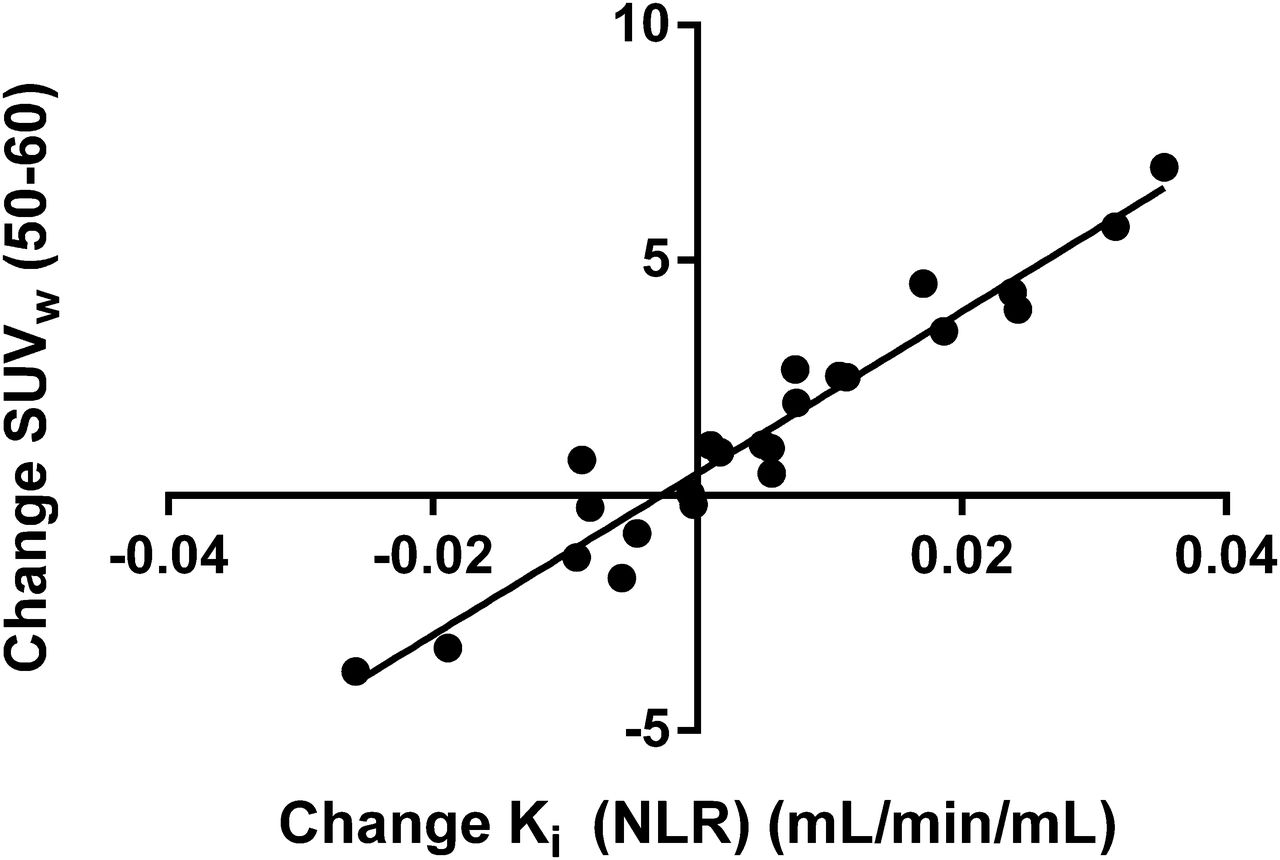
Relationship between changes in SUVW (interval, 50–60 min after injection) and NLR-derived Ki.
18F-Fluoride K1 Versus 15O-H2O PET–Derived BBF
Mean BBF, as measured using 15O-H2O, was 0.090 ± 0.044, which was significantly higher than the mean NLR-derived 18F-fluoride K1 of 0.058 ± 0.050 (P < 0.0001). Nevertheless, K1 correlated significantly with measured BBF, although the correlation coefficient was relatively low (r = 0.35, P < 0.001; Fig. 3). In the patients with unilateral condylar hyperplasia, the correlation between K1 and BBF was not significant (r = 0.27), against a stronger correlation in the group of patients undergoing hip surgery (r = 0.75, P < 0.001). Fifteen serial 15O-H2O PET measurements were available for comparison with serial K1 values, showing a significant correlation between changes in both measurements (r = 0.69, P < 0.01).

Relationship between 18F-fluoride K1 and 15O-H2O–derived BBF. Regression line is described by y = 0.395x + 0.022 (r = 0.35, P < 0.001).
DISCUSSION
18F-fluoride was introduced as a bone imaging agent in 1962 (16). 18F-fluoride PET has been shown to be an accurate method for detection of benign and malignant bone disease (17–19). The quantification of 18F-fluoride uptake may extend the scope of 18F-fluoride PET imaging from detection of bone disease to monitoring responses to therapeutic interventions (20–23).
Previous studies have shown that absolute quantification of 18F-fluoride uptake had a direct relationship with local bone histomorphologic changes (1,24). Simplified scanning protocols, preferably without the need for arterial sampling, would make quantitative 18F-fluoride PET available for routine clinical studies. In the present study, full kinetic analysis with arterial sampling was used to assess performance of simplified methods such as Patlak graphical analysis and SUV. Both Patlak and SUV may be useful tools for characterizing fluoride uptake. Periprosthetic SUVW 50–60 values showed increases from 3.06 to 5.59 and to 4.81, 2 and 12 wk after surgery, respectively. An earlier 18F-fluoride PET study of patients undergoing revision of a total hip arthroplasty with bone allografts found mean periprosthetic SUVW up to 10.2 already 8 d after surgery (3). Altogether, these results are compatible with rapid changes of osteoblastic activity in the early stages of bone healing directly after hip surgery (3).
Various analytic approaches, ranging from semiquantitative indices such as SUV to full kinetic analysis of 18F-fluoride kinetics, have been used to quantify fluoride uptake. Patlak analysis showed the highest correlation with the gold standard—that is, full kinetic analysis. Hence, this method may be the first alternative for clinical studies. Earlier human studies found correlation coefficients between Patlak and NLR-derived Ki values, ranging from r = 0.89 to r = 0.99 (5,24,25).
In the present study, different time intervals for Patlak analysis were investigated, because the optimal time interval for 18F-fluoride is not yet clear (25). Correlation coefficients of 0.95 or higher were found for all time intervals. Using shorter time intervals for Patlak analysis is attractive because it reduces the total dynamic scanning time considerably. However, Ki values obtained with the 10- to 30-min Patlak analysis were significantly higher than those obtained using NLR, resulting in an 8.7% overestimation. In contrast, Patlak analysis using the 30- to 60-min interval resulted in significantly lower Ki values than those obtained using NLR (9.4% underestimation). Ki values obtained with the 10- to 40-min Patlak analysis showed less variation from the NLR-derived values than did the 10- to 30-min Patlak values, and the 10- to 40-min Patlak analysis may serve as an alternative for the 10- to 60-min analysis. The relatively small difference between Patlak and NLR suggests the potential use of shorter scan times for quantification of 18F-fluoride, although further studies with bone interventions are necessary to assess whether these shorter scan times yield consistent and valid results.
A drawback of Patlak analysis in daily practice remains the need for arterial sampling and a dynamic PET scan of up to 60 min. An SUV approach, requiring only a single scan and no arterial sampling, would be better suited for routine clinical use. The correlation between SUV and NLR-derived Ki was high, with correlation coefficients for different SUV approaches being higher than 0.94. No differences in correlations between Ki and SUV were observed when intervals of 40–60 or 50–60 min after injection were used. Hence, because of its shorter scanning time, SUV based on a 50- to 60-min scanning interval would be preferred. More importantly, changes in 18F-fluoride SUV after surgery correlated with those in Ki, indicating that changes of local bone metabolism could be assessed using the simple scanning protocol required for SUV measurements.
There have been only a limited number of reports comparing different methods for quantifying 18F-fluoride kinetics in bone (7,26). Compared with a previous study (7), the present study showed a higher correlation between changes in SUV and Ki (r = 0.79 vs. 0.94). There are, however, several methodologic differences between both studies, including differences in SUV intervals (30–60 vs. 50–60 min). More importantly, Brenner et al. used venous samples to define the input function, whereas arterial samples were used in the present study (7). Venous activity may not reflect arterial activity during the first 20–30 min after the 18F-fluoride injection (8), possibly resulting in biased and more variable Ki estimates. In another study, the impact of 6 mo of treatment with a recombinant parathyroid hormone fragment (teriparatide) on bone 18F-fluoride kinetics was evaluated using both Ki (NLR) and SUV analysis (26). Authors reported that SUV analysis of the spine was less suitable for examining the response to teriparatide (26). In this study, population-based arterial 18F-fluoride input curves were used to obtain Ki. These input curves were based on the population average arterial input curve of 10 postmenopausal women and individually scaled using both venous samples and an ROI over the aorta. Clearly, use of a population arterial input function is less accurate than use of individual arterial input functions, potentially leading to more variability in Ki values obtained. This variance may have contributed to the discrepancy between SUV and Ki in the lumbar spine. An independent gold standard using bone histomorphology was lacking in the above-mentioned studies.
A secondary objective of the present study was to assess whether BBF could be obtained from an 18F-fluoride study. In normal bone, bone metabolism is correlated with BBF (27,28). In patients with bone diseases, BBF has been studied using 15O-H2O PET (3,4,29), and reduced BBF may be associated with a reduced bone mineral density (30). Deriving BBF from a quantitative 18F-fluoride scan would be attractive, because it would obviate the need of a separate 15O-H2O scan (9). However, results of the present study indicate that the relationship between 18F-fluoride K1 and BBF, as measured using 15O-H2O, suffers from substantial scatter, as shown by a correlation coefficient of only 0.35. In a previous study on porcine vertebral BBF, a correlation coefficient of 0.79 was obtained between 18F-fluoride K1 and BBF (9). Clearly, interspecies differences may be responsible for these different results. In addition, variable extraction of 18F-fluoride may contribute to scatter in K1 values. Theoretically, the first-pass extraction fraction of 18F-fluoride should be high, and a nonlinear relationship between K1 and BBF would be expected only for higher BBF values. The present results, however, suggest that other factors are involved, because the variation in K1 values was found over the entire range of BBF values. Differences in biologic characteristics of bone might be a factor, because a higher correlation between K1 and BBF was found in the hip region than in the mandibular region. Regardless of the underlying causes, the use of 18F-fluoride K1 as an index of BBF has its limitations. However, changes in BBF showed a higher correlation between 18F-fluoride K1 and 15O-H2O BBF, indicating that for intraindividual monitoring of BBF, 18F-fluoride K1 might be useful.
There are some limitations that should be acknowledged. First, more data are needed to confirm the use of SUV instead of NLR-derived Ki, because the present correlation between SUV and Ki changes was obtained in a relatively small group of patients. Furthermore, the observed correlation between SUV and NLR-derived Ki was obtained for a fixed scanning interval after 18F-fluoride injection. Strict standardization of the scanning protocol seems necessary, because absolute SUVs depend on the actual interval (including starting time) used. This study merely focused on the bone metabolic changes induced by local surgery and did not take into account potentially more systemic effects on fluoride kinetics of, for example, medical bone interventions.
Hence, separate studies with dynamic scanning and arterial sampling are necessary to validate the use of 18F-fluoride SUV for monitoring bone disease after systemic therapy (e.g., chemotherapy). Ideally, those studies should include an independent gold standard of bone metabolism, such as a bone biopsy with double tetracycline labeling. Notwithstanding these limitations, the current results provide novel evidence regarding the accuracy of SUV and Patlak graphical analysis for quantification of 18F-fluoride uptake in patients. These results could act as an incentive to further explore the role of simplified quantitative methods for 18F-fluoride uptake in patients.
CONCLUSION
The present study provides evidence that both Patlak and SUV analyses can be used to quantify fluoride kinetics in humans. The optimal scan interval for SUV is 50–60 min after 18F-fluoride administration. Results do not support the use of 18F-fluoride K1 as a reliable estimate of BBF.
DISCLOSURE
The costs of publication of this article were defrayed in part by the payment of page charges. Therefore, and solely to indicate this fact, this article is hereby marked “advertisement” in accordance with 18 USC section 1734. No potential conflict of interest relevant to this article was reported.
Footnotes
Published online May 27, 2014.
- © 2014 by the Society of Nuclear Medicine and Molecular Imaging, Inc.
REFERENCES
- Received for publication November 20, 2013.
- Accepted for publication March 24, 2014.


