


Abstract
High-resolution 18F-fluoride ion PET in combination with quantitative CT (QCT) allows the assessment of bone metabolism in relation to bone mass. This combined imaging approach was used to elucidate porcine bone metabolic changes after gastrectomy, which are frequently associated with osteopenia or osteomalacia. Methods: Six months after total gastrectomy (n = 7) or sham operation (n = 6), bone blood flow and bone metabolic activity (Ki, Kflux) were calculated from dynamic PET measurements from vertebral bodies and compared with corresponding QCT bone mineral density (BMD) measurements. Results: Total gastrectomy resulted in a significant reduction of the BMD (−21%; P < 0.005), whereas 1,25-(OH)2-vitamin D, serum phosphate, and parathyroid hormone were significantly increased compared with that of sham-operated animals. Because of the significant increase of the rate constant k3 (+325%; P < 0.05), describing chemisorption and incorporation of 18F-fluoride onto or into the bone matrix, Ki (+36%) and Kflux (+37%) were significantly elevated after total gastrectomy compared with that of control animals (P < 0.01), whereas bone blood flow was not significantly different between groups. The normalization of Ki and Kflux values by the specific bone mass (Ki/BMD; Kflux/BMD) largely increased the differences between groups (Ki/BMD, +74%; Kflux, +76%; P < 0.001). Conclusion: Dynamic 18F-fluoride ion PET revealed that porcine bone loss after total gastrectomy is related to a high-turnover bone disease without significant changes in bone blood flow. In mini pigs, the increased bone metabolism is probably related to an elevated parathyroid hormone secretion, thus maintaining serum calcium homeostasis at the expense of the bone mineral content. Normalizing bone metabolic activity by the specific bone mass increases the sensitivity in the detection of osteopenic high-turnover bone diseases. Therefore, the combination of QCT and 18F-fluoride ion PET seems to be the method of choice for the classification of metabolic bone diseases and for monitoring treatment effects quantitatively.
- 18F-fluoride ion PET
- bone metabolic activity
- bone mineral density
- quantitative CT
- postgastrectomy bone disease
- total gastrectomy
In recent years, the term “postgastrectomy bone disease” has been used to described bone disorders including osteomalacia, osteoporosis in excess of normal aging, or a combination of both (1–3). These bone disorders are characterized by a decreased bone mass and are associated with a considerably increased risk of vertebral bone fractures (4–6).
Decreased bone mineral density and an increased fracture risk have been reported for many years after gastric resections because of peptic ulcer disease. Corresponding information after total gastrectomy is, however, contradictory and incomplete (5,7). There is increasing evidence that the bone disease after gastrectomy might be associated with an increased bone metabolism (8,9).
Using dynamic PET, a quantitative assessment of bone metabolic activity is possible using the bone-seeking 18F-fluoride ion. The widely applied 2-tissue-compartment, 4-parameter model of Hawkins et al. (10) and Piert et al. (11) allows the estimation of specific rate constants describing the transport and binding of the 18F-fluoride ion to the bone matrix, thus giving accurate estimates for the net transport of the 18F-fluoride ion into bone, which is closely related to the bone formation rate in healthy mini pigs. 18F-Fluoride ion PET has successfully been used for the assessment bone graft viability and various metabolic bone diseases (12–16). Previously, we were able to show that the extraction of the 18F-fluoride ion into bone tissue is a function of bone blood flow, thus necessitating a permeability-surface area product (PS product) correction to allow accurate estimates of bone blood flow based on 18F-fluoride ion PET measurements (17).
We have previously established a mini pig model of postgastrectomy bone disease showing a decrease in vertebral bone mineral density within 6 mo after total gastrectomy (2). This well-established animal model provides a sufficient size of vertebral bodies for dynamic PET measurements. To determine bone blood flow and metabolism in relation to the bone mineral density (BMD), we also performed quantitative CT (QCT) of lumbar vertebral bodies. This combined imaging approach allowed the normalization of quantitative PET measurements by the specific bone mass, adding new insights in the understanding of the pathophysiology of postgastrectomy bone disease.
MATERIALS AND METHODS
Animals
Thirteen adult female mini pigs (Versuchstiergut Relliehausen; University of Göttingen, Göttingen, Germany) were used to investigate bone metabolism. Before surgery, pigs were acclimated to their new environment and fed a standard diet containing a defined amount of minerals (Altromin, Lage, Germany) and vitamin D. This diet contained 10.5 MJ/kg, 13.5% protein, 600 IU/kg vitamin D, 0.6% calcium, and 0.5% phosphor. The animals were housed together in surroundings with constant temperature (18°C–22°C) and illumination. Water and food was freely available for all animals. Animals were randomized to total gastrectomy or sham operation. All gastrectomized animals received 1,000 μg vitamin B12 intramuscularly every 3 mo, beginning 1 mo after the operation, to avoid vitamin B12 deficiency. The experimental protocol was reviewed and approved by the Animal Research Committee of the Administration District of Tübingen. The institutional guidelines for the care and use of laboratory animals were followed throughout the study.
Surgery
The animals were premedicated with azaperon (120 mg intramuscularly), flunitrazepam (2 mg intramuscularly), ketamine (200 mg intramuscularly), and atropine sulfate (1 mg intramuscularly). After tracheal intubation, general anesthesia was maintained as described (2). In all animals, a polyurethane catheter was implanted into the cephalic vein or external jugular vein as a central line to allow substitutions of fluids, electrolytes, and calories for 5 d (Aminomix 1, 500 mL/d [Fresenius, Bad Homburg, Germany]; and Sterofundin HEG-5, 500 mL/d [Braun, Melsungen, Germany]) and subsequent blood testing. The catheter was tunneled subcutaneously and brought out at the animals back between the shoulder blades to avoid dislocation and infection. After total gastrectomy, a Roux-Y reconstruction was performed. In the control group, the abdomen was opened without further manipulations to the intestinal tract (sham operation). All animals received cefuroxim (15 mg/kg of body weight; Hoechst, Frankfurt, Germany) perioperatively.
Laboratory Tests
Serum calcium, phosphate, hemoglobin, albumin, and total protein were measured with standard methods as described (6). The serum calcium was corrected for albumin and total protein as described (18). The fluoride serum level (unlabeled) was measured before tracer injection with an ion-sensitive electrode method. Parathyroid hormone (PTH) was measured by a 2-site chemiluminometric sandwich immunoassay, which recognizes intact PTH (Magic Lite Intact PTH Immunoassay; Ciba Corning, Fernwald, Germany). The vitamin D metabolites, 25-(OH)-vitamin D and 1,25-(OH)2-vitamin D, were measured by radioimmunoassay and by radioreceptor assay, respectively (Nichols Institute Diagnostics, San Juan Capistrano, CA). Bone-specific alkaline phosphatase was determined by an enzyme immunoassay (Alkphase-B; DPC Biermann, Bad Nauheim, Germany).
QCT
Six months postoperatively and 1 d before or after PET scanning, quantitative BMD measurements were performed according to the manufacturer’s guidelines (Somatom Plus; Siemens, Erlangen, Germany) by a dual-energy CT scanner with rapid kilovolt switching (85 and 125 kV), minimizing errors due to varying fat content of bone marrow. BMD was calculated with the help of dedicated software (Dialog program EVA, version D; Siemens, Erlangen, Germany), using an algorithm exclusively registering signals between 200 and −2,000 Hounsfield units. For each CT scan, the density of a calcium hydroxyapatite (CaHA) phantom was measured as a reference. Animals were anesthetized for approximately 15 min with flunitrazepam (2 mg intramuscularly) and ketamine (200 mg intramuscularly) and brought into a supine position.
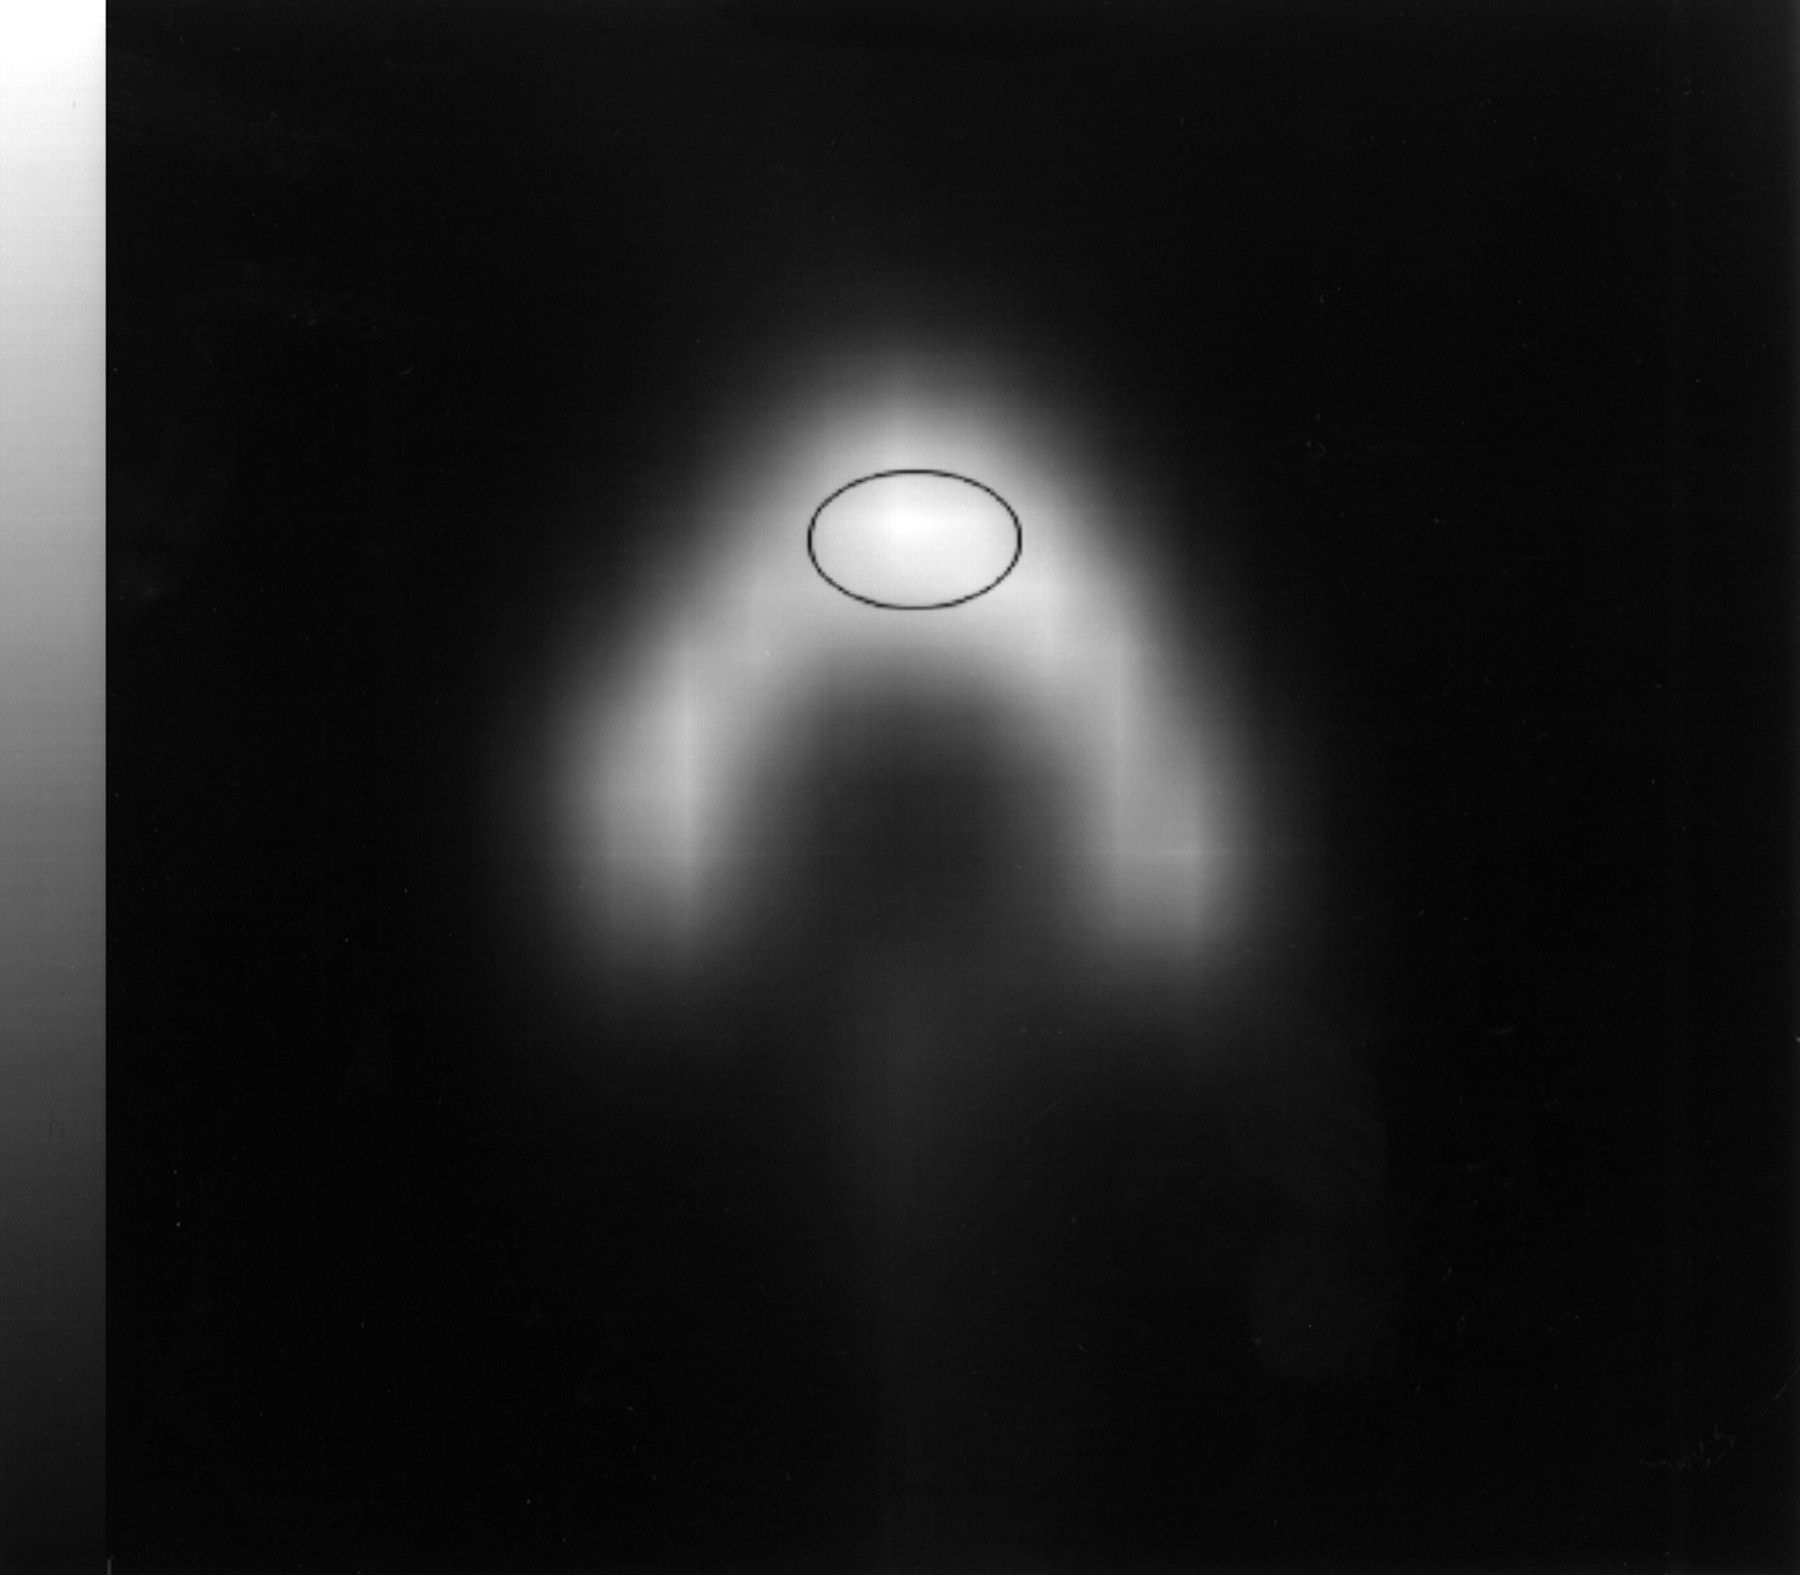
To facilitate intermodality comparisons with PET measurements, midvertebral slices of the first and second lumbar vertebra of each animal were chosen. To allow a normalization of PET measurements for the specific regional bone mass, the BMD of an oval region of interest (ROI), placed in the center of the vertebra and having the same size as the ROI used for PET measurements (1.1 cm2), was determined (rBMD) (Fig. 1).

QCT image of porcine lumbar vertebra with oval ROI in center of vertebral body. According to reference CaHA standard, BMD was determined as 0.304 g/cm3 in this particular ROI.
Radiotracer
18F-Fluoride was produced via the 18O(p,n)18F nuclear reaction in a cyclotron (PETtrace; General Electric, Neu Isenburg, Germany) by irradiating 1.5 mL 18O-water (97% enrichment) with 16.5-MeV protons as described (11). 18F-Fluoride was diluted in 10 mL 0.9% NaCl for intravenous injection and was passed through a 0.22-μm filter for sterilization. The radiochemical purity of 18F-fluoride was always >99%.
PET Data Acquisition
Image data acquisition was performed on an Advance PET scanner (General Electric Medical Systems, Milwaukee, WI) under general anesthesia as recently described in detail (11). Briefly, approximately 10 MBq 18F-fluoride per kg of body weight were injected into the cephalic vein, and the dynamic image acquisition was started for 2 h. For fluid substitution, 500 mL 0.9% NaCl were given. The clearance of 18F-fluoride from arterial blood was measured continuously using a calibrated NaI detector system (Blood sampler FRQ; General Electric, Neu Isenburg, Germany), withdrawing blood from the descending aorta. Arterial blood was drawn continuously from the aorta using a calibrated infusion pump system (Gemini PC-1; IMED Corp., San Diego, CA) at a flow rate of 15 mL/min for the first 3 min of both scans. In previous experiments, this high-flow rate had been found to produce undispersed input functions (17). Whole-blood radioactivity was measured continuously with a calibrated NaI detector system (Blood sampler FRQ). After 3 min, blood samples were drawn discontinuously into heparinized syringes according to the scanning protocol. Plasma was separated from blood samples containing 18F-fluoride, and the radioactivity was counted in a calibrated NaI scintillation counter to obtain the distribution of 18F-fluoride ion in plasma and whole blood. Radioactivity measured in tissue, whole blood, and plasma was corrected for decay. The radioactivity in plasma was always higher than that in whole blood with little intraindividual variation over time (mean, 17% ± 1%). Therefore, the plasma activity was used for further calculations interpolating the whole-blood activity measured by the blood sampler during the first 3 min of the scan to the mean plasma/whole-blood relation between 180 and 7,200 s. For a detailed description of the 18F-fluoride ion PET methodology in humans and animals, the reader is referred to the literature (10–15,17).
Mathematic Models
For 18F-fluoride ion PET studies, the kinetic parameters, representing blood flow and specific aspects of bone metabolism, were estimated from the tissue and arterial plasma activity curves by a standard nonlinear least-squares analysis using the Matlab version 4.2 computing environment (The MathWorks Inc., Natick, MA) and a Sun Sparc Ultra 10 workstation (Sun Microsystems, Munich, Germany). For tracer kinetics, the standard 2-tissue-compartment tracer kinetic model configuration including a vascular compartment was used (10). Accordingly, the net uptake of fluoride in bone tissue (Ki, representing bone metabolism) was calculated as:
 Eq. 1 The net transport of fluoride from the plasma to bone tissue (Kflux) was calculated:
 Eq. 2 where 19F− is the concentration of unlabeled fluoride in plasma (10,11). Previously, we determined the amount of the 18F-fluoride ion extraction from blood into bone tissue under various flow conditions. Because the extraction of H215O approaches 100% in a single capillary passage, we were able to show the flow dependency of the 18F-fluoride ion extraction using dual-tracer studies with H215O and 18F-fluoride ion PET (17). The observed relationship between the bone blood flow determined with H215O and K1 in normal mini pigs followed the Renkin-Crone equation (19,20):
 Eq. 3 where E is the so-called unidirectional extraction fraction of the tracer, PS is the PS product of the capillary surface, and f is the arterial flow to the tissue. To estimate the “true” regional blood flow (f) from K1 values, an extraction correction had to be applied. A lookup table of the flow-dependent extraction fraction was generated according to Equation 3 using the experimentally determined PS product of 0.25 (mL/[min·cm3]) (17).
In Equation 2, the net transport of fluoride to bone, Kflux, is expressed in units of the amount of fluoride per time and the volume of tissue. In this study, the coregistered measurement of the rBMD, expressed in g CaHA/cm3 of bone tissue, allowed the normalization of PET measurements by the amount of CaHA present in the individual ROIs of several vertebrae. Therefore, we were able to calculate bone blood flow per g of bone mass—that is, the regional bone perfusion P, as:
 Eq. 4 In addition, the fluoride influx rate Ki normalized by rBMD—that is, the net uptake of fluoride per g of specific bone tissue (CaHA), called Ki/BMD, was calculated as:
 Eq. 5 The net transport of fluoride per g of specific bone tissue, called Kflux/BMD, was calculated as follows:
 Eq. 6
Eq. 6
According to the underlying 2-tissue compartment model, the rate constants of 18F-fluoride ion transport between the vascular compartment and the 2 bone tissue compartments were determined. After entering the bone tissue, a certain fraction of fluoride either binds to bone tissue on the surface or undergoes ionic exchange with hydroxyl groups of hydroxyapatite Ca10(PO4)6 (OH)2 to form fluoroapatite Ca10(PO4)6F2 (incorporated fraction). The rate constants describing these processes are as follows: K1 and k2 for the forward and reverse capillary transport, k3 for binding to the bone matrix, and k4 for the release reaction. The rate constants K1 and k2 describe transport pathways, which are not specific for bone tissue and, therefore, are greatly influenced by the amount of soft tissue (bone marrow) within the ROI. On the other hand, the rate constants k3 and k4 describe bone-specific metabolic pathways. The volume of distribution (DV) of 18F-fluoride ion was approximated as K1/(k2 + k3). The fraction of tracer in the first tissue compartment that undergoes specific binding to the bone matrix (tBF) was estimated as k3/(k2 + k3).
For tracer kinetic modeling, a parameter for fractional blood volume (BV) was added to account for nonextracted tracer in the tissue’s vascular space. To avoid possible identification problems of specific micro parameters, the number of fitted parameters was limited to 5 (K1–k4, BV). Because of the specific experimental conditions (standardized tracer injection and automated withdrawal of arterial blood via aortal catheter), the delay of tracer arrival could be set to a fixed value of 0.6 s in each experiment, a mean value that was determined previously (11,17). For fitting purposes, a weighting factor (1/var) was used to account for the varying amount of statistical noise in the measured data, where var is the variance of the measured activity per pixel per ROI.
Data Analysis
Image analysis was performed on Apollo 9000 model 735 workstations (Hewlett Packard, Palo Alto, CA). Images were reconstructed by filtered backprojection, using a Hanning filter and corrected for scatter, attenuation, and dead time, resulting in 128 × 128 pixel images for the entire dynamic sequence. Standardized elliptic ROIs (ROI size, 1.1 cm2) were drawn in the midslice of the first and second lumbar vertebra of each animal. Figures 1 and 2 show transaxially reconstructed 18F-fluoride ion PET and QCT images of the midslice of the first lumbar vertebra of a mini pig (no. S6). The images display the localization of the oval ROI in the center of the vertebral body for both modalities.
Transaxial 18F-fluoride ion PET image of lumbar vertebra in Figure 1 obtained after intravenous injection of 10.3 MBq/kg body weight of 18F-fluoride ion (image frame summation between 90 and 120 min). Oval ROI (ROI size, 1.1 cm2) is defined in center of vertebral body (image scale, 0–231 kBq/cm3).
Statistical Analysis
Results are expressed as mean values of parameters with their respective SD. Parameters of both groups (PET, rBMD and laboratory test results) were compared by means of a 1-way ANOVA, including tests for homogeneity of group variances using the Bartlett test, selecting a conservative significance level of P ≥ 0.1. In case of unequal variances, the Wilcoxon or Kruskal-Wallis rank sum test was performed. P < 0.05 was considered significant. Statistical tests were performed with the help of the JMP version 3.2 statistical software package (SAS, Cary, NC).
RESULTS
Serum Parameters
Laboratory results 6 mo postoperatively and cardiocirculatory results during PET scanning are summarized in Table 1. PTH, 1,25(OH)2-vitamin D, and serum phosphate levels were significantly higher in gastrectomized animals compared with sham-operated animals. Serum calcium, calcium corrected by protein (calciumProt) or albumin (calciumAlb), 25-(OH)-vitamin D, albumin, hemoglobin, and the level of the unlabeled fluoride were not significantly different between groups. Blood gas analysis results (Po2, Pco2, SO2), mean arterial blood pressure, and heart rate were stable throughout the PET scanning and not significantly different between gastrectomized and sham-operated animals. Also, mean age and body weight were not significantly different between groups.
Serum and Cardiocirculatory Parameters 6 Months Postoperatively on Day of PET Scanning in Gastrectomized and Sham-Operated Animals
Bone Blood Flow and Metabolism
PET results are summarized in Table 2. The bone metabolic activity, as indicated by Ki and Kflux, was increased by approximately 36%–37% after gastrectomy compared with that of sham-operated animals (P < 0.01). The micro parameter k3, reflecting chemisorption and incorporation of 18F-fluoride into the bone matrix, was significantly increased by approximately 325% in gastrectomized animals compared with control animals (P < 0.05). As a result, the fraction of bound tracer in tissue (tBF) was significantly increased (P < 0.005) and the distribution volume was significantly reduced (P < 0.02) in gastrectomized animals compared with the tBF and DV of control animals. All other micro parameters, including the blood flow estimate (f) and the fractional blood volume (BV), were not significantly different between groups.
PET and QCT Measurements of Gastrectomized and Sham-Operated Animals
BMD
The BMD of a standardized ROI located in the center of the first and second lumbar vertebra were averaged to the regional BMD (rBMD). The rBMD was found to be significantly lower in gastrectomized animals (−21%; P < 0.001) compared with that of sham-operated animals (Table 2). The CT measurements allowed determination of the size of the vertebrae investigated. The mean size of the first and second vertebral body was 1.6 ± 0.2 mm in the sagittal direction and 3.4 ± 0.2 mm in the axial direction for gastrectomized animals and 1.6 ± 0.1 mm in the sagittal direction and 3.5 ± 0.2 mm in the axial direction for sham-operated animals.
Bone Mass-Normalized PET Measurements
To determine the bone metabolic activity per specific mass of bone tissue, the Ki and Kflux measurements were normalized by the rBMD (Table 3). Bone mass-corrected bone metabolism was found to be increased by 74%–76% after total gastrectomy compared with that of sham-operated animals as described by Ki/BMD and Kflux/BMD, respectively. The difference between groups was highly significant for both parameters (P < 0.001).
Bone Mass-Normalized PET Measurements of Gastrectomized and Sham-Operated Animals
DISCUSSION
Changes in bone metabolism combined with a decrease in bone mass, an increased fracture risk, and an increased bone turnover have been recognized after gastrectomy for some time (21–23). Previously, we found a high prevalence of bone disorders in gastrectomized patients. The overall rate of gastrectomy patients having vertebral fractures or osteopenia was 55%. The risk of having a vertebral deformity was increased by >6-fold after total gastrectomy (6). Although the existence of bone disease after gastrectomy is now generally accepted, the underlying metabolic process is still insufficiently understood.
Recently, we have demonstrated that kinetic PET imaging with 18F-fluoride ion permits regional quantification of the net uptake of fluoride in bone tissue (Ki) and the net transport of fluoride from the plasma to bone tissue (Kflux) in vertebrae of healthy mini pigs (11). Correlating these kinetic rate constants with quantitative bone histomorphometry after double tetracycline labeling, we were able to demonstrate that Kflux and Ki are noninvasive estimates for the bone mineral apposition rate. In addition, we showed that bone blood flow and bone metabolism are coupled in normal bone tissue. These findings are further supported by the significant correlation between bone formation and the net uptake of fluoride in vertebrae of adult humans (14). Therefore, the available data clearly indicate that dynamic 18F-fluoride ion PET allows the quantitative noninvasive measurement of bone metabolic activity, which, otherwise, are only available invasively by direct tissue assay techniques. In addition, in a double-tracer PET study with H215O and 18F-fluoride ion we were able to determine the single-pass extraction fraction (E) of 18F-fluoride in normal bone tissue. If E is known for a given K1, the micro parameter K1 can be used to precisely estimate bone blood flow (17). Our study indicates that the bone metabolic activity, as indicated by Ki and Kflux, is increased, whereas BMD is decreased. Therefore, to our knowledge, our study is the first to noninvasively identify a high-turnover bone disease accompanied by a loss of bone mass after total gastrectomy in a large animal model.
Currently, the underlying molecular mechanisms for the observed high-turnover bone disease after total gastrectomy are insufficiently understood. In mini pigs, total gastrectomy is followed by a reduction of the intestinal calcium absorption (2,24). This might be due to the exclusion of the duodenum and the upper jejunum from the food passage by surgical reconstruction (Roux-Y), which are, under physiologic conditions, major sites of calcium absorption. In addition, a rapid food passage after total gastrectomy might further decrease the time for the calcium absorption in the upper intestine. In this study, serum calcium was not significantly different between gastrectomized and sham-operated animals. A decrease of the serum calcium concentration below the normal range is usually not observed after total gastrectomy in humans because immediate counterregulatory mechanisms maintain the calcium homeostasis within tight borders (1,6). Any tendency toward hypocalcemia is counteracted by an increase in PTH release. Accordingly, we found a significantly increased PTH serum level after total gastrectomy in mini pigs as well as in humans (2,6).
PTH stimulates osteoclast activity and 1-α-hydroxylase in the kidney. In turn, the 1,25-(OH)2-vitamin D serum level increases to enhance calcium absorption from the small intestine (6,8,21,25,26). However, 1,25-(OH)2-vitamin D might also increase bone resorption (27). PTH itself increases serum calcium primarily by stimulating the osteoclast activity to mobilize calcium from the skeleton. Therefore, our results are in accordance with the hypothesis that PTH is increased after total gastrectomy because of disturbances in calcium homeostasis, resulting in bone mass loss shortly after total gastrectomy (2,9,26).
Whereas the biologic distribution of fluoride in the body and its eventual incorporation into the hydroxyapatite bone crystals involves several biologic steps, the goal of kinetic modeling is to characterize a metabolic process in a simple and in a kinetically identifiable way. The underlying compartment model is, therefore, a necessary simplification of the true biologic process. As investigated earlier, the 2-tissue-compartment model is the preferred model configuration based on statistical analyses of the variability of parameter estimates (10). The increased bone metabolic activity after total gastrectomy was caused mainly by a significant increase of the micro parameter k3, reflecting chemisorption and incorporation of 18F-fluoride onto or into the bone matrix. Also, the fraction of tracer in the first tissue compartment that undergoes specific binding to the bone matrix (tBF) was significantly increased, while the DV was significantly decreased after gastrectomy compared with that of control animals. Because the other micro parameters (K1, k2, k4) and bone blood flow estimates (f) were not significantly different between groups, this indicates that the fraction of the tracer temporarily or permanently bound onto or into the bone matrix significantly increases, whereas tracer delivery to the bone tissue seems to be unchanged in high-turnover bone disease after gastrectomy. Also, these results indicate that the chemisorption and incorporation of 18F-fluoride onto or into the bone matrix is the rate-limiting metabolic step for fluoride in bone.
Bone remodeling is thought to occur in units and is generally initiated by osteoclastic bone resorption. Whereas osteoclasts are increased in number and activity as a major action of PTH, PTH and the locally produced PTH-related peptide (PTHrP) probably also act on osteoblasts to modulate bone formation (28). By mechanisms that are not yet fully understood and that involve paracrine factors (possibly TGF-β, bone morphogenic proteins, IGF), the osteoblasts stimulate increased osteoclastic activity (29,30). Therefore, increased bone resorption is also associated with increased bone formation, which can be metabolically described as a high-turnover bone disease (31). If the mobilization of calcium from bone is larger than the calcium deposition into the bone matrix, this metabolic state is accompanied by a net loss of bone mass, which is observed first in trabecular bone tissues. In respect to the 2-tissue compartment model and 18F-fluoride ion PET, the magnitude of k3 and k4 reflect the activity of osteoblasts and osteoclasts. Therefore, the observed high-turnover bone disorder should also be reflected by an increase in the magnitude of k3 and k4. Whereas k3 was found to be significantly elevated after total gastrectomy, k4 was not. However, because of the fact that a prolonged data acquisition (>2 h) is necessary to precisely estimate k4, the available precision for the micro parameter k4 is low compared with that of other PET micro parameters. This might have concealed a significant increase in the magnitude of k4, especially because we investigated a small group of animals. Because we have not performed independent measurements of the osteoblast and osteoclast activity (i.e., by using biochemical markers or bone histomorphometry), it remains to be established whether the rate constants k3 and k4 are indeed valid measurements of osteoblast and osteoclast functions.
Partial-volume effects may cause significant bias in the measured tracer concentration within an ROI in dynamic PET studies. Potential errors depend mainly on the size of the ROI compared with the actual size of the object and the spatial resolution of the scanner. For this study, a PET scanner with a spatial resolution of approximately 5-mm full width at half maximum (FWHM) (National Electrical Manufacturers Association performance standard) was used. Although the scanner’s resolution decreases during dynamic data acquisition, the size of the ROI (1.1 cm2) was adequate to ensure accurate tracer concentration measurements within an ROI. The additional CT measurements revealed that the size of vertebral bodies of the adult mini pig exceeded the size of the ROI by more than twice the FWHM in the axial direction and by at least 1 FWHM in any other direction. In addition, selecting the midslice of each vertebra excluded possible spillover effects caused by intervertebral spaces. Therefore, we are confident that the measured tracer concentration in the ROI accurately represents the actual tracer concentration within the object without partial-volume correction.
Using compartment modeling, the precision of the parameter estimation depends on the individual parameter as well as on the interindividual differences within groups. We have previously reported the variability of parameter estimates in individual normal mini pigs (11), being in the same range compared with previous findings in humans (10). As can be seen from our results, the rate constant k3 is an important parameter separating high-turnover bone from normal bone metabolism. Unfortunately, the variability of the rate constants k2–k4 is much higher compared with the macro parameters Ki and Kflux. Therefore, the fraction of tracer in the first tissue compartment that undergoes specific binding to the bone matrix (tBF) is possibly better suited to describe the specific osteoblast activity compared with k3, because the variability of this parameter is lower than that of k3 alone (Table 2). Further studies are needed to verify this assumption.
BMD can be measured accurately by QCT (32,33). Compared with dynamic PET, QCT measurements are less affected by partial-volume effects. When compared with direct tissue assay techniques, the variability of QCT measurements to determine the true BMD is in the range of 3%–6% and, thus, smaller than the errors for parameter estimates based on PET measurements (11). The absolute values of CaHA per gram of bone tissue obtained 6 mo after gastrectomy are in good agreement with previous findings in mini pigs (2). When the specific mass of bone tissue is known, the perfusion of bone tissue (P) and the bone metabolic activity per gram of bone tissue (Ki/BMD, Kflux/BMD) can be calculated on a regional basis. Although size and location of ROIs in the center of midvertebral vertebral bodies were the same for QCT and PET measurements, an absolute coregistration was not achieved because image reconstruction parameters (slice thickness) and the 3-dimensional orientation of the vertebral column were not identical for both measurements. Nevertheless, the potential errors introduced by a possible deviation of the orientation of the vertebral column and the (small) methodologic errors of QCT scans are most likely not introducing a relevant error to the estimates of bone mass-normalized PET measurements.
The distribution of 18F-fluoride in the mineral phase of the bone tissue is inhomogeneous. More specifically, like 99mTc-labeled diphosphonates, 18F-fluoride might localize primarily at the mineralization front—hence, at the surface of the bone matrix (34). In this case, the normalization of PET measurements by the BMD would only be valid if changes in the (trabecular) bone surface are correlated with the (trabecular) BMD. Studies performing BMD and histomorphometric measurements in postgastrectomy high-turnover diseases reveal conflicting results. Mühlbauer et al. (35) found in rodents that the trabecular BMD and the bone area are both decreased after gastrectomy. Using histomorphometry alone, Bisballe et al. (21) were unable to show significant changes of the osteoid surface after gastrectomy in humans, whereas the trabecular bone volume was significantly decreased. Whereas fluoride probably localizes to a certain degree at the surface of newly forming bone (osteoid), it is also absorbed onto the crystal structure of bone by chemisorption (36). Therefore, a correlation of the (trabecular) bone surface and (trabecular) BMD is perhaps not necessarily required to obtain meaningful parameters of the bone-specific metabolism after normalization of 18F-fluoride ion PET measurements by the BMD. Nevertheless, the exact localization and the time course of 18F-fluoride uptake in bone tissue remain to be established.
When the bone metabolic activity is normalized by bone mass (Ki/BMD and Kflux/BMD), the discriminating power of these measurements is enhanced in high-turnover bone diseases, which are associated with loss of bone mass. In this study, bone metabolic activity (Kflux) after gastrectomy was increased by 37% (P < 0.01), whereas the corresponding bone mass-corrected measurement (Kflux/BMD) was increased by 76% (P < 0.001) compared with that of sham-operated control animals. Therefore, the combination of QCT and 18F-fluoride ion PET seems to be the method of choice for the classification of metabolic bone diseases and to monitor treatment effects. If available, researchers in that particular field should consider to use PET-CT scanners, which can increase the precision in the detection of high-turnover bone diseases and allow a true coregistration of both measurements.
There is compelling evidence that bone blood flow and bone metabolism are coupled in normal bone tissue of the mini pig as well as in diseased human bone tissues (11,13,14). However, the significant increase of bone metabolism after total gastrectomy was not accompanied by a similar increase in bone blood flow (f) or bone perfusion (P). Therefore, our results indicate that the relationship between bone blood flow and metabolism might be specifically altered in high-turnover bone diseases. In this study, bone blood flow was estimated by the parameter f, a PS-corrected parameter derived from the rate constant K1 from dynamic 18F-fluoride ion PET. The PS product used to estimate f (0.25 mL/[min·qb]) was previously determined in a dual-tracer PET study (H215O and 18F-fluoride ion) from normal mini pigs in the same age range. The correction is needed to account for the decrease of 18F-fluoride ion extraction with increasing blood flow (17). We have recently completed an animal study in mini pigs determining the PS product for the 18F-fluoride ion in high-turnover bone disease after gastrectomy using direct bone blood flow measurements with H215O PET (37). The results showed that the PS product was unaltered after gastrectomy, verifying that the PS product correction used in this study was, indeed, correct.
CONCLUSION
This study describes, to our knowledge, the first in vivo experiments showing that the well-known loss of bone mass after total gastrectomy is associated with an increased bone metabolism. Our experiments further suggest that this high-turnover bone disease in mini pigs is based on metabolic changes on the level of osteoblast and osteoclast functions, probably related to an increased PTH secretion. The extent of this high-turnover bone disease is especially evident, when QCT and 18F-fluoride ion PET measurements are used combined to normalize bone metabolism by the specific bone mass. In the clinical setting, the high sensitivity of 18F-fluoride ion PET not only allows an early detection of metabolic bone diseases but also might assist with the appropriate choice of therapy—that is, specific inhibitors of high-turnover states such as estrogens or bisphosphonates. In addition, it may also permit a more accurate follow-up of patients suffering from metabolic bone diseases. Therefore, the quantitative assessment of metabolic bone diseases is an interesting application for future PET-CT scanners.
Acknowledgments
The authors thank the members of the PET facility and the Radiological Department of the Technical University of Munich for their excellent and extensive support. The authors also thank Prof. Dr. Markus Schwaiger and Dr. Thomas Link for their assistance and help in supplying the necessary equipment for image analyses. This investigation was supported by Deutsche Forschungsgemeinschaft grants ZI 415/2-1 and PI 242/2-1. This research was presented in part at the 48th Annual Meeting of the Society of Nuclear Medicine, Toronto, Ontario, Canada, June 23–27, 2001.
Footnotes
Received Mar. 25, 2002; revision accepted Aug. 8, 2002.
For correspondence contact: Morand Piert, MD, Nuklearmedizinische Klinik, Klinikum rechts der Isar, Technische Universität München, Ismaninger Strasse 22, 81675 München, Germany.
E-mail: m.piert{at}lrz.tu-muenchen.de
REFERENCES
In this issue


Jump to section
Related Articles
Cited By...
- Dynamic Bone Imaging with 99mTc-Labeled Diphosphonates and 18F-NaF: Mechanisms and Applications
- Quantitative Radionuclide Studies of Bone
- Long-Term Precision of 18F-Fluoride PET Skeletal Kinetic Studies in the Assessment of Bone Metabolism
- Unusual Case of Osteopenia Associated With Nutritional Calcium and Vitamin D Deficiency in an Adult Dog