


Abstract
This study was intended to verify the capability of the Monte Carlo MCNP-4B code to evaluate spatial dose distribution based on information gathered from CT or SPECT. Methods: A new three-dimensional (3D) dose calculation approach for internal emitter use in radioimmunotherapy (RIT) was developed using the Monte Carlo MCNP-4B code as the photon and electron transport engine. It was shown that the MCNP-4B computer code can be used with voxel-based anatomic and physiologic data to provide 3D dose distributions. Results: This study showed that the MCNP-4B code can be used to develop a treatment planning system that will provide such information in a time manner, if dose reporting is suitably optimized. If each organ is divided into small regions where the average energy deposition is calculated with a typical volume of 0.4 cm3, regional dose distributions can be provided with reasonable central processing unit times (on the order of 12–24 h on a 200-MHz personal computer or modest workstation). Further efforts to provide semiautomated region identification (segmentation) and improvement of marrow dose calculations are needed to supply a complete system for RIT. It is envisioned that all such efforts will continue to develop and that internal dose calculations may soon be brought to a similar level of accuracy, detail, and robustness as is commonly expected in external dose treatment planning. Conclusion: For this study we developed a code with a user-friendly interface that works on several nuclear medicine imaging platforms and provides timely patient-specific dose information to the physician and medical physicist. Future therapy with internal emitters should use a 3D dose calculation approach, which represents a significant advance over dose information provided by the standard geometric phantoms used for more than 20 y (which permit reporting of only average organ doses for certain standardized individuals)
Procedures for calculating patient dose distributions are moving toward imaging processes in which spatial and temporal activity and dose distributions are quantitated (1–6). This trend is important in the development of dose calculations in which a better estimation of absorbed doses in tumors and healthy tissues, as well as a correct understanding of tumor response and toxicity in healthy tissues, can be obtained. Such approaches require a more realistic representation of the human body than the simple geometric approaches used traditionally (7–8). Data gathered from CT or MRI (9–10) can provide the basic information for the construction of more realistic computational models in which the human body is represented by discrete elements of volume called voxels. Resolutions are typically on the order of 1 mm. Similarly, SPECT and PET can provide three-dimensional (3D) representations of activity distributions within patients, also in voxel format, with typical resolutions of approximately 5–10 mm. Fusion of anatomic and physiologic image information has been accomplished in several centers (4–6), providing the ability to develop 3D distributions of dose based on actual patient images. Registration of anatomic (CT/MRI) and physiologic (PET/SPECT) images is needed for transporting particles from different source regions to anatomic target regions.
In radiologic sciences, Monte Carlo techniques have provided much useful information through the simulation of radiation transport. With improved computer technology, more complex Monte Carlo methods may be used in radiation therapy. Use of Monte Carlo codes such as EGS4 (11) and MCNP-4B (12) has increased recently, providing accurate data for improving dosimetric methods for a variety of problems, including the calculation of dose distributions in boron neutron capture therapy (13). The MCNP code was developed at Los Alamos Laboratory (Los Alamos, NM) originally as a neutron and photon transport for reactor analysis in general. This code has been updated and improved continually, and its latest version, MCNP-4B, includes electron transport algorithms based on the best available models (12). This program provides several options for developing spatial and energetic distributions using complex geometric shapes.
In this study, we describe a new approach for calculating absorbed dose distributions for radioimmunotherapy (RIT) patients using CT-based anatomic data. Photon and electron transport simulations were performed by MCNP-4B with SCMS, an auxiliary program that we developed to serve as an interface between the image data and the MCNP-4B code, forming an integrated system for spatial dosimetric analysis. To test its capability, we used the voxel-based phantom produced by Zubal et al. (14), which represents a man of approximately 75 kg; the internal organs and structures are formed by sets of individual voxels and entered datasets describing the internal radionuclide distribution. Further development of this functioning code is envisioned for use in an integrated package for RIT treatment planning. This integrated package will incorporate patient-specific anatomic and physiologic data and use the electron and photon transport algorithms of MCNP-4B to provide spatial descriptions of dose distributions and dose–volume histograms (DVHs) for organs and tumors. For marrow dose, existing models should be adapted in a patient-specific manner, because imaging devices are currently unable to resolve the source distribution in bone.
MATERIALS AND METHODS
Phantom Input Data
The voxel-based phantom of Zubal et al. (14) was developed from images of a human patient somewhat similar to the traditional reference man (15); organ regions were identified and assigned manually, and a computer file describing the phantom could be accessed by the Internet. The patient height was 175.4 cm, and the weight was 77.5 kg. Head, thorax, abdomen, and pelvic scans were conducted. The file consisted of 246 slices, and each slice consisted of an array of 128 × 128 voxels covering the regions from head to midthigh. The first and the last nine slices (238–246) were void (outside of the phantom), so the total number of voxels in the phantom was 3,866,624. Each voxel was 4 × 4 × 4 mm. A total of 33 in table organs or structures were identified in this region. Each organ or structure in this file had an identification number used to define the boundaries between organs and changes in the structure. Table 1 gives further details about the composition of most of the regions and compares some regions with corresponding regions in the Cristy–Eckerman adult phantom (8).
Comparison of Voxel-Based Phantom with Adult Male Phantom
Repeated-Structure Design of MCNP-4B Code
Radiation transport of photons and electrons was simulated using the MCNP-4B code. This code simulates various 3D geometries using 3D volumes called cells; cells are defined from combinations of surfaces whose general forms are predefined in the code, but whose specific forms are specified by the user (e.g., the code has a general formulation for the specification of a plane; the user must give the code the specific parameters of a given plane to be defined in 3D space). The program is capable of simulating photon, electron, and neutron interactions with matter through the user-defined problem geometry and material compositions. Various source energy distributions and spatial configurations are available, as are several tally (scoring) options, including energy deposition and energy flux integrated in time (fluence) normalized by the number of starting particles. In this study, an important feature was an MCNP-4B option called repeated structures. Through this option, in which regular geometric structures can be defined many times with relatively simple input statements, it is possible to simulate the radiation transport in a very complex and heterogeneous geometric structure, possibly including discontinuous regions, such as are found in the human body. Thus, the repeated-structure option provides the ability to simulate very complex and heterogeneous spatial activity distributions for patients in RIT.
Each MCNP cell is built as a combination (intersection or union) of several predefined surfaces. Each cell can contain different material compositions and densities. Once the MCNP cells are defined, they can be used in the repeated-structure geometric design, which is based on the repetition of individual cells. This procedure creates a sequence of cells forming a two-dimensional or 3D discrete array according to the given geometric information of the problem to be solved. Geometric construction is particularly interesting in problems in which objects and boundaries cannot be defined through simple shapes, such as spheres, cylinders, and ellipsoids. Therefore, the procedure is very useful in creating more realistic representations of the internal structures of the human body.
MCNP-4B tally options allow the scoring of energy deposition in individual cells in the repeated-structure geometry. This procedure provides not only average quantities but also spatial distributions in the whole volume, although sometimes at the expense of large quantities of computer central processing unit (CPU) time to obtain statistically valid results. However, with the development of new variance reduction techniques and faster computational systems, this processing can be optimized, providing acceptable solution times.
SCMS Input Interface Program
The input interface program, SCMS, was developed to integrate 3D anatomic data from CT and the activity map from SPECT into the MCNP-4B code to calculate 3D internal dose distributions. The software is written in FORTRAN and consists of eight code modules. Some details of the function of these routines are given in the Appendix.
Output Interface Software
The SCMS program creates two files: the MCNP-4B input deck for the voxel-based phantom geometry and a file containing the source and the masses of each region in the phantom. This information is used with the MCNP-4B energy deposition distribution to determine the dose conversion factors (DCFs) for each region. The DCF calculations are performed by the output interface software, which reads a special MCNP-4B output file created for this purpose and generates another output file to be displayed by image-processing software. Figure 1 is a diagram of the methodology used in this study.
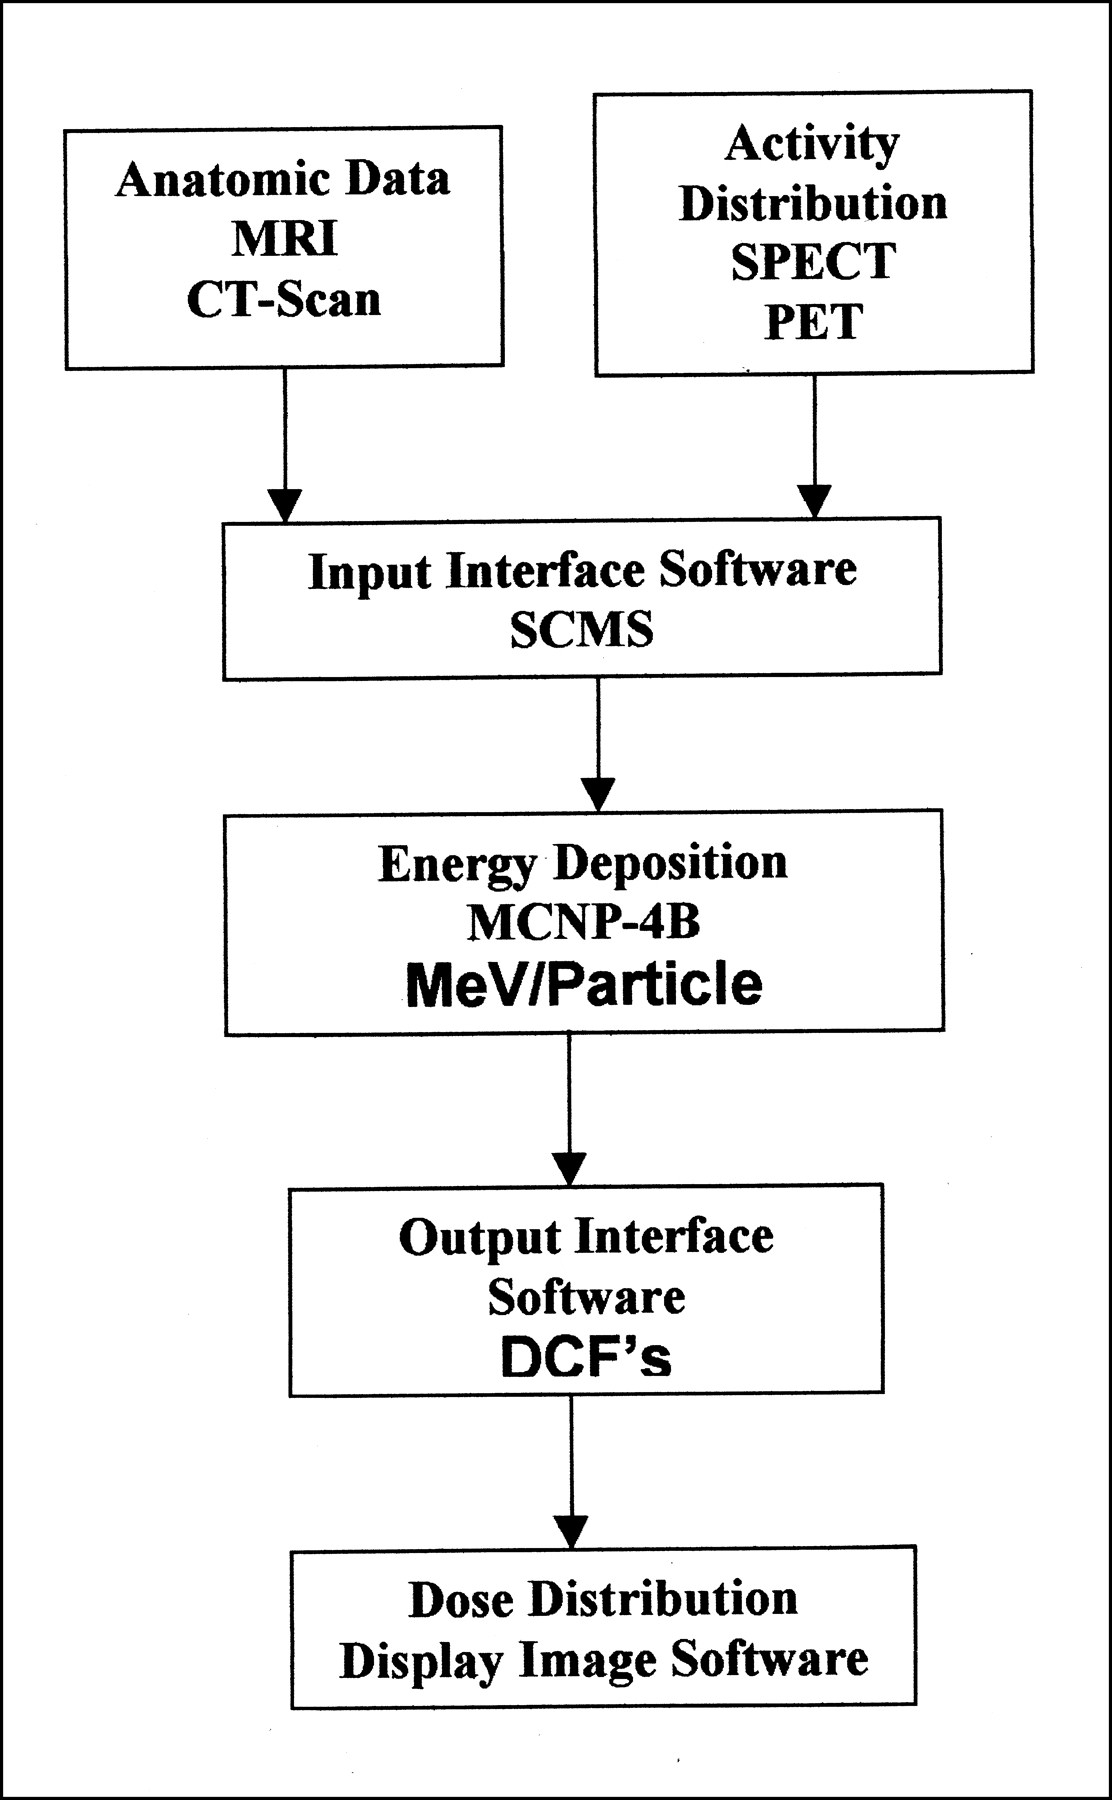
Calculation methodology for absorbed dose distribution.
RESULTS
Voxel-Based Dose Distributions
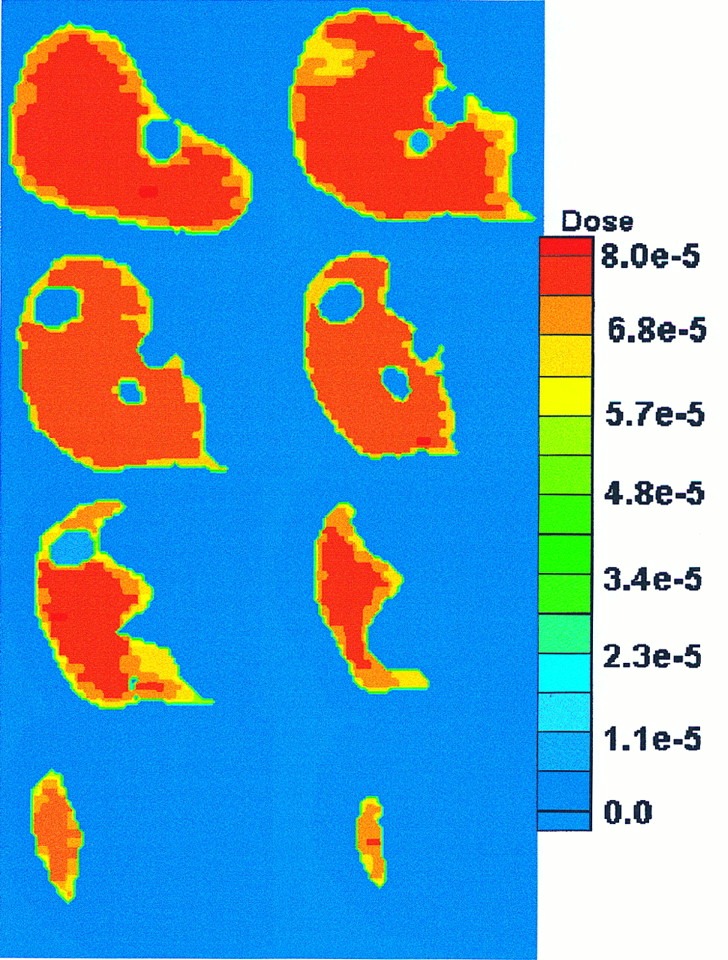
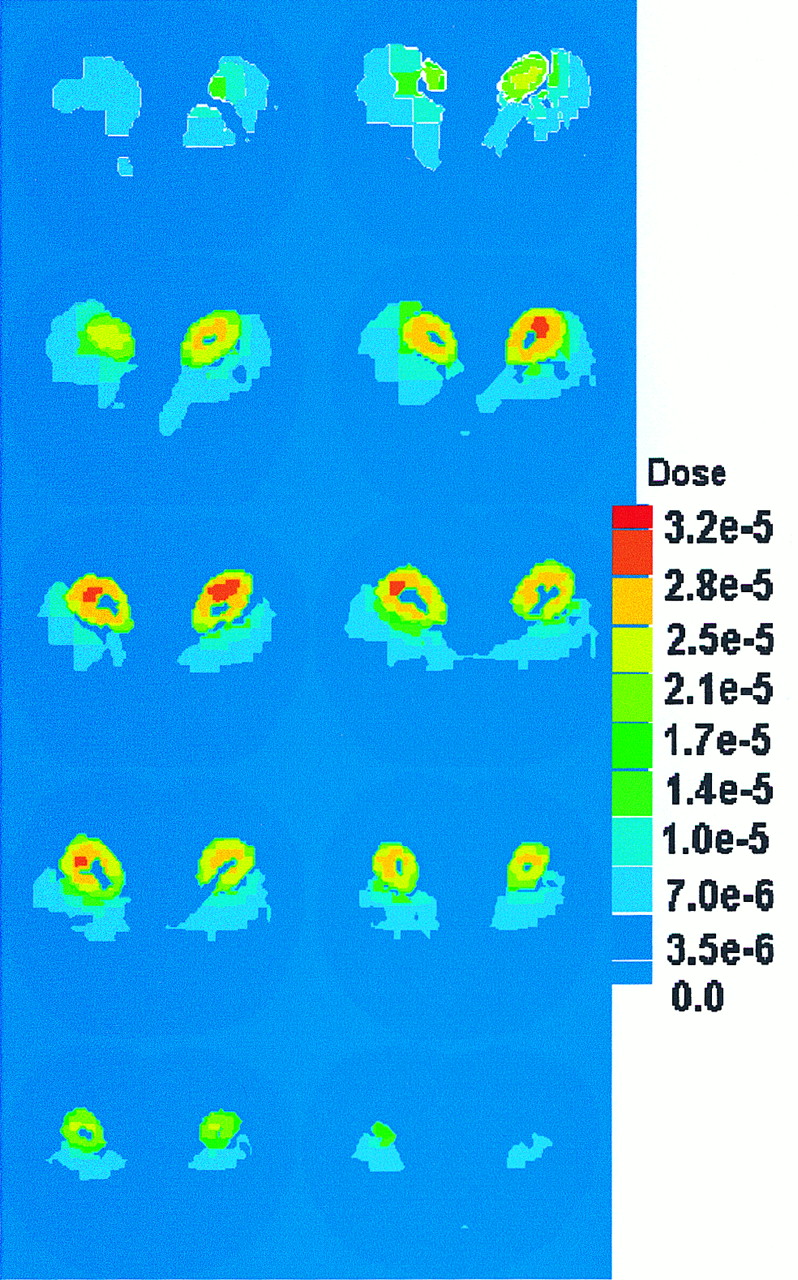
Photon and electron radiation dose distributions were calculated in the Zubal et al. (14) phantom, simulating uniform 1.0-MeV photon sources in the liver and kidneys. Assignment of a source (photons and electrons) to a whole organ is performed by assigning the same source intensity to each voxel in that organ. For a heterogeneous activity distribution, as would be encountered routinely in RIT, different source intensities can be assigned for individual voxels. The liver comprised 29,277 voxels, which we divided into 4,400 regions; thus, each region has an average of 6.6 voxels. Each voxel has a volume of 0.064 cm3; thus, each region has a volume of approximately 0.422 cm3. MCNP-4B estimated the energy deposition in each region of the liver, providing a dose distribution comprising 4,400 values. This result is shown in dose distribution image format (Figs. 2 and 3). The kidneys comprised 7,618 voxels and were divided into 1,296 regions; thus, the dose distribution image was formed by 1,296 regionwise DCF estimates, each of which represented a volume of approximately 0.39 cm3. Figures 4 and 5 show the dose distribution from a monoenergetic 0.935-MeV electron source uniformly distributed in the liver and kidneys, respectively, for the same geometric configuration.
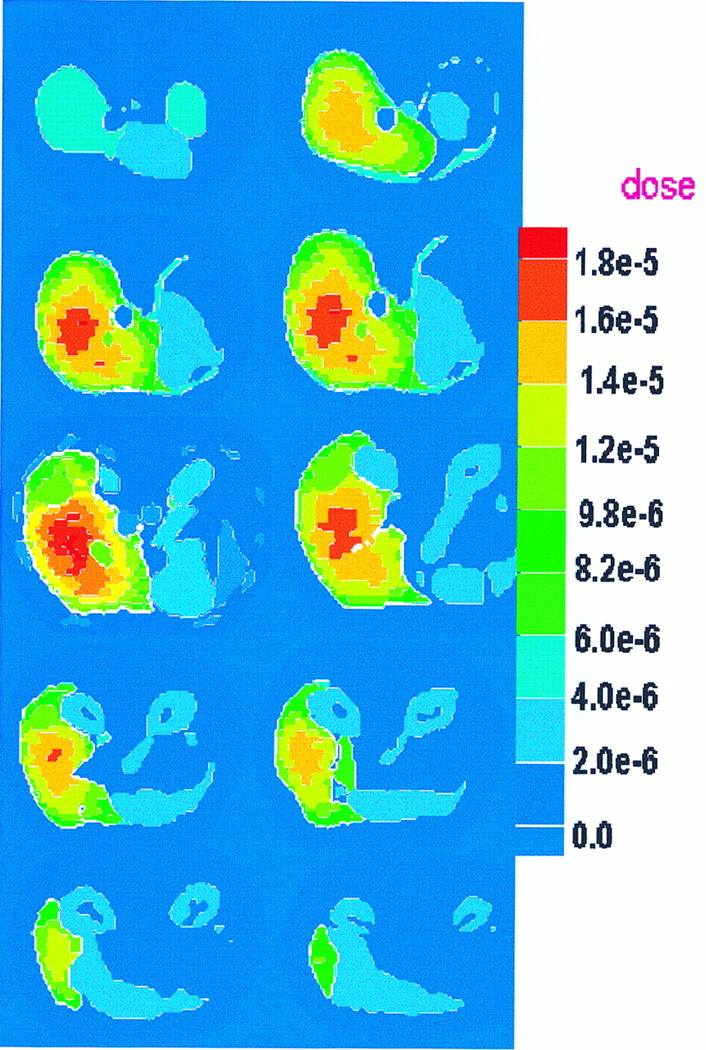
Dose distribution in liver from 1.0-MeV-photon uniform source. Dose units are mGy/MBq × s.

Dose distribution in kidneys from 1.0-MeV-photon uniform source. Dose units are mGy/MBq × s.
Dose distribution in kidneys from 0.935-MeV-electron uniform source. Dose units are mGy/MBq × s.
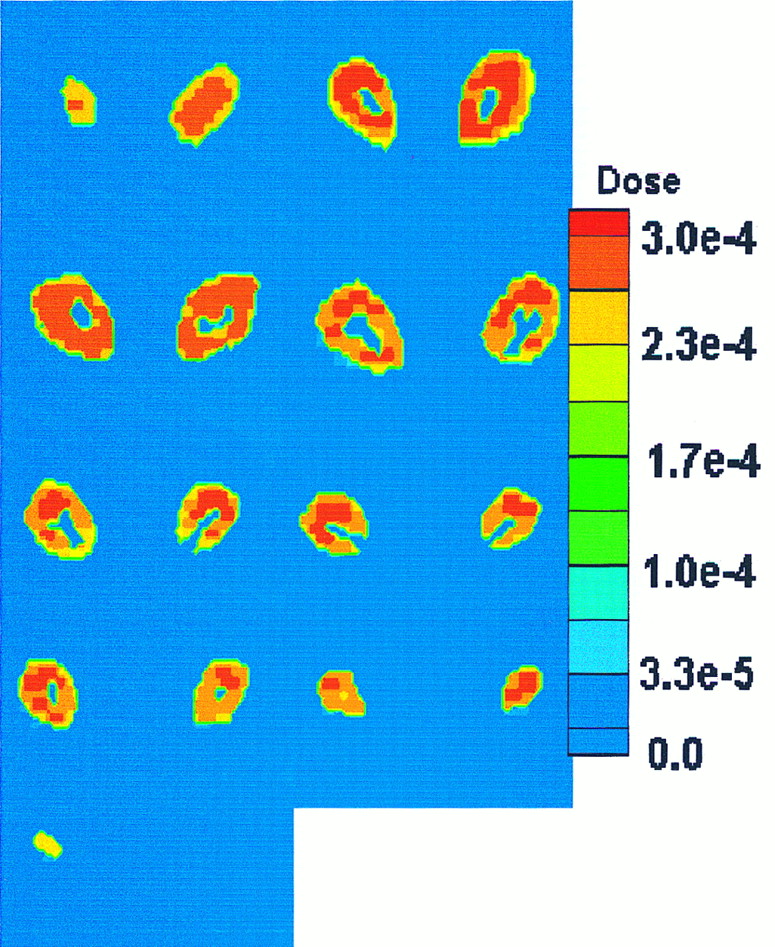
Dose distribution in kidneys from 0.935-MeV-electron uniform source. Dose units are mGy/MBq × s.
Clearly, one would want to take the results given here and calculate actual radiation doses or dose conversion factors. This work was done in a related study (16) and is not reproduced here to maintain a focus on the developmental aspects of this investigation.
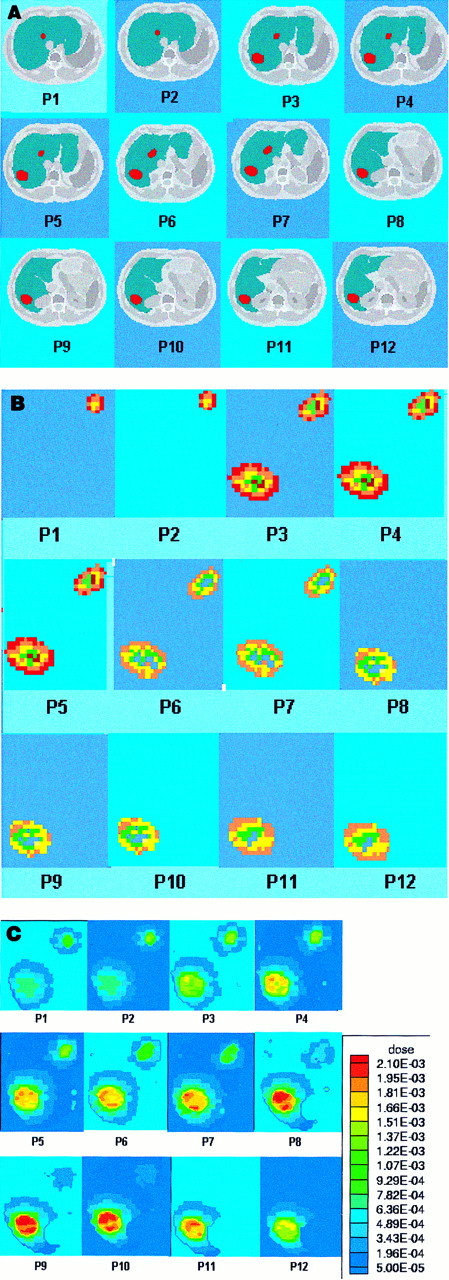
To further explore the capabilities of MCNP-4B in treating patients, a nonuniform source was also simulated. Two lesions were created artificially in the liver of the Zubal et al. (14) phantom; these lesions had a total volume of 58.56 cm3 and comprised 915 voxels. The anatomy of these regions was divided into 12 axial slices, as shown in Figure 6A, which were used to construct the geometric modeling in MCNP-4B. A hypothetic source with a photon energy of 1.0 MeV was assumed to be distributed throughout the whole volume of the lesion, as shown in Figure 6B. Six million photon histories were run for this problem to determine the dose distribution in the lesion region and surrounding tissues. Average SDs in the reported results were on the order of 4%–6%. The calculated dose distributions are shown in Figure 6C for each of the 12 axial planes (slices). As with other existing approaches (4), the output of this code, based on the well-supported MCNP-4B radiation transport algorithms, does permit visualization of nonuniform dose distributions and thus could be useful in treatment planning with internal emitters.

(A) Axial slices show hypothetic lesion anatomy (red) created in liver. (B) Hypothetic nonuniform activity distribution in lesion region. (C) Regional dose distribution in lesion region and surrounding tissues caused by hypothetic nonuniform activity distribution. Dose units are mGy/MBq × s.
Studies of Calculation Efficiency
To be useful clinically in treatment planning, the code must run in a reasonable amount of time. Initially, several cases were run using the head region of the Zubal et al. (14) phantom to evaluate the CPU time using different numbers of tallies (regions in which dose is scored) in the problem. The CT data were used to construct the voxelized head and the internal organs (total of 27 organs) by the interface program, which transformed the data into a suitable MCNP-4B input format. Four cases were run to study the effect of the number of tallies on CPU time. Case A was run with only one tally. Case B was run with 27 tallies, corresponding to the average values for each organ. In case C, 125 voxel tallies were chosen arbitrarily, and in case D, 1,000 voxel tallies were similarly assigned. In each case, 100,000 photon histories were run. Table 2 shows the CPU time needed in each case to perform the calculations on a DEC-ALPHA 3000 workstation (Digital Corp., Woburn, MA).
Comparison of CPU Time with Number of Tallies in Head-Region Trial of Voxel-Based Phantom
The relative errors increased with the number of tallies. (As individual target regions get smaller, the number of interactions per region decreases, given the same number of starting particles, and the relative error, as given by the coefficient of variation, increases.) In case B, to obtain relative errors <10% for the average dose in the organs, it was necessary to simulate about 1 million photon histories, which required a CPU time of about 4.5 h. Thus, we propose that a reasonable compromise between information density and computational efficiency is to sum information from multiple voxels. This process can be done to a lesser degree in areas of high interest (generally, areas of high concentrations of activity) to keep the information density high. (Fortunately, because of the high activity concentrations, good statistics can be obtained in more voxels.) On the other hand, to save computation time, this process can be done to a greater degree in areas with lower activity concentrations (which will be of generally lower interest in the dose analysis), in which coarser dose distributions may be reported. Calculations of dose distributions can be performed in reasonable times, approximately 12–24 h on a personal computer (e.g., Pentium 200 MHz; Intel Corp., Santa Clara, CA) or modest workstation.
DISCUSSION
A new approach to 3D dose calculations was developed using the Monte Carlo MCNP-4B code to calculate dose distributions for photons and electrons in a voxel-based phantom. Other computer codes have been proposed to provide patient-specific dose results. The MABDose computer code (17) and the DOSE3D code (18) adapt the standard geometric phantoms, allowing placement of a tumor or tumors in various locations to estimate dose contributions, but do not currently use patient images. These codes work with the traditional stylized representations of average individuals and give only the average dose to whole organs. The 3D-ID code at Memorial Sloan-Kettering Cancer Center (4), the SIMDOS code from the University of Lund (5), and the RTDS code at the City of Hope Medical Center (6) use patient-specific anatomic and physiologic data in voxel format and provide patient-specific 3D dose information. The code with the most clinical experience to date is the 3D-ID code. The results from our code are similar to those for these other comparable voxel-based codes. However, our results are based on the well-supported Monte Carlo MCNP-4B code, for which robust and well-tested routines for photon and electron transport are available. The usual approach to electron dose in codes developed to date is to assume that electron energy is absorbed wherever the electron is first produced. The development and support of electron transport methods are quite complex, as shown by ongoing intensive efforts by both the MCNP-4B (12) and EGS4 (11) computer code working groups. During a recent conference (19), developments in electron transport were discussed at length. It is not reasonable to expect in-house written codes to deal effectively with electron transport. In areas of highly nonuniform activity distribution, such as an organ with multiple tumors showing enhanced uptake of an antibody, explicit transport of both photons and electrons is needed to characterize dose distributions adequately. The ultimate goal of this effort was to develop a code with a user-friendly interface that could be used in RIT treatment planning. Furthermore, it should work on several imaging platforms and provide timely and accurate patient-specific dose information to the physician and medical physicist.
Tallying each voxel using the Monte Carlo analog process proved to be very expensive in terms of CPU time. However, we propose an approach in which each organ is divided into small regions with a typical volume of 0.4 cm3, thus providing regional dose distributions in a timely manner. Moreover, this methodology would permit the user to obtain detailed dose information (perhaps in individual voxels) in regions of high interest (which usually will have higher levels of activity and can yield dose information at this level of detail with fewer particle histories), or average dose values (or at least less detailed information) in regions of lower interest.
Further optimization of the code is needed to improve these computational times for implementation with real patient data. At present, the code is not user friendly and must be operated in batch mode by a person familiar with programming and knowledgeable about the program structure. The code is also not ready to be implemented on different imaging system platforms using different voxel sizes and data formats. A problem that must be solved before this program can be clinically useful is that of semiautomated image segmentation. The Zubal et al. (14) phantom was segmented by hand in an effort that involved many people and spanned several months (15). If this procedure is to be implemented clinically, much progress must be made in computer-based recognition of organ boundaries and assignment of region identifiers. Several efforts are under way (20), and it is likely that some form of this technology will be available in the near future. Nonetheless, much more study is needed.
Improved estimates of organ and tumor dose distributions permit the evaluation of the dose to normal tissues and tumor, which will guide the administration of appropriate amounts of activity. Bone marrow toxicity is the limiting factor in radiation and drug therapy of cancer. Existing models have been disappointing in their ability to predict marrow toxicity. Imaging devices currently lack the resolution to reliably view the source distribution in bone. Existing regional dose models (21,22) should be used with patient-specific data for marrow time–activity functions and for marrow distribution. Then, the predicted toxicity in marrow and other normal tissues can be balanced against the activity needed to kill the tumor(s).
CONCLUSION
The MCNP-4B computer code can be used with voxel-based anatomic and physiologic data to provide 3D dose distributions. It is clear that future therapy with internal emitters will use such an approach, which represents a significant advance over the dose information provided by the standard geometric phantoms in use for more than 20 y (which provide only average organ doses for certain standardized individuals). Patient-specific anatomic and physiologic data are needed to provide accurate dose information to the physician. The MCNP-4B code can be used to develop such a treatment planning system that will provide timely information if dose reporting is suitably optimized by grouping voxels into small mini-regions and limiting the information density in areas of low activity concentrations. Further efforts to provide semiautomated region identification (segmentation) and improvement of marrow dose calculations are needed to provide a complete system for RIT. It is envisioned that such efforts will continue and that internal dose calculations may soon be brought to the level of accuracy, detail, and robustness commonly expected in external dose treatment planning.
APPENDIX
Details Regarding the Input Interface Program
The MAIN module reads the input data provided by the user, which provide the type of image data to be read and other variables that specify the organs of interest (regions of interest), target and source organs, and average or distribution doses. All other modules are called by the MAIN module.
The PHANTOM module reads the image data, transforming it into a 3D matrix (MVX) and sending it to the RESIZE module, where all external voxel rows and columns outside the body area are subtracted from the MVX matrix, thus reducing computer memory requirements. The entire 3D matrix is then rewritten with the reduced dimensions. The SETUP module has an option to divide each organ volume into small regions, according to the variable information provided by the user in the input data file. Each organ can have a different number of regions or just one region, corresponding to the entire organ. The spatial relation information between i, j, and k coordinates of the elements of the matrix and the spatial localization of the region are stored in the matrix LOCALI. For example, using the CT data from Zubal et al. (14), each voxel belonging to the same organ has the same number, which is the identification number of the organ.
After dividing the organs into regions, each voxel is renumbered according to its localization and assigned a number corresponding to the region to which it belongs. At this point, the number of voxels in each region (NVXORG) and the number of regions in each organ (NREGION) are determined. NVXORG is used later to calculate the mass of each region. A new 3D matrix is created on the basis of the organ regions such that voxels of the same region have the same identification number.
A universe in MCNP can represent a collection of individual cells or an entire lattice. This concept is used in the UNIVMAP module, where the new 3D matrix created in SETUP is rewritten in terms of MCNP universe numbers. The relationship between the MCNP universe number assigned to each voxel and the region of the organ is created and stored in the variable IDORGAN. This variable allows each voxel to be related to the organ to which it belongs in the new 3D matrix. The FILLCARD module writes all the geometric information contained in the 3D matrix in MCNP input format. The MCNP cells are defined using the variable IDORGAN, and three different material compositions are available: lung tissue, soft tissue, and bone. In the TALLIES module, the MCNP tally cards are written using the cell definition created in the FILLCARD module.
The variable NSOURC, read in the input data, defines the number of source organs defined in the problem. The source module uses this variable and the identification number of each source organ to create the MCNP source cards.
Acknowledgments
The authors are grateful to Fundação de Amparo à Pesquisa do Estado de São Paulo (FAPESP) for providing the computational resources to perform part of the calculations and to prepare the manuscript.
Footnotes
Received May 30, 2000; revision accepted Dec. 4, 2000.
For correspondence or reprints contact: Hélio Yoriyaz, PhD, Instituto de Pesquisas Energéticas e Nucleares, Cidade Universitária, Caixa Postal 11049, Pinheiros, São Paulo, 05422-270 Brazil.
REFERENCES
In this issue


Jump to section
Related Articles
Cited By...
- Fine-Resolution Voxel S Values for Constructing Absorbed Dose Distributions at Variable Voxel Size
- Lung Dosimetry for Radioiodine Treatment Planning in the Case of Diffuse Lung Metastases
- Voxel-Based Mouse and Rat Models for Internal Dose Calculations
- Accurate Dosimetry in 131I Radionuclide Therapy Using Patient-Specific, 3-Dimensional Methods for SPECT Reconstruction and Absorbed Dose Calculation
- Dosimetry of Internal Emitters
- A 3-Dimensional Absorbed Dose Calculation Method Based on Quantitative SPECT for Radionuclide Therapy: Evaluation for 131I Using Monte Carlo Simulation