


Abstract
A general method is presented for patient-specific 3-dimensional absorbed dose calculations based on quantitative SPECT activity measurements. Methods: The computational scheme includes a method for registration of the CT image to the SPECT image and position-dependent compensation for attenuation, scatter, and collimator detector response performed as part of an iterative reconstruction method. A method for conversion of the measured activity distribution to a 3-dimensional absorbed dose distribution, based on the EGS4 (electron-gamma shower, version 4) Monte Carlo code, is also included. The accuracy of the activity quantification and the absorbed dose calculation is evaluated on the basis of realistic Monte Carlo-simulated SPECT data, using the SIMIND (simulation of imaging nuclear detectors) program and a voxel-based computer phantom. CT images are obtained from the computer phantom, and realistic patient movements are added relative to the SPECT image. The SPECT-based activity concentration and absorbed dose distributions are compared with the true ones. Results: Correction could be made for object scatter, photon attenuation, and scatter penetration in the collimator. However, inaccuracies were imposed by the limited spatial resolution of the SPECT system, for which the collimator response correction did not fully compensate. Conclusion: The presented method includes compensation for most parameters degrading the quantitative image information. The compensation methods are based on physical models and therefore are generally applicable to other radionuclides. The proposed evaluation methodology may be used as a basis for future intercomparison of different methods.
Radionuclide therapy (RNT) requires accurate determination of absorbed dose so that fundamental dose-response relationships can be established and the efficacy and toxicity of treatments assessed. Accurate calculation of absorbed dose in RNT is challenging because the in vivo activity distribution, that is, the radiation source, initially is unknown in both space and time and is subject to change. In comparison with external-beam therapy, dose planning in RNT is therefore more difficult. For RNT, measurement of the distribution of activity in 3 dimensions is important, to enable a determination of the position-dependent distribution of the absorbed dose. In a recent review article, Zanzonico (1) discussed the importance of the spatial heterogeneity of absorbed dose at a macroscopic level and stated that nonuniformity of tumor absorbed dose might make it difficult to reliably predict therapeutic response in RNT. When the absorbed dose to a volume of interest (VOI) is represented with an average value, absorbed doses to subregions within the VOI, and perhaps having values higher or lower than the average, will be undetermined (2). In most radionuclide therapies (and especially for radioimmunotherapy), the activity concentration is low for tumor tissue. The outcome of a therapy is then limited by the normal tissue toxicity. For maximization of the absorbed dose to malignant tissue, the activity concentration in and absorbed dose to normal tissues must therefore be determined with a high accuracy.
The combination of suitable photons for scintillation camera imaging and medium-ranged β-particles for therapy makes 131I versatile for many RNT treatment protocols. In RNT, SPECT is superior to planar imaging because of an ability to image the activity distribution in 3 dimensions. The accuracy of SPECT quantification is, however, affected by many factors, which include attenuation, scatter, and finite spatial resolution. The latter is a major concern in 131I SPECT because, typically, collimators optimized for higher-energy isotopes have poor spatial resolution. In addition, collimator septal penetration by the high-energy emissions of 131I (364, 637, and 723 keV) has been recognized as one of the principal limitations to accurate SPECT imaging and quantification. Despite the low abundance of the highly penetrating 637- and 723-keV photons, their contribution has been shown to be significant (3). Energy-spectrum-based correction methods, such as the triple-energy-window method, provide a reasonable correction for 131I scatter but do not adequately correct for collimator penetration (3). Tumor and organ activity quantification is affected by the spread, or blurring, of local counts to surrounding areas because of the finite spatial resolution of the system and septal penetration. The spill-out of counts from the target to the background decreases the tumor activity estimate as the source structure gets smaller, whereas the spill-in contribution from the background to the target increases the tumor activity estimate. In a previous Monte Carlo study, we showed the significance of spill-out and spill-in on 131I tumor activity quantification (4). In an attempt to improve the accuracy of 131I quantification in the current study, we include collimator detector response (CDR) compensation in the iterative reconstruction algorithm. The CDR includes both the geometric and the penetration components.
The aim of this article is 3-fold. First, we present a quantification methodology for 131I SPECT that includes a method for registration of CT and SPECT images and position-dependent compensation for attenuation, scatter, CDR, and collimator septal penetration, performed as part of an iterative reconstruction method. Second, a method for calculation of the absorbed dose distribution in 3 dimensions, based on the EGS4 (electron-gamma shower, version 4) Monte Carlo code, is presented. This method accurately accounts for density and atomic number variations in tissue by direct electron- and photon-transport calculations and scoring of the energy depositions from each particle in a voxel-based representation of the patient (5–7). Third, an extensive evaluation outlines a new methodology for quality control of correction methods performed in association with absorbed dose calculations. This evaluation uses images obtained from Monte Carlo simulations and a patientlike computer phantom. An important advantage of using Monte Carlo-generated data is the ability of the data to simulate idealized cases without, for example, scatter and attenuation, enabling detailed investigations of the respective sources of inaccuracy.
MATERIALS AND METHODS
The principle behind the presented quantification methodology is as follows. The patient undergoes sequentially both SPECT and CT acquisitions. A preliminary SPECT image is reconstructed, to which the CT image is registered. The CT image is converted to an image of the mass density through application of a calibration-based relationship (8). The CT image is also converted to a map of the linear attenuation coefficients at 364 keV through multiplication of each density voxel value by values of the mass attenuation coefficients for either water (0.1102 g/cm−2) or bone (0.1116 g/cm−2), each separated at a threshold of density 1.2 g/cm−3. The mass attenuation coefficient for air (≈78% N2 and 18% O2) is approximately 10% lower than the water coefficient at 364 keV, so the water mass attenuation coefficient has been used also in the lung region. The dataset undergoes a full reconstruction, in which the linear attenuation map is used for position-dependent attenuation correction and for scatter or penetration compensation. Counting rate is converted to activity by application of a single calibration factor (cps/MBq) measured in air. The activity image and the mass density image are then read by a program that calculates the absorbed dose in 3 dimensions. For analysis of the absorbed dose in VOIs, segmentation is performed on data from the CT image, the activity image, or the absorbed dose image.
Image Registration
CT and SPECT images are registered through application of both a patient positioning procedure and, subsequently, a registration program. Positioning consists of using a flat and similarly shaped couch for both the CT and the SPECT acquisitions and applying cocalibrated directional lasers for both instruments (9). The registration program uses the mutual information as a similarity measure (10). The CT and SPECT images normally have a differing axial field of view, sometimes truncated in relation to each other. The normalized mutual information is applied for all registrations in this study to avoid alignment of the edges of the field of view, rather than of the internal structures, by the registration algorithm (11). Furthermore, an option has been included to calculate the similarity measure on a restricted part of the image, for cases in which some part, for example, the legs, is of minor interest and therefore is not desired to influence the registration.
The registration procedure starts by rescaling the voxel size of the CT image to that of the SPECT image, according to the pixel sizes and slice thicknesses stated in the image header. An initial prematch is then performed by a rough determination of 3-dimensional (3D) translations. The rough axial translation is estimated by coaligning a manually selected homologous position. In-plane translations are estimated from the maximal cross-correlation, calculated in the frequency domain using a 3D Fourier transformation. A 6-parameter optimization is then performed, in which the optimal values of translations and rotations in 3 orthogonal directions are determined. Trilinear interpolation is applied throughout, and optimization is performed using Powell’s method (12).
The current application involves SPECT images acquired in radioimmunoimaging for diagnosis or therapy. Such images generally have modest quality and present few anatomic details. In the absence of anatomically detailed photopeak images, Compton scatter images are used, which better identify the patient contour and thereby provide useful registration features. The scatter images are acquired simultaneously with the photopeak images in an additional energy window located at 32–132 keV. The width and location of the scatter window are selected with respect to the intensity of large-angle multiple-scattered photons, which are considered likely to represent peripheral parts of the body. The scatter SPECT image is reconstructed, and the CT study is registered to it. Because the photopeak and the scatter SPECT studies are acquired simultaneously, this process brings the photopeak and the CT studies into geometric correspondence.
Image Reconstruction, Attenuation, and Scatter Compensation
SPECT images are reconstructed using an iterative ordered-subsets expectation maximization algorithm, which includes compensation for nonuniform attenuation, scatter, and CDR. Photon attenuation is modeled on the basis of an attenuation map obtained from the CT image.
Scatter compensation is performed by modeling the spatially variant object-dependent scatter response in a projector using the effective source scatter estimation (ESSE) model (13,14). In this model, the 3D activity estimate is resampled into planes in the image grid that are parallel to the collimator face. An effective scatter source is estimated and added to the activity estimate. The attenuated projection of this effective scatter source provides an estimate of the scatter component of the projection data. The estimation of the effective scatter source uses 2 precalculated scatter kernels. These kernels depend on the isotope, energy window, and pixel size but are independent of the object being imaged and thus do not need to be calculated for each patient. In this study, they are calculated using the SIMIND (simulation of imaging nuclear detectors) Monte Carlo code (15). The scatter estimation involves three 3D Fourier transforms and some pixel-by-pixel operations for each projection view and requires much less time than the CDR modeling discussed below. The ESSE scatter model has been extensively validated for 99mTc and 201Tl (14).
CDR Compensation
Modeling the spatially varying septal penetration component of the CDR during the projection step described above compensates for the geometric and septal penetration response. The CDR (including penetration and geometric components) is estimated using a modified version of the MCNP-4B Monte Carlo simulation code. The modeling is performed by generating a table of CDRs as a function of distance from the face of the collimator. The spacing of the CDRs in this table is equal to the image pixel size. Monte Carlo simulations of a point source in air, located at various distances from the collimator, are performed. The response function is averaged in the direction parallel to the surface of the collimator so that the resulting CDR is spatially invariant for a certain source-collimator distance.
It is essential to have low-noise CDRs for compensation. However, computing the CDR to a low noise level requires simulating a large number of photons (∼10 billion). To reduce the computational burden, a very-low-noise CDR is simulated for 1 source distance, in this case 10 cm from the face of the collimator. The CDRs for other distances are then estimated by scaling the size of this CDR. The scaling factors are estimated through simulation of CDRs of 1 billion photons at source-to-collimator distances of 1, 5, 20, 30, 40, and 50 cm. From these, the full width at half maximum (FWHM) of the geometric portion of the response is calculated. In addition, the scale factors for intermediate distances is determined by linear interpolation between the above points. To obtain the CDR at any particular distance, the size-scaling factor is calculated as the ratio of the FWHM of the geometric response at the distance of interest divided by the FWHM of the geometric response at 10 cm.
The CDR for each distance should be normalized so that its sum is equal to the primary-to-total ratio (PTR). The PTR depends on distance in a complex way, especially at distances close to the collimator. In addition, PTR can be estimated with good accuracy using a smaller number of photons than is needed to estimate the FWHM. Thus, 500 million photons at distances of 0, 2, 3, 4, 6, 7, 8, and 9 cm are simulated. From the PTRs and the previous distances, the intermediate PTRs are estimated using bilinear interpolation.
In the projector modeling, the CDR is implemented using a rotation-based approach. For a given projection angle, the 3D activity estimate is resampled using bilinear interpolation so that planes are parallel to the detector. Each plane parallel to the detector is then convolved with the 2-dimensional CDR appropriate for that distance. Because the CDR has large tails resulting from septal penetration, the convolution is performed in the frequency domain to improve efficiency. The Fourier transforms of the CDR for a given distance are stored when they are first computed. This transformed CDR is used for any subsequent convolutions requiring the CDR for that distance.
Activity Calibration
Activity is quantitated by multiplying the attenuation- and scatter-corrected images by the system sensitivity in air (cps/MBq), valid for narrow-beam geometry. The value for the sensitivity has been obtained from both experimental measurements and Monte Carlo simulations. Because of the practical difficulties involved in achieving narrow-beam geometry, sensitivity measurements are performed on planar images for sources of varying area, from which the sensitivity for an infinitesimal area is extrapolated (8). This experimentally obtained value is compared with the sensitivity obtained from simulation of a point source in a scatter- and attenuation-free environment, and without septal penetration. The source-detector distance here is 10 cm, and the sum of the counts in the whole field of view is used.
Absorbed Dose Calculation
The absorbed dose is calculated on an individual patient basis using the activity map from the quantitative SPECT image in combination with the anatomic information from the registered CT scan. The absorbed dose is calculated by a Monte Carlo-based program, named DOSIMG (dose images) (16), which determines the absorbed dose imparted by the activity distribution. The program is based on the EGS4 software and the parameter-reduced electron-step transport algorithm (17). EGS4 requires definition of the physical characteristics of the incident particles and the target regions in which particle transport will be simulated. One parameter concerns the energy cutoff values below which the transport of electrons and photons is terminated. Another determines the maximum percentage of energy loss per transport step caused by continuous slowing of electrons between hard collisions or radiative energy loss events. The position of the decay is sampled from the activity images. The type of the emitted particle and its initial kinetic energy are sampled according to the decay scheme of the radionuclide. To consider the continuous electron energy distribution of an emitted β-particle, the energy spectrum is calculated using the formula by Fermi. The energy of a particular β-particle is then sampled from a probability distribution of this calculated energy spectrum. In EGS4, every geometry region is defined with a different density and composition. Because the number of regions can be large, a random voxel location is determined by first sampling a slice of voxels, then sampling a row of voxels within the slice, and finally sampling a specific voxel within that row. The actual decay point (x,y,z) is sampled uniformly within the selected voxel. The energy deposition in each voxel is scored and normalized by the voxel mass to obtain the absorbed dose in the voxel volume.
Evaluation
The evaluation is based on simulated images of an anthropomorphic phantom. For modeling of the human body, the voxel-based phantom developed by Zubal and Harrell (18) is used, which includes adult male anatomic structures obtained by segmentation of a CT scan. Each of the phantom voxels has a logical value that associates it with an anatomic structure. Using that information, a mass density distribution is generated from tabulated values (19) and is applied to mimic the density map that, in clinical situations, is obtained from the CT study (20). An activity distribution is also created, which in the current study was defined to mimic a 131I radioimmunotherapy activity distribution (21). One hundred twenty-eight images, ranging from slices 70–197 in the phantom, are used. The voxel size of the phantom is set to 0.34 cm in all dimensions, which then corresponds to a patient of 170-cm length.
Table 1 and Figure 1A show the defined distribution of activity and activity concentration for the major organs, the bone structures, and remaining tissues. Only a fraction of the bladder is included in the subset of phantom slices, and the volume of the bladder therefore does not equal a real bladder volume. Activity and density distributions are generated that resemble those of a real patient and that are exactly matched spatially.

(A) Planar projection of defined activity distribution. (B) Monte Carlo simulated projection image of 131I of same activity distribution in air, that is, including only deterioration caused by collimator response and septal penetration. (C) Projection image obtained when including attenuation and scatter, which thus simulates real patient situation. (D) Projection image obtained for 32- to 132-keV scatter energy window, used for image registration procedure.
The Defined Activity and Activity Concentration for Major Organs
Monte Carlo simulation of SPECT images is performed using the SIMIND code (15), which reads the voxel-based computer phantom together with the tabulated information about the activity concentration in each organ. Decays are sampled according to the concentrations and to the relative position of the voxel in the 3D phantom image array. For this study, SPECT projections of 128 × 128 matrixes are generated over 64 projections and 360° rotations. The pixel size is 0.34 cm. The simulated imaging system mimics a DIACAM scintillation camera (Siemens Gammasonics, Inc., Hoffman Estates, IL) including a NaI(Tl) crystal of 9.35-mm thickness and a high-energy hexagonal-hole collimator with flat-to-flat distance of 0.406 cm, septal thickness of 0.2 cm, and hole length of 5.97 cm. The energy resolution in the simulation is set to 10.6% at 140 keV with a square root dependence on energy. An intrinsic spatial resolution of 4.6 mm (FWHM) is used. SIMIND is linked to a special routine that allows for simulation of photon interactions in the collimator septa (22). Simulation of 131I using this routine was validated earlier by experimental measurement (3). A complete 131I photon decay scheme is simulated. Two energy windows are defined—a photopeak window of 20% centered at 364 keV (Fig. 1C) and a second scatter window, defined between 32 and 132 keV, which is used to collect data for the SPECT-CT registration program (Fig. 1D). SPECT projections for the ideal case in which no photon interactions are allowed in the phantom are also simulated (Fig. 1B). These simulations are denoted as “air” in the Results. Generally, SIMIND normalizes the count level in projection data to correspond to an activity of 1 MBq in the whole phantom exposed to the camera in 1 s. For this study, the total activity in the phantom is redefined to 1 GBq. All simulations were performed using the parallel version of the SIMIND code (23) on an SP2 distributed memory computer (International Business Machines Corp., Armonk, NY) using the message passing instructions standard. Thirty-two nodes are used to produce the projection data. No backscatter from compartments behind the crystal is simulated because this effect is not included in the compensation model. Four subsets and 4 iterations are used in the reconstruction. All reconstructed images are corrected for both septal penetration and geometric collimator response. The reconstructed voxels are cubic in shape, with each side equal to 0.34 cm.
To mimic the use of different setup parameters at the SPECT and CT acquisitions, a separate density image is generated from the phantom of Zubal and Harrell (18), with axial extension and voxel dimensions differing from those of the SPECT study. For modeling of patient movements between the scans, the CT image is spatially transformed in relation to the SPECT image by application of randomly chosen rotation and translations. For this study, 3 independent test images, denoted maps 1–3, are used for evaluation of the impact of the registration (Fig. 2). The registered CT images are used as input to the quantification scheme. For comparison, quantification is also performed using the original, perfectly matched CT-SPECT couple, denoted map 0.

Mass density images used to mimic CT-derived mass density map for quantification. Maps 1–3 show transversal, coronal, and sagittal slices for the 3 test cases, before and after registration to SPECT image.
On the basis of the predefined activity and density maps (Table 1 and map 0), an absorbed dose distribution is calculated to serve as the gold standard for the evaluation. This computation applies the dose calculation program to the defined activity distribution and uses organ masses derived from the voxel dimensions and the mass density of each organ. The cutoff energies for the EGS4 program are defined to 200 and 10 keV for electrons and photons, respectively, and 150 million histories are simulated for each image dataset. The electrons are simulated down to the cutoff energy even if their ranges are small compared with the voxel size. To simplify the calculation of the absorbed dose, only 1 specific time point is simulated, for which the absorbed dose in each organ is calculated by assuming an effective half-time equal to the physical decay of 131I, without considering any redistribution of the activity.
A summary of the evaluation procedure is presented in Figure 3, in which the SPECT-based distributions of activity and absorbed dose are compared with the known distributions of activity and the gold standard absorbed dose distributions.

Flow chart describing methodology of quantification procedure and evaluation. Known activity map and gold standard absorbed dose distribution are compared with corresponding maps obtained from quantitative SPECT calculation scheme.
RESULTS
The experimental value of the sensitivity was obtained to 24.3 ± 0.5 cps/MBq, and the simulated value to 24.1 cps/MBq. Because of the good agreement, the simulated value was considered verified and was further used for calculation of the activity.
The bottom row in Table 2 shows the total activity within the phantom, calculated by summing the activity values in all voxels. An accurate value of the total activity is important because the voxel distribution of the absorbed dose from the DOSIMG program is output in units of the total activity in the whole phantom. The total activity was within 10% of the known value for all cases. When comparing the activity value determined from the air simulation and the activity values obtained when the ESSE correction is used in combination with the different attenuation maps (maps 0–3) with the true activity value, the deviations are comparable, indicating that the obtained overestimate was not caused by improper scatter and attenuation correction but was primarily a result of limitations in the CDR correction. Using the 3 registered test images, the total activity fluctuated slightly. This fluctuation was believed to be caused primarily by the oblique section surfaces that result at registration for the top- and bottommost regions of the CT (density) image.
Activity Concentration per Voxel Within VOI
Table 2 also shows the resulting organ average activity concentration (kBq/cm3) and the related SD in the voxel activity values relative to the average value for the different cases. These results were calculated using known VOIs obtained from the definition of the structures in the anthropomorphic voxel phantom. For the major organs, the activity concentration, taking into account the SD, was close to the known activity concentration. However, pancreas was significantly overestimated both for the air case and for maps 0–3. The average activity concentration of the bone marrow for maps 0–3 was close to the known value, but for the air case the value was smaller. Using the 3 registered test images, the activity in all organs was close to that obtained when the perfectly matched attenuation map, map 0, was used. The registration method thus corrected well for the mimicked patient movements.
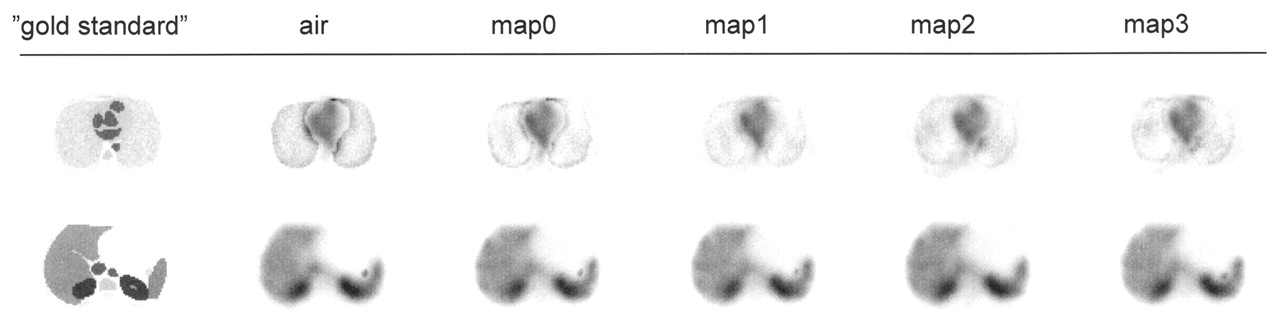
Figure 4 shows 2 transversal 2-dimensional absorbed dose distributions obtained for positions that match the lung/heart and the liver region. The lung positions show that, despite the collimator response correction, the blood compartments of the heart were difficult to distinguish. An increased absorbed dose that was seen at the lung boundary but could not be seen in the gold standard was an effect of the spatial resolution of the SPECT images, which imposed a spread of the counts into the lung region, resulting in larger absorbed dose values because of the low value of mass density. This factor explains the relatively large SD for the dose absorbed by the lungs. The absorbed dose near the boundaries was less sharp for the 3 test cases (maps 1–3) than for the air and map 0 cases because of the interpolation involved in the registration and the resulting smoothing of the density map. For the liver position, the air and maps 0–3 cases look similar. A hot spot that was seen anterior to the right kidney but could barely be seen in the gold standard image was caused by the blurring of counts into a gas pocket present in the bowel, which had a low mass density and therefore produced high absorbed dose values. This pocket can also be seen in a density map in Figure 2. Table 3 shows the average absorbed dose per voxel with the VOI and the related SD.

Transversal section of absorbed dose distribution for slice through lungs (top row) and liver (bottom row) for different cases. Images were all normalized to same gray level.
Absorbed Dose per Voxel Within VOI
The time to generate the SPECT projection data on the SP2 parallel computer was on the order of 1.5 d. Reconstruction and absorbed dose calculations were done on a computer with a 1,400-MHz AMD Athlon processor (Advanced Micro Devices, Inc., Sunnyvale, CA) and a Linux operation system. The computing time for the activity quantification and absorbed dose calculation was approximately 3.5 and 1 h, respectively. The time to register an image was on the order of 0.5 h.
DISCUSSION
The results of this study have shown that it is possible to compensate for the physical limitations in SPECT images by applying iterative reconstruction including correction for scatter, attenuation, collimator response, and septal penetration. The resulting images can therefore be converted to activity images using a single calibration factor, because the sensitivity for parallel-hole collimators is independent of the source location relative to the camera for the case of no septal penetration.
Agreement was good between results obtained for the 3 registered attenuation maps and the known activity or gold standard absorbed dose distribution (Tables 2 and 3). This good agreement shows that the mutual information-based 3D registration method is accurate and compensates well for the mimicked patient movements. In this study, only rigid patient movements were modeled; elastic transformations, such as trunk twisting, were not included. The possibility of determining a more complex spatial transformation is believed to be limited because of the limited resolution of the gamma camera system and the generally poor quality of SPECT images.
Recently, combined CT-SPECT acquisition systems have been developed that yield intrinsically matched CT and SPECT studies (24). For those systems, image registration may prove to be obsolete. However, most contemporary systems still work in single mode and require registration of SPECT and CT images.
The activity and absorbed dose have been evaluated for the known volumes of the phantom of Zubal and Harrell (18). This process corresponds to a derivation of volumes or masses from CT images. Because of the limited spatial resolution of SPECT, the number of counts and hence the measured activity is underestimated, or overestimated, depending on the relative significance of spill-out and spill-in. Even if collimator response correction is applied, an ideal resolution clearly is not recovered, implying that the partial-volume effect limits activity quantification. Two additional simulations were conducted to investigate the magnitude of the partial-volume effect. For the first simulation, activity was defined within the liver only; for the second, activity was assigned to the myocardium only. Quantification and evaluation were then performed and revealed that only 69% and 51% of the known activities were obtained for the liver and the myocardium, respectively. However, a review of Table 2 shows that the activity is overestimated in both the liver and the heart. The region defining the heart in the phantom of Zubal and Harrell is limited to the myocardial muscle, whereas the blood in the left and right ventricles is defined by a different code (i.e., the blood is a different VOI). For the activity distribution used (Table 1), the activity concentration of the blood pool is high in comparison with the myocardium, and the overestimate of activity is caused by spill-in from the blood region. For the liver case, the high activity of the right kidney similarly contributes to the liver activity. To reduce the partial-volume effect, the spatial resolution of the imaging systems needs improvement. For high-count-rate cases, such as in therapy imaging, the spatial resolution can be improved using long-bore collimators. New SPECT systems with thicker crystals will increase the sensitivity for high-energy photon imaging, which may reduce the need for image processing such as low-pass filtering. In addition, improvement in the accuracy of the collimator response correction is possible. A related factor that deserves attention is correction for motion caused by respiration. The phantom used in this study does not include this effect, but breathing generally imposes a blurring effect, especially in the upper thorax.
The absorbed dose calculated in this study does not include temporal activity variations within the organs and redistribution. The absorbed dose has been calculated using physical decay only. An additional error caused by the fitting of the time-activity curve to the voxel values can here be expected. A Monte Carlo study of a full patient procedure including simulations of redistribution over time is, however, beyond the scope of this article.
The results from the absorbed dose program are stored as 3D images with the same voxel size as the input images. Additional software can be used to present the absorbed dose calculations in selected VOIs as dose volume histograms or isocontour images. Dose volume histograms can then be useful to determine, for example, the maximum absorbed dose within a VOI. It must also be remembered that the voxel size in the SPECT images is less than the spatial resolution of the system, and the large values for SD, presented in Tables 2 and 3, can be caused by this difference.
The use of SPECT images as a basis for absorbed dose calculations adds a source of error, because the activity distribution shown is not a true distribution but a distribution blurred by the spatial resolution of the SPECT system. It is therefore possible that the current methodology overestimates the spatial spread of energy from the β-particles. For comparison, the absorbed dose was calculated for a complete absorption of energy from electrons and β-particles and the theoretic decay scheme of 131I. The absorbed dose from electrons and β-particles to the kidneys, lungs, stomach, spleen, liver, heart, and bone marrow was calculated to be 9.7, 2.0, 0.5, 5.8, 4.8, 2.4, and 2.5 Gy, respectively. These values agree with the absorbed dose values from the DOSIMG program (Table 3), implying that most of the electron energy is locally absorbed within the voxels from which they are emitted. For radionuclides that emit β-particles of higher energies than 131I, such as 90Y, the kinetic energy of the particle is not likely to be completely absorbed within a voxel. The absorbed dose calculation possibly will still gain if the electron energy is treated as locally absorbed, to partly compensate for the blurring effect of the scintillation camera on the activity images. However, further investigations are required on this matter. Especially, it is of interest to determine when (i.e., for which radionuclides) an explicit ray tracing of the electron path is required.
RNT using radiopharmaceuticals such as monoclonal antibodies and hormone analogues, which can target specific tumors, is becoming established in cancer treatment. Accurate dosimetry is required both for dose planning and for radiobiologic evaluation. Several procedures for 3D absorbed dose calculations have been suggested on the basis of dose point kernels (25,26), voxel S-factors (27), and Monte Carlo simulations (5–7). The absorbed dose distributions obtained by such procedures may be evaluated and verified using experimental dosimeter measurements or computer modeling. A limitation for experimental measurements is the relatively limited geometries that can be applied. For example, one of the patientlike anthropomorphic phantoms commercially available includes a realistic skeleton embedded in a tissue-equivalent material and compartments corresponding to the lungs, the heart, the liver, and a remaining background. The possibility of mimicking a more detailed patientlike activity distribution, such as the one in this study, is thus limited using such a phantom. Furthermore, the variation in the placement of dosimeters is determined by the physical construction of the phantom, which makes the absorbed dose distribution difficult to resolve in detail. Using an accurate Monte Carlo program in combination with a voxel-based phantom overcomes these limitations and therefore adds flexibility in the evaluation of sources of error in quantification methodology. The presented evaluation methodology thus offers an alternative to experimental measurements for use in quality control and in the evaluation of procedures for calculating absorbed dose in RNT dosimetry. The evaluation methodology also makes possible the investigation of how overall accuracy is affected by the various steps involved in calculating absorbed dose.
CONCLUSION
We have found that use of an ordered-subsets maximization expectation reconstruction program that corrects for physical limitations, in combination with an accurate image registration program and a 3D absorbed dose calculation program, can produce accurate activity and absorbed dose distributions for a complicated decay, such as that of 131I. We have also shown that Monte Carlo evaluation is a powerful tool for evaluation of the different steps in the dosimetry calculation chain.
Acknowledgments
This study was supported by grants from the Swedish Cancer Foundation, the Gunnar Nilsson Foundation, and Berta Kamprad’s Foundation and by grant RO1 CA80927 from the U.S. Public Health Service.
Footnotes
Received Sep. 24, 2001; revision accepted Mar. 25, 2002.
For correspondence or reprints contact: Michael Ljungberg, PhD, Department of Radiation Physics, Jubilee Institute, Lund University, SE-221 85 Lund, Sweden.
E-mail: Michael.ljungberg{at}radfys.lu.se
REFERENCES
In this issue


Jump to section
Related Articles
Cited By...
- Study of the Impact of Tissue Density Heterogeneities on 3-Dimensional Abdominal Dosimetry: Comparison Between Dose Kernel Convolution and Direct Monte Carlo Methods
- An Evidence-Based Review of Quantitative SPECT Imaging and Potential Clinical Applications
- Lung Dosimetry for Radioiodine Treatment Planning in the Case of Diffuse Lung Metastases
- Accurate Dosimetry in 131I Radionuclide Therapy Using Patient-Specific, 3-Dimensional Methods for SPECT Reconstruction and Absorbed Dose Calculation
- Dosimetry of Internal Emitters