


Abstract
The ability to estimate absorbed doses in experimental animals to which radiolabeled material has been administered may be important in explaining and controlling potential radiation toxicity observed during preclinical trials. Most previously reported models for establishing doses to small animals have been stylized and mathematically based. This study establishes dose factors for internal sources in realistic models of a typical mouse and a typical rat, based on image data obtained using a dedicated small-animal CT scanner. Methods: A transgenic mouse (body mass, 27 g) and a Sprague–Dawley rat (body mass, 248 g) were imaged using the dedicated small-animal CT scanner. Identified organs were segmented using computer tools that Vanderbilt University applies to process human images for 3-dimensional dosimetry. Monte Carlo N-particle transport code (MCNP) input files were prepared from the 3-dimensional, voxel-based image data. Using methods established for human studies, radiation transport calculations of absorbed fractions (AFs) were performed using MCNP, version 4C, on the segmented images, and dose conversion factors for several radionuclides were developed. Results: AFs were established at discrete energies for electron and photon sources assumed to be uniformly distributed throughout approximately 10 source and target regions in both models. Electron self-irradiation AFs were significantly less than 1.0 for many organs, at energies above 0.5 MeV, and significant cross irradiation was observed for high-energy electrons, such as those from 90Y or 188Re, in many organs. Calculated dose conversion factors reflected these trends and agreed well with the results of other authors who have undertaken similar investigations. Conclusion: The AFs calculated in this study will be useful in determining the dose to organs for mice and rats similar in size to those studied here. The segmented, voxel-based models developed here can be used for external dose calculations as well.
Rodents are frequently used to assess the radiation dose of investigational radiopharmaceuticals. Biodistribution studies are often performed on rodents to extrapolate potential doses of these agents to humans. Because more therapy applications involving internal emitters are being tested on animal models, calculating accurate dose estimates for the animals themselves has become important in explaining and controlling potential radiation toxicity observed during the trials.
Doses to animal tissues may be estimated using implanted thermoluminescent (1) or MOSFET (metal-oxide semiconductor field-effect transistor) (2) dosimeters. Another approach is to use theoretic models of the animals, with radiation transport simulations providing dose factors for defined source and target organs, in a direct parallel to the methods widely used and established in human models (3,4). Some investigators have developed simple animal models that use geometric shapes to define individual organs, as has been the basis for human models. Hui et al. (5) developed an anatomic model for an athymic mouse and calculated organ self-doses for 90Y. Doses from selected source–target pairs (cross-organ doses) were approximated using methods based on overlapping areas of organ pairs. Yoriyaz and Stabin (6) constructed a geometric mouse model and generated S values (3) for a selected number of source–target pairs for 213Bi and 90Y. Muthuswamy et al. (7) developed a model of marrow to complement the organ model of Hui et al. and provided dose factors for 131I, 186Re, and 90Y. Flynn et al. (8) modeled several organs in a mouse model using ellipsoids and modeled bone and marrow as cylinders, including a kidney model that distinguished cortex from medulla.
With the advent of small-animal imaging technologies, it is possible to move away from the use of stylized, equation-based body models and develop models that more realistically define organ size, shape, and overlap with other organs. This is occurring in a direct parallel to efforts to develop more realistic human models based on 3-dimensional image data (9). Hindorf et al. (10) developed a voxel-based mouse model that used geometric shapes to define 10 organs. Kolbert et al. (11) used MR images of a female athymic mouse to develop realistic models of the kidneys, spleen, and liver and used the 3-dimensional internal dosimetry code (12) to estimate self-dose and cross-dose S values for these organs. In this work, we extended the work of others by using realistic models of 2 animals, a mouse and a rat, in a form that facilitates dose calculations. Ten organs were segmented in each model (including the skeleton), and organ self- and cross-dose absorbed fractions (AFs) were generated using the Monte Carlo N-particle transport code (MCNP) (13). These models thus significantly improve on the previously presented models, which used geometric, instead of realistic, structures to model organ shapes and positions. Compared with the one realistic model presented previously, these models also significantly increase the number of organs available for use. S values based on these results are presented for several important radionuclides.
MATERIALS AND METHODS
A transgenic mouse (body mass, 27 g) and a Sprague–Dawley rat (body mass, 248 g; Harlan) were selected for study. We chose to use CT images (rather than MR images) because the imaging field sizes of the small-animal CT scanner (MicroCAT II scanner; ImTek Inc.) allowed us to image the entire mouse at one time, without repositioning, during a reasonable acquisition time. The soft-tissue contrast was adequate to distinguish the structures we needed to define for this investigation. The x-ray tube of the scanner was set at 80 kVp and 500 μA, and the field of view was 11 × 11 cm. A 600-ms exposure was used for each projection, and 360 projections were acquired over 360°. The voxel dimensions were 0.2 × 0.2 × 0.2 mm for the mouse and 0.3 × 0.3 × 0.5 mm for the rat. Reconstruction was done on a 256 × 256 × 256 grid using a Feldkamp cone-beam algorithm. The animals were kept under anesthesia during imaging (1%–2% isoflurane). Scanning started 12 min after intraperitoneal injection of a CT contrast agent (0.2 and 1.8 mL of ioversol [Optiray 240; Mallinckrodt Inc.] in the mouse and rat, respectively). The presence of the iodinated contrast agent in the peritoneal cavity, as well as its renal clearance pathway, aided the identification of organ boundaries during image segmentation.
Segmentation was performed using the interface description language–based tools that Vanderbilt University applies to process patient images for 3-dimensional dosimetry. In both models, the kidneys, liver, lungs, spleen, heart, stomach, intestines, skeleton, testes, and bladder were identified and segmented. The external contour of the body was also segmented, so that radiation dose to the rest of the body tissues could be calculated and so that photon and electron scattering in the animal tissues would be properly modeled. The SCMS code (14) was used to prepare MCNP input files from the image data. Using methods established for human studies, radiation transport calculations were performed using MCNP, version 4C, on the segmented images. AFs for all identified organs (self-dose and cross dose) were calculated at discrete initial energies: 0.1, 0.2, 0.4, 0.7, 1.0, 2.0, and 4.0 MeV for electrons and 0.01, 0.015, 0.02, 0.03, 0.05, 0.1, 0.2, 0.5, 1, 1.5, 2, and 4 MeV for photons.
Electron and photon histories were run on a multimode computer cluster (15) at numbers sufficient to reduce uncertainties (coefficients of variation [COVs]) in most AFs to 5%–10%. Dose conversion factors (absorbed dose in a target/disintegration in a source) for 90Y, 111In, 131I, and 188Re were calculated using the AFs generated from, and the decay data taken from, the Radiation Dose Assessment Resource (16).
RESULTS
Data presented in supplemental tables are available online only, at http://jnm.snmjournals.org. Tables 1 and 2 show the organ mass values for the mouse and rat models developed in this study and values reported or modeled by others (5,10,17,18). Figures 1 and 2 show sample cross sections from the mouse and rat image sets, respectively. Figure 3 shows an image of the segmented mouse model. Supplemental Tables 1 and 2 show the AFs for photon and electron sources for the mouse model, and supplemental Tables 3 and 4 show the AFs for photon and electron sources for the rat model as determined by Monte Carlo modeling in this study. Most COVs were between 5% and 10%. No value was entered in the tables when the COV exceeded 50%; these values were assumed to be zero for the purposes of calculating dose conversion factors. Supplemental Tables 5 and 6 give dose conversion factors, based on the AFs in supplemental Tables 1–4, for some source–target pairs for several important radionuclides. AF data for tissue outside segmented organs but inside the body are labeled “other tissues.” Figures 4–7 show characteristic AF plots for electrons and photons in selected organs of the rat and mouse models.

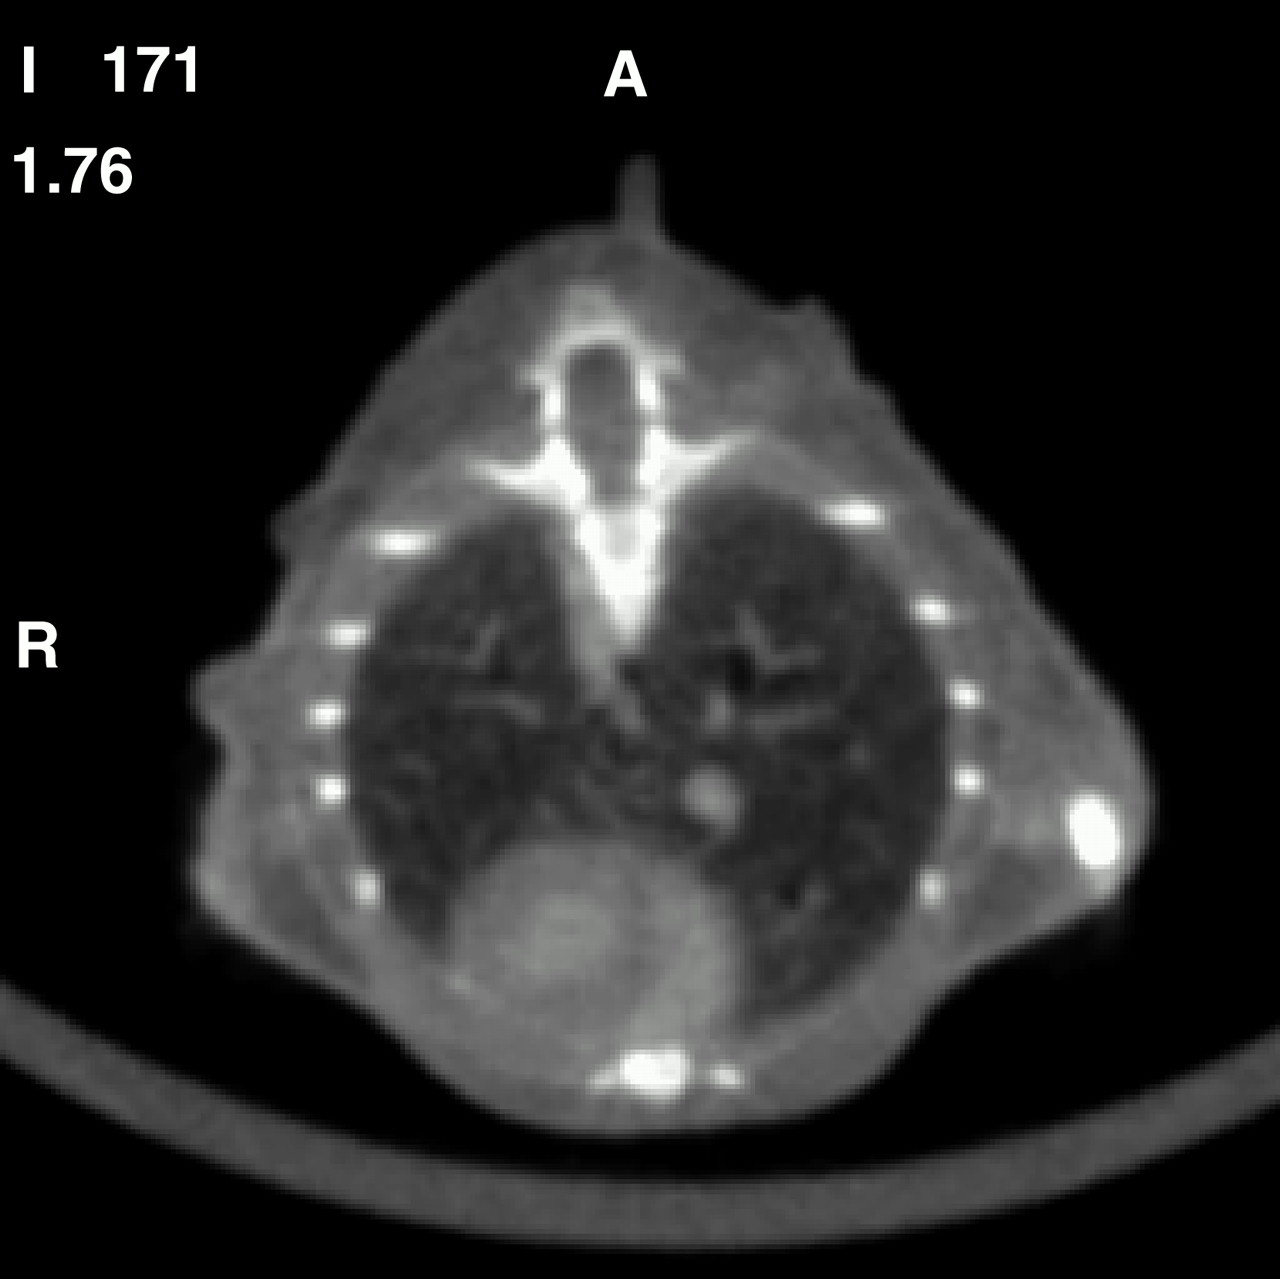
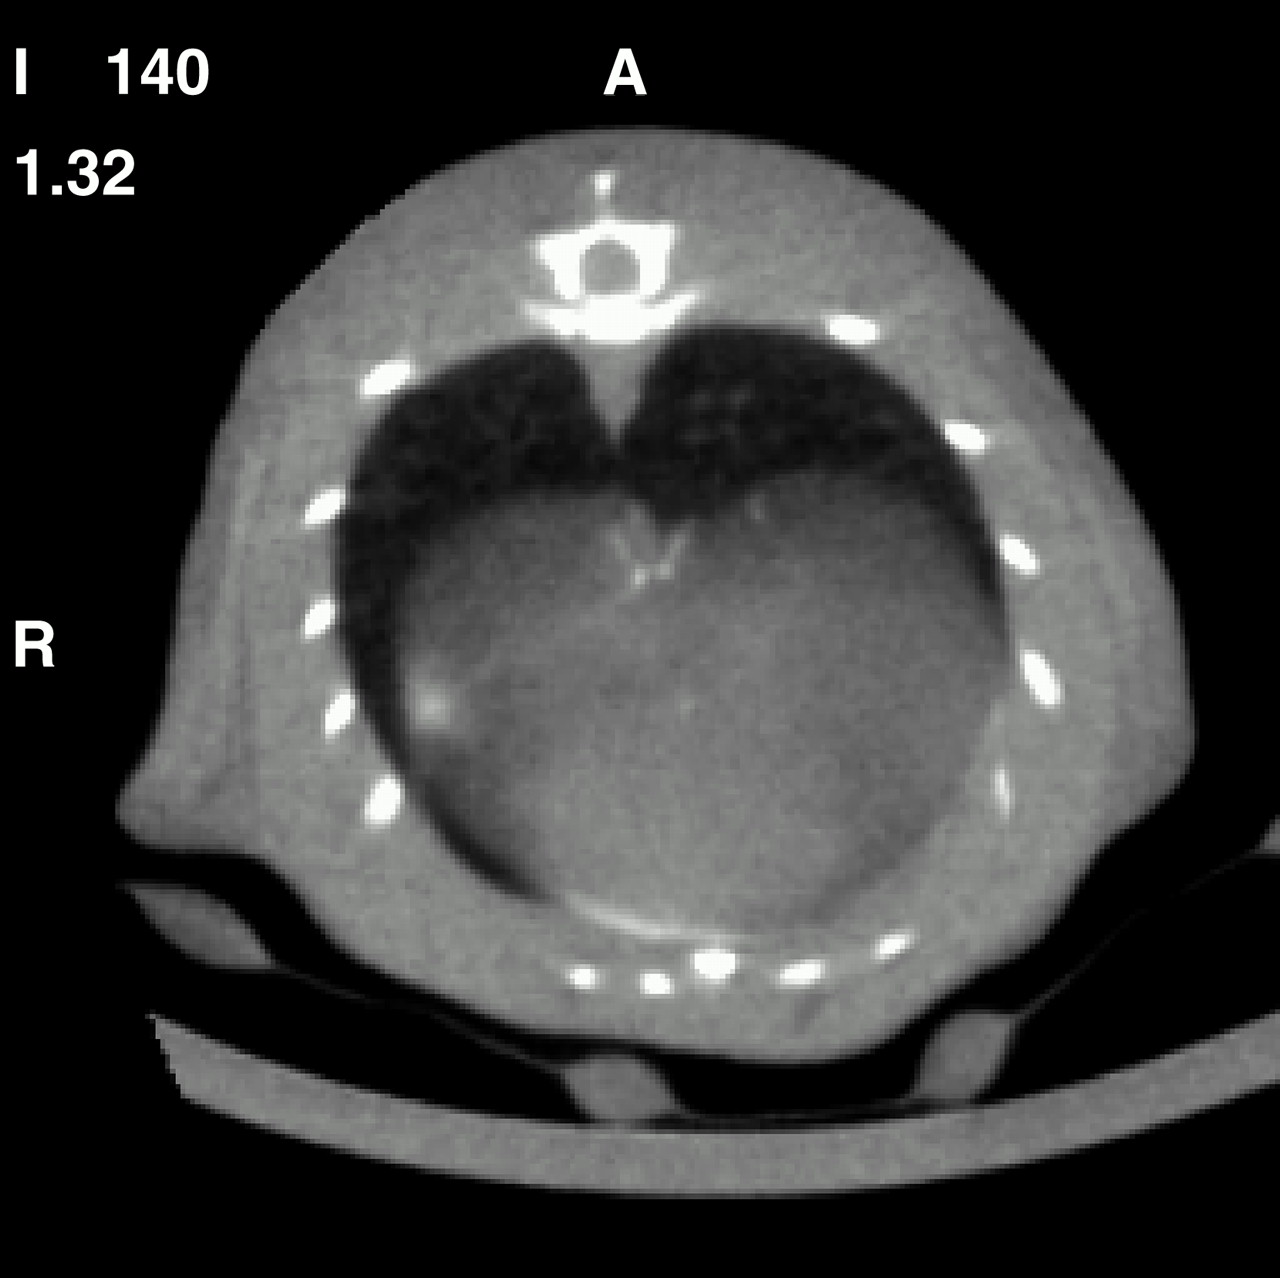
Sample cross section of mouse image set, showing heart, lungs, and some skeletal features.

Sample cross section of rat image set, showing liver, lungs, and some skeletal features.
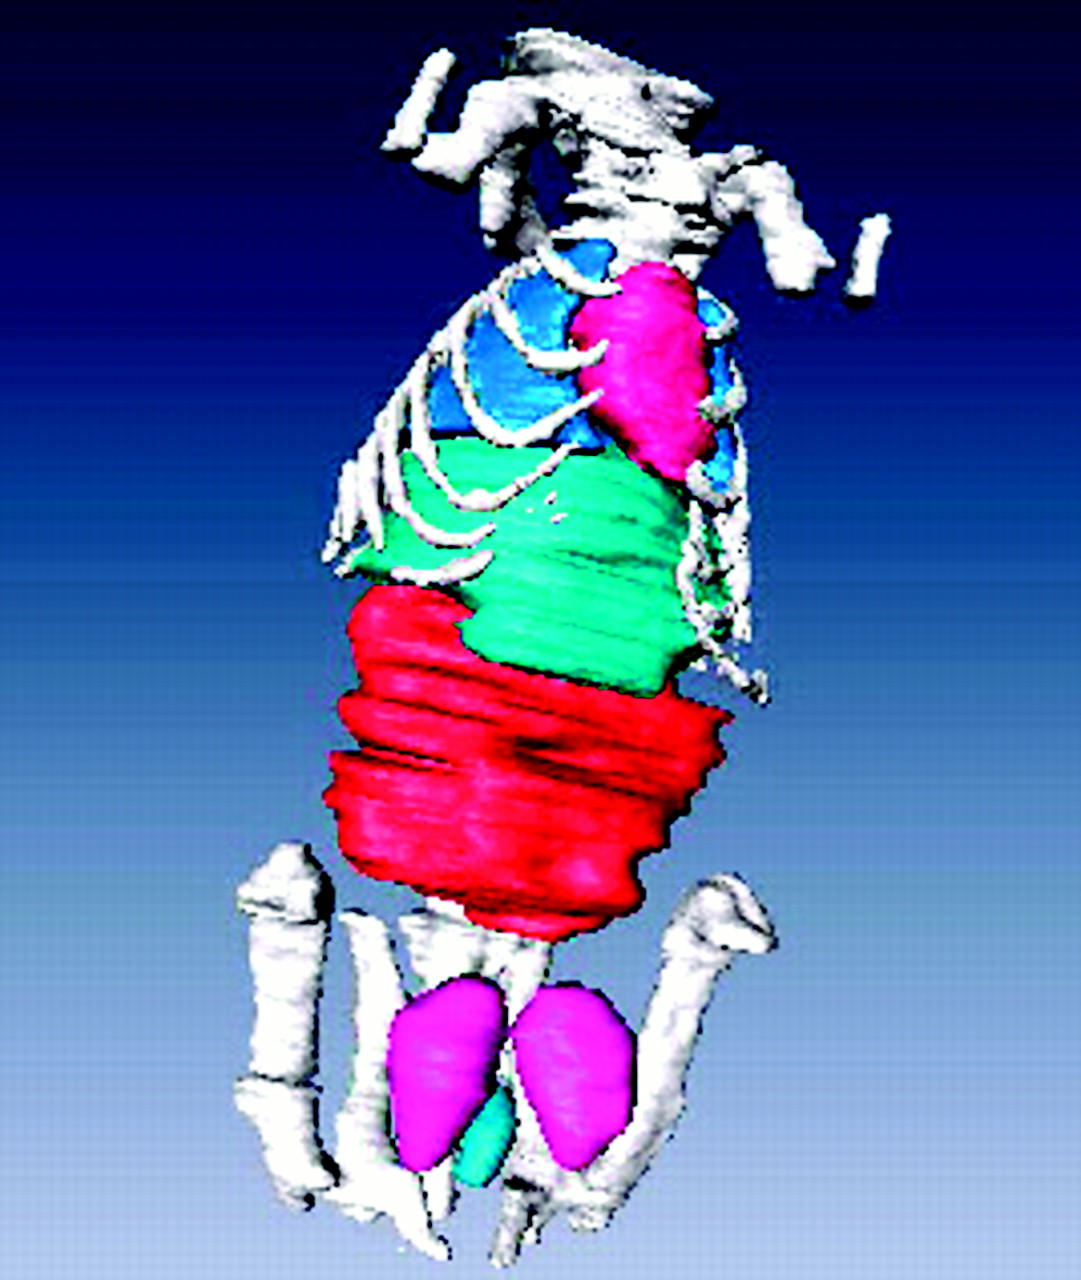
Image of some regions of segmented mouse model.

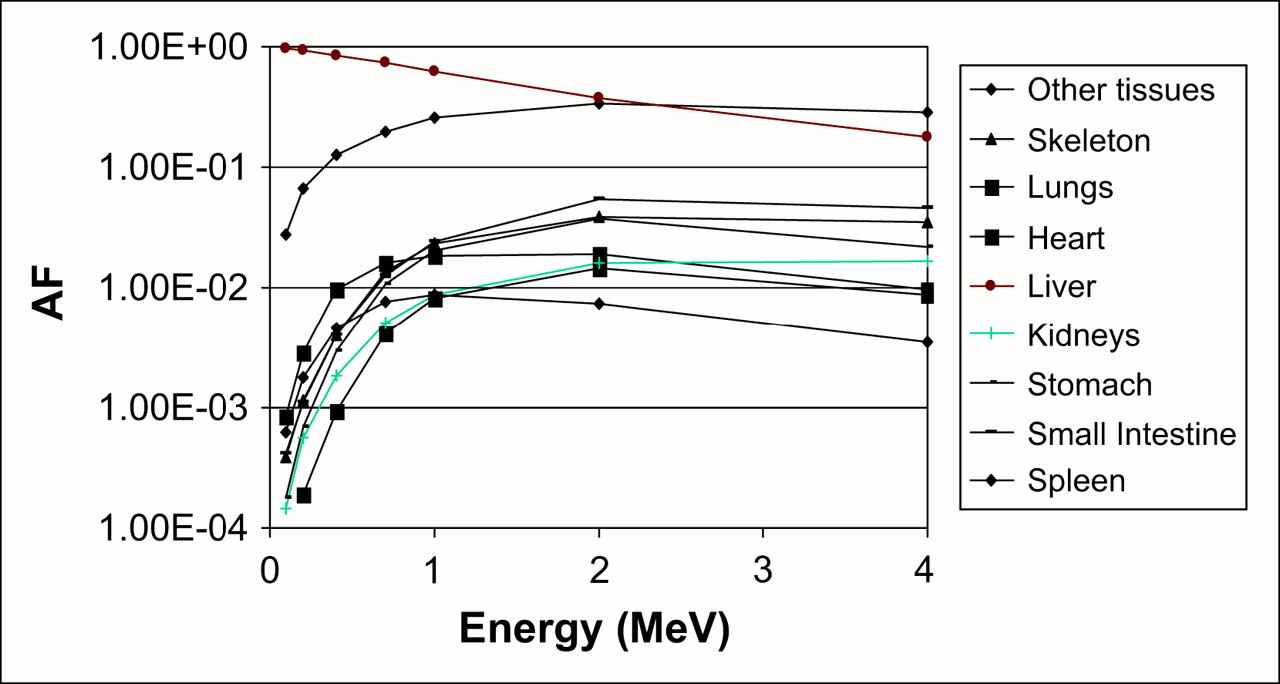
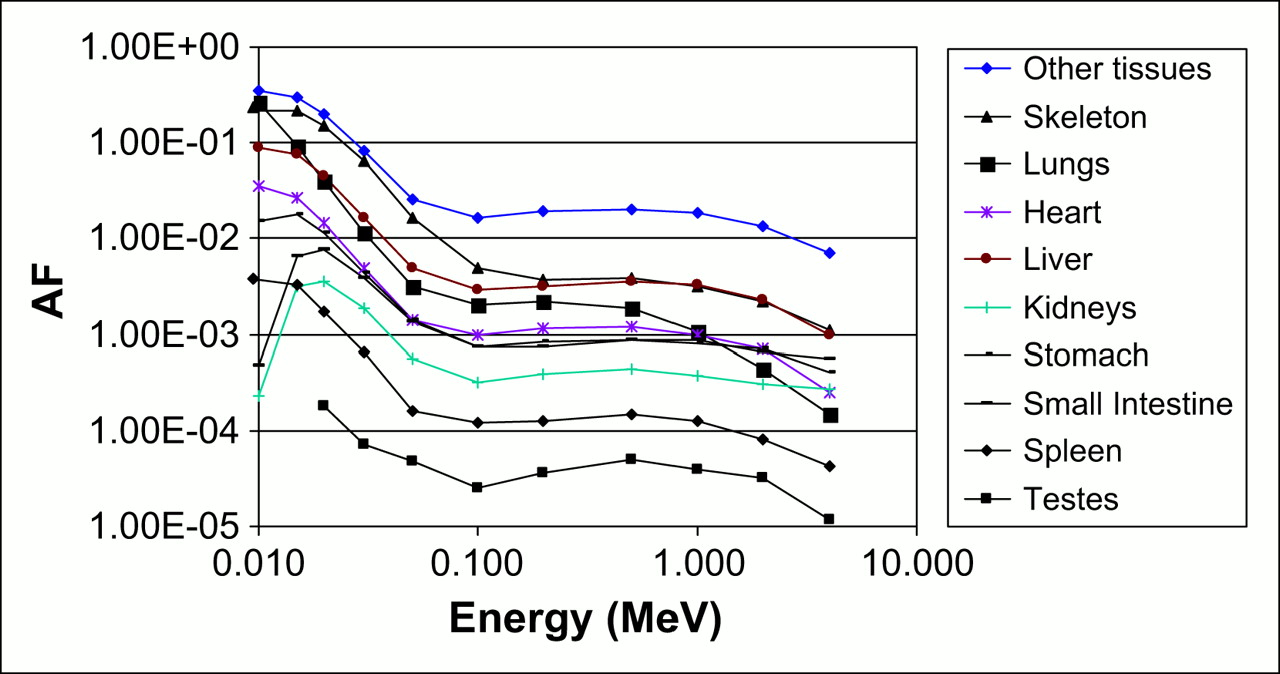
Plot of photon AFs for lungs as a source in mouse model.
Plot of electron AFs for liver as a source in mouse model.

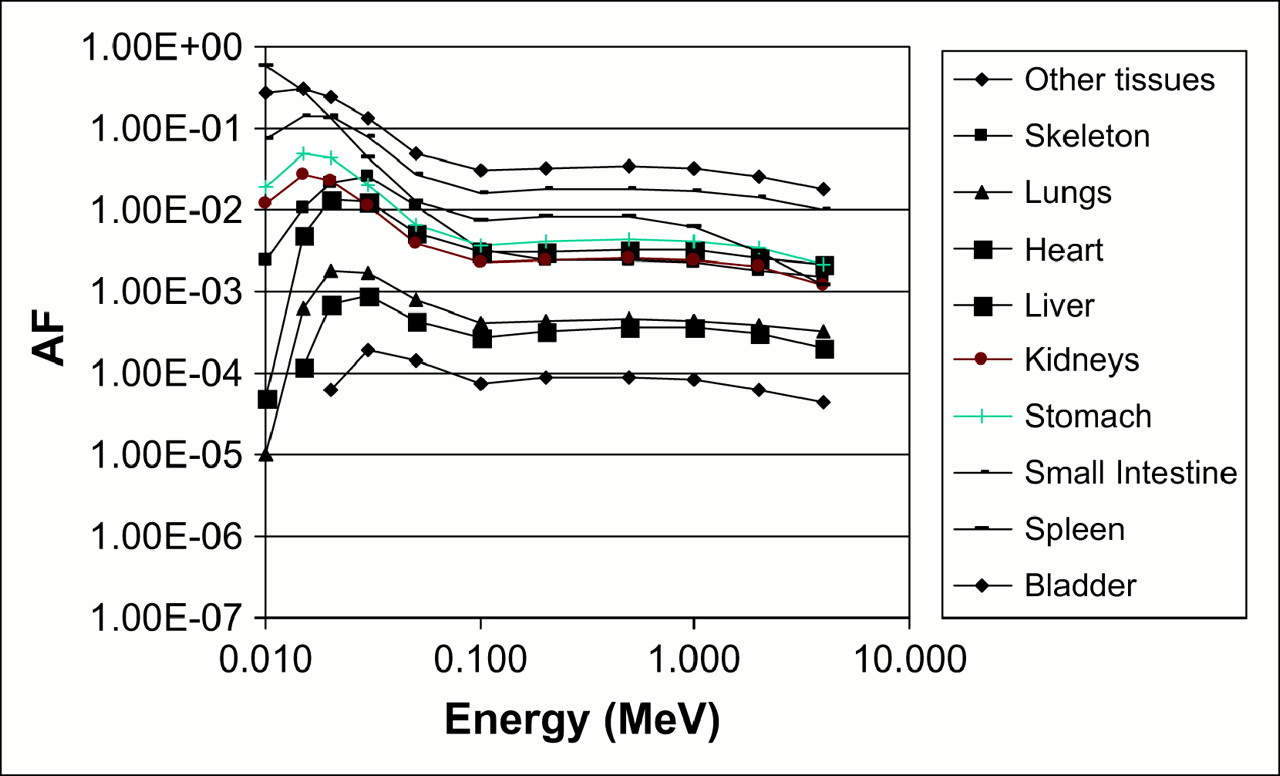
Plot of photon AFs for spleen as a source in rat model.

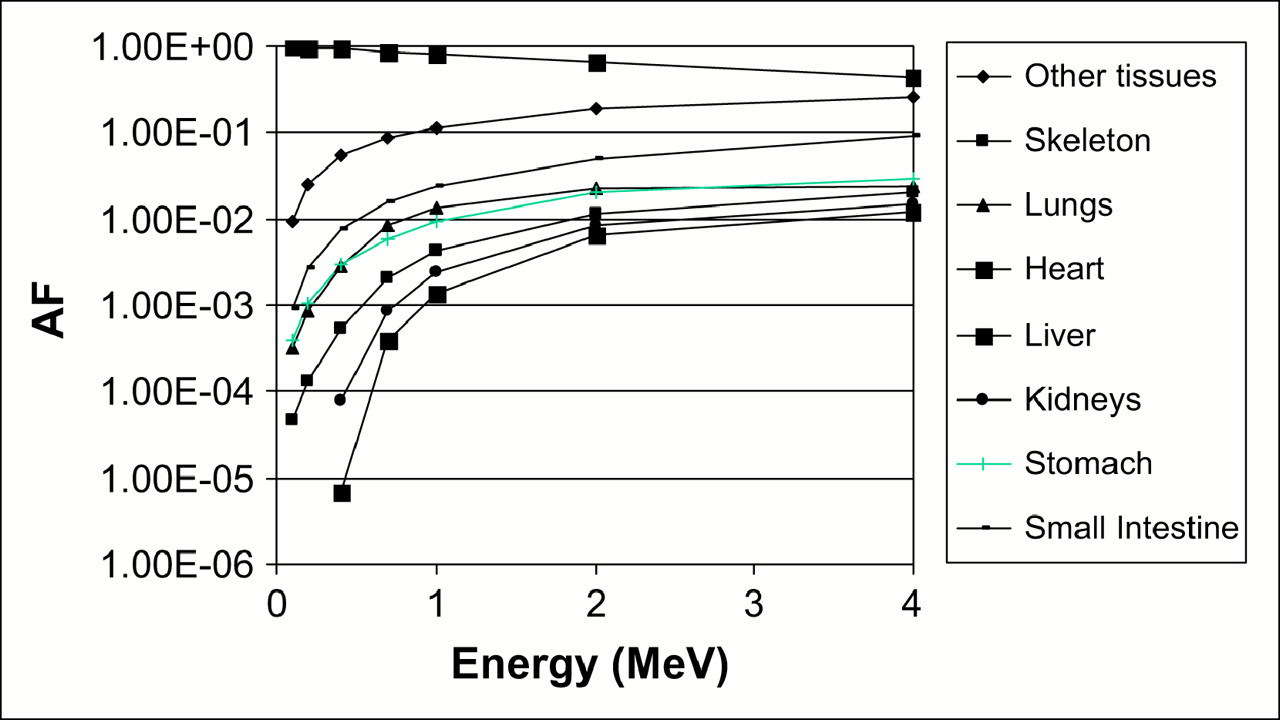
Plot of electron AFs for liver as a source in rat model.
DISCUSSION
Electron self-irradiation AFs were significantly less than 1.0 for many organs, at energies above 0.5 MeV, and significant amounts of cross irradiation were observed for high-energy electrons, such as those from 90Y or 188Re, in many organs. Thus, the historical assumption that all electron energy is absorbed within the source that emits it is particularly inaccurate for small organs such as are present in these animals. Particularly for the electron sources, it was difficult to obtain reliable AFs with COVs always under 20%. No values are reported for AFs with COVs over 50%, but for some distant organs, some AFs that have COVs as high as 50% are reported. In some organ pairs, only a few AFs are reliable enough to be reported. In these cases, trends in AFs as a function of energy are not seen, and the AFs are of limited value because reliable dose conversion factors for a given nuclide cannot be estimated. They may, however, give simply some idea of whether electrons of a given energy may contribute somewhat to the dose to another organ.
The organ masses observed in this subject agreed reasonably well with those reported by others for mice of similar size (Table 1), but the values for the rat were larger than those suggested for a 250-g animal (Table 2). The dose to the red marrow is of interest to many investigators when radiotoxicity may be of concern. Even in human models, with much larger bone structures, it is not possible to segment the intricate structures of the marrow from CT or MR images. Therefore, dose conversion factors for bone and marrow are extracted from other modeling approaches (19). In this model, the skeletal regions were visible and were identified. The dose factors for the “skeleton” may be used to approximate the photon dose to the marrow or dividing bone cells. No comprehensive animal model for electron self-dose to the skeleton has been advanced. As in humans, this is a significant and separate modeling effort not treatable with macroscopic geometric models—not even with realistic models based on image data.
Masses for the Mouse Organs for This Study, with Comparisons to Values Observed in Other Investigations
Masses for the Rat Organs for This Study, with Comparisons to Values Observed in Other Investigations
The intestines in both species were segmented as a uniform region encompassing all tissue that might reasonably be construed as intestine. No attempt was made to segment individual regions of the intestine (i.e., to differentiate wall from contents), and some connective and other tissue was probably included. Thus, the mass of the intestines as reported in Tables 1 and 2 may be difficult to relate to others' results; however, the dose averaged over this volume from photon sources should be reasonably representative of the dose that the intestines will receive. Doses from electron sources within the intestines may be calculated using the same hollow organ approximation as is used in current human phantoms (i.e., the specific absorbed fraction is assumed to be equal to 1/(2 × mC), where mC is the mass of the organ contents). The bladder in the mouse imaged was particularly small and may not be representative of the average in this species. Similarly, the testes in the mouse imaged were particularly large, and this model may not be a good representation of all mice of this type. No testes were segmented in the rat model. The bladder and testes are not usually important to dosimetry in these small animals; doses received by the major abdominal organs are quite reliable in these models and are usually of higher importance.
Table 3 shows a favorable comparison of the self-AFs for 90Y reported by Flynn et al. (8) with those observed in this study. Table 4 compares the mouse organ dose conversion factors calculated in this study with similar values calculated by Hindorf et al. (10). Again, the comparison is favorable, with the differences being attributable to differences in the individual animal organ masses and geometries.
Comparison of Self-Absorbed Fractions for 90Y with Those of Flynn et al.
Comparison of S Values for 3 Radionuclides in the Mouse Liver with Those of Hindorf et al. (Monte Carlo Results for the 1.11 g Values from Their Table 2)
The AFs calculated in this study will be useful in determining the dose to organs for mice and rats similar in size to those studied here. These animals were chosen as being typical of mouse and rat models often used in preclinical investigations. Other animal models representing rodents of different sizes can be studied using the methods described here, given acquisition of appropriate image data. Although the models given here are specific to the particular animal imaged, they are believed to be sufficiently representative for the establishment of reasonable dose factors for the segmented organs and are clearly more anatomically correct than are stylized models. Although they represent data from only a single animal imaged, these animals were chosen to represent body masses close to those of typical, frequently applied animal models. Previous models, based on nonrealistic geometric shapes, similarly produced results applicable only to an animal of exactly that size. The dose estimates produced here will be accurate if the animal is close to this mass, and they may be slightly higher or lower for animals of similar, but not identical, body mass. Of course, we face this same problem every time we use dose estimates based on “Standard Man” (4), who has a body mass of 70 kg. Because few subjects have a body mass and geometry identical to that of Standard Man, dose estimates based on this average value are approximate and may be specifically interpreted for an individual subject, based on the characteristics of that subject.
Fused PET/CT or SPECT/CT image data can be used in preclinical investigations of animals—as in clinical investigations of humans—for calculating 3-dimensional distributions of doses to organs. The segmented, voxel-based models developed here can be used for external dose calculations as well. Further models can be developed representing other animal species, or other individual animals of the same rodent species but of different mass, to aid in understanding the variability in dose numbers reported here.
Acknowledgments
This research of one of the authors was supported in part by a Career Award at the Scientific Interface from the Burroughs Wellcome Fund.
References
- Received for publication October 26, 2005.
- Accepted for publication December 23, 2005.


Jump to section
Related Articles
Cited By...
- Quantification of Macrophage-Driven Inflammation During Myocardial Infarction with 18F-LW223, a Novel TSPO Radiotracer with Binding Independent of the rs6971 Human Polymorphism
- Nephrotoxicity in Mice After Repeated Imaging Using 111In-Labeled Peptides
- The Monte Carlo Method in Nuclear Medicine: Current Uses and Future Potential
- RADAR Realistic Animal Model Series for Dose Assessment
- Canine Anatomic Phantom for Preclinical Dosimetry in Internal Emitter Therapy
- Reduced Myelotoxicity with Sustained Tumor Concentration of Radioimmunoconjugates in Rats after Extracorporeal Depletion