


Abstract
Phantom-based and patient-specific imaging-based dosimetry methodologies have traditionally yielded mean organ-absorbed doses or spatial dose distributions over tumors and normal organs. In this work, radiobiologic modeling is introduced to convert the spatial distribution of absorbed dose into biologically effective dose and equivalent uniform dose parameters. The methodology is illustrated using data from a thyroid cancer patient treated with radioiodine. Methods: Three registered SPECT/CT scans were used to generate 3-dimensional images of radionuclide kinetics (clearance rate) and cumulated activity. The cumulated activity image and corresponding CT scan were provided as input into an EGSnrc-based Monte Carlo calculation: The cumulated activity image was used to define the distribution of decays, and an attenuation image derived from CT was used to define the corresponding spatial tissue density and composition distribution. The rate images were used to convert the spatial absorbed dose distribution to a biologically effective dose distribution, which was then used to estimate a single equivalent uniform dose for segmented volumes of interest. Equivalent uniform dose was also calculated from the absorbed dose distribution directly. Results: We validate the method using simple models; compare the dose-volume histogram with a previously analyzed clinical case; and give the mean absorbed dose, mean biologically effective dose, and equivalent uniform dose for an illustrative case of a pediatric thyroid cancer patient with diffuse lung metastases. The mean absorbed dose, mean biologically effective dose, and equivalent uniform dose for the tumor were 57.7, 58.5, and 25.0 Gy, respectively. Corresponding values for normal lung tissue were 9.5, 9.8, and 8.3 Gy, respectively. Conclusion: The analysis demonstrates the impact of radiobiologic modeling on response prediction. The 57% reduction in the equivalent dose value for the tumor reflects a high level of dose nonuniformity in the tumor and a corresponding reduced likelihood of achieving a tumor response. Such analyses are expected to be useful in treatment planning for radionuclide therapy.
The tools and methodologies for performing radionuclide dosimetry for therapeutic nuclear medicine applications have evolved over the past 2 decades such that current research focuses on patient-specific 3-dimensional (3D) image or voxel-based approaches (1,2). In this work, we describe an extension of this methodology that incorporates radiobiologic modeling to account for the spatial distribution of absorbed dose and the effect of dose rate on biologic response. The methodology is incorporated into a software package, called 3D-RD, for 3D radiobiologic dosimetry.
Patient-specific 3D imaging–based internal dosimetry is a methodology in which the patient's own anatomy and spatial distribution of radioactivity over time are factored into an absorbed dose calculation that provides as output the spatial distribution of absorbed dose (3–8). This method accepts as input a CT image of the patient and one or more SPECT or PET images. The CT image is used to provide the density and composition of each voxel for use in a Monte Carlo calculation; CT images are also used to define organs or regions of interest for computing spatially averaged doses. A longitudinal series of PET or SPECT images is used to perform a voxelwise time integration and obtain the cumulated activity or total number of disintegrations on a per-voxel basis. If multiple SPECT or PET studies are not available, a single SPECT or PET image can be combined with a series of planar images. By assuming that the relative spatial distribution of activity does not change over time, one can apply the kinetics obtained from longitudinal planar imaging over a tumor or normal organ volume to the single SPECT or PET image, thereby obtaining the required 3D image of cumulated activity. The results of such a patient-specific 3D imaging–based calculation can be represented as a 3D parametric image of absorbed dose, as dose-volume histograms over user-defined regions of interest, or as the mean and range of absorbed doses over such regions (9).
The objective of such patient-specific voxel-based absorbed dose calculations is to better predict biologic effect. The highly patient-specific methodology outlined above is a step in this direction; a further step toward this goal would couple the output described above with radiobiologic models that account for the spatial absorbed dose distribution and the rate at which it is delivered. The former can be described by the radiobiologic model–derived quantity, the equivalent uniform dose (EUD, defined on a per-structure basis); the latter by the biologically effective dose (BED, defined on a per-voxel basis).
The uniformity (or lack thereof) of absorbed dose distributions and their biologic implications have been examined extensively, primarily in animal studies (10–14). Dose-volume histograms have been used to summarize the large amount of data present in 3D distributions of absorbed dose in radionuclide dosimetry studies (15). The EUD model takes this one step further by introducing the radiobiologic parameters α and β, the sensitivity per unit dose and per unit dose squared, respectively, defined in the linear-quadratic dose-response model. The EUD model converts the spatially varying absorbed dose distribution into an equivalent uniform absorbed dose value that would yield a biologic response similar to that expected from the original dose distribution. This conversion provides a single value that may be used to compare different dose distributions; the value also reflects the likelihood that the magnitude and spatial distribution of the absorbed dose are sufficient for tumor kill (13).
That dose rate influences response has been known since at least the early 1970s (16). The BED formalism (17,18), initially termed extrapolated response dose, was developed to compare different fractionation protocols for external radiotherapy. BED may be thought of as the actual physical dose adjusted to reflect the expected biologic effect if it were delivered at a reference dose rate. As in the case of EUD, by relating effects to a reference value, one can compare doses delivered under different conditions. In the case of EUD, the reference value relates to spatial distribution and is chosen to be a uniform distribution. In the case of BED, the reference value relates to dose rate and is chosen to approach zero (total dose delivered in an infinite number of infinitesimally small fractions).
In radionuclide therapy, the dose rate varies temporally, and several investigators have examined the implications of this variability on tumor control and normal tissue toxicity (19–21). To date, almost all clinical studies have considered total absorbed dose, the majority of which is delivered at an exponentially decreasing dose rate, whereas the benchmark for projecting potential toxicity and justifying initial phase I activity and absorbed dose levels has been the experience with normal-organ tolerance in external-beam radiotherapy, the majority of which is delivered at a high dose rate in daily 2-Gy fractions for 30–40 d. The simplest and more generally applied (exponential repair) BED model was implemented in this work.
The implications of radiobiologic modeling and response prediction are examined using a simple spherical representation of target and normal-organ tissue. The methodology is also applied to a clinical case that illustrates the features and potential clinical importance of the approach.
MATERIALS AND METHODS
The previously developed 3D imaging–based patient-specific dosimetry methodology (7,9,22) has been extended to better incorporate Monte Carlo calculations, which are needed in cases of variable tissue density, and to include radiobiologic modeling by incorporating the BED and EUD formalisms. The resulting second-generation dosimetry package, 3D-RD, was applied in a patient study to illustrate its features and impact on patient dosimetry.
3D Imaging–Based Dosimetry
3D imaging-based dosimetry entails the following steps: First, a series of longitudinal 3D SPECT/CT or PET/CT images are input. Second, the images are registered across time by using both the SPECT or PET dataset and the corresponding CT set. Third, the cumulated activity is obtained for each voxel either by fitting an exponential function to each voxel and integrating analytically over time or by performing a numeric integration over time for each voxel (23,24). Fourth, the CT image voxel values are used to assign density and composition (i.e., water, air, and bone) (5,25). Fifth, the 3D cumulated activity image and the matched density and composition image are used to perform a Monte Carlo calculation to estimate the absorbed dose by tallying energy deposition in each voxel (5). Sixth, the absorbed dose distribution is presented as a set of images, isodose contour plots, or dose-volume histograms for user-identified tumor or normal organ volumes.
To introduce radiobiologic modeling, we modified the process described above so that the third step was preceded by an estimate of clearance rate in each voxel. This information, coupled with assignment of the radiobiologic parameters α, β, and μ—radiosensitivity per unit dose, radiosensitivity per unit dose squared, and repair rate assuming an exponential repair process, respectively (26)—is used to generate a BED value for each voxel and, subsequently, an EUD value for a particular user-defined volume.
In external radiotherapy, the expression for BED is Eq. 1This equation applies to N fractions of an absorbed dose d, delivered over an interval that is negligible relative to the repair time for radiation damage (i.e., at a high dose rate), where the interval between fractions is long enough to allow for complete repair of repairable damage induced by the dose d; repopulation of cells is not considered in this formulation. The parameters α and β are the coefficients for radiation damage proportional to dose (a single event is lethal) and dose squared (2 events are required for lethal damage), respectively. A more general formulation of Equation 1 is
 Eq. 2where BED(T) is the BED delivered over a time T, DT(T) is the total dose delivered over this time, and RE(T) is the relative effectiveness per unit dose at time T. The general expression for RE(T) assuming a time-dependent dose rate described by
  is given by
 Eq. 3The second integration over the time parameter, w, represents the repair of potentially lethal damage occurring while the dose is delivered, that is, assuming an incomplete repair model (27). If we assume that the dose rate for radionuclide therapy,
  , at a given time t can be expressed as an exponential expression:
 Eq. 4where
  is the initial dose rate and λ is the effective clearance rate (= ln(2)/te; te = effective clearance half-life of the radiopharmaceutical), then, in the limit, as t approaches infinity, the integral in Equation 3 reduces to
 Eq. 5Substituting this expression and replacing DT(T) with D, the total dose delivered, and using
  , which may be derived from Equation 4, we get
 Eq. 6In this expression, the effective clearance rate, λ, is represented by ln(2)/te. The derivation closely follows that described by Dale et al. (26).
In cases in which the kinetics in a particular voxel are not well fitted by a single decreasing exponential alternative, formalisms have been developed that account for an increase in the radioactivity concentration followed by exponential clearance. Because the number of imaging time points typically collected in dosimetry studies would not resolve a dual-parameter model (i.e., uptake and clearance rate), the current methodology assumes that the total dose contributed by the rising portion of a tissue or tumor time–activity curve is a small fraction of the total absorbed dose delivered.
Equation 6 depends on the tissue-specific intrinsic parameters α, β, and μ. These 3 parameters are set constant throughout a user-defined organ or tumor volume. The voxel-specific parameters are the total dose in a given voxel and the effective clearance half-life assigned to the voxel. Given a voxel at coordinates (i,j,k), Dijk and  are the dose and effective clearance half-life for the voxel. The imaging-based formulation of Equation 6 that is incorporated into 3D-RD is then
 Eq. 7The user inputs values of α, β, and μ for a particular volume, and Dijk and
  are obtained directly from the 3D dose calculation and rate image, respectively. This approach requires organ or tumor segmentation that corresponds to the different α, β, and μ values. The dose values are obtained by Monte Carlo calculation as described previously, and the effective clearance half-lives are obtained by fitting the data to a single exponential function, as has previously been described (9). Once a spatial distribution of BED values has been obtained, a dose-volume histogram of these values can be generated. Normalizing so that the total area under the BED (differential) DVH curve is 1 converts the BED DVH to a probability distribution of BED values denoted P(ψ), where ψ takes on all possible values of BED. Then, following the derivation for EUD (13), the EUD is obtained as
 Eq. 8
Eq. 8
The EUD of the absorbed dose distribution, as opposed to the BED distribution, can also be obtained using Equation 8 but using a normalized DVH of absorbed dose values rather than BED values. Equation 8 may be derived by determining the absorbed dose required to yield a surviving fraction equal to that arising from the probability distribution of dose values (absorbed dose or BED) given by the normalized DVH.
It is important to note that a rigorous application of Equation 7 would require estimation of the absorbed dose at each time point; the resulting set of absorbed dose values for each voxel would then be used to estimate  . In using activity-based rate images to obtain the
  , instead of the absorbed dose at each time point, the implicit assumption is being made that the local voxel self-absorbed dose contribution is substantially greater than the cross-voxel contribution. This assumption avoids the need to estimate absorbed dose at multiple time points, thereby substantially reducing the time required to perform the calculation. A methodology is being developed to address this issue and will be described in a separate report.
Radiobiologic Parameters
The illustrative simplified examples and the clinical implementation involve dose estimation to lungs and to a thyroid tumor. Values of α and β for lung were obtained from Van Dyk et al. (28) and for thyroid cancer were obtained from Gaussen et al. (29) and Challeton et al. (30), respectively. The constant of repair, μ, for each tissue was taken from Bodey et al. (31). The parameter values are listed in Table 1.
Radiobiologic Parameters Used in Clinical 3D-RD Calculation
Clearance Rate Effects
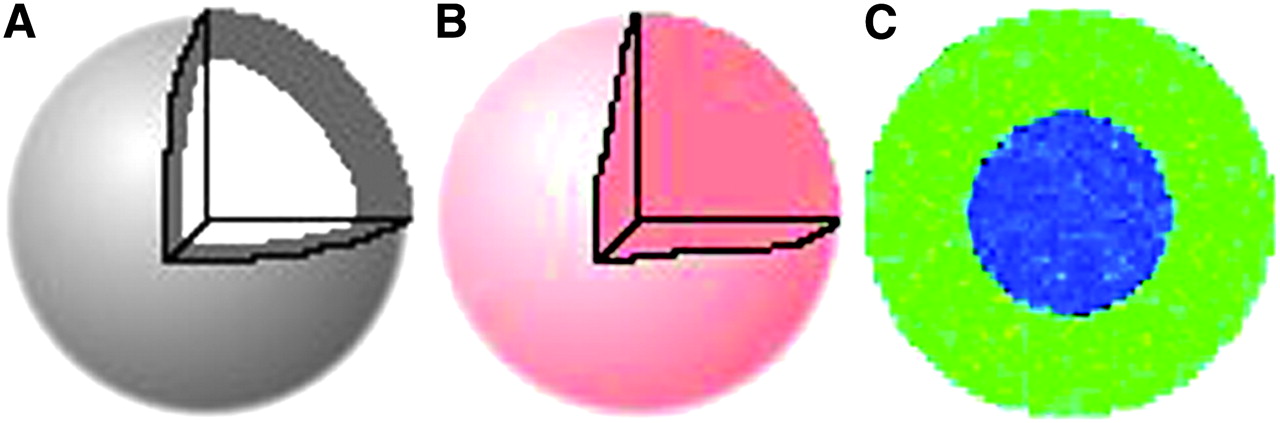
A sphere was generated in a 563 matrix such that each voxel represented a volume of (0.15 cm)3. All elements with a centroid greater than 1 cm and less than or equal to (2.0 cm)1/3 from the matrix center (at 28,28,28) were given a clearance rate value (λ) corresponding to a half-life of 2 h. Those elements with a center position less than or equal to 1.0 cm from the center voxel were assigned a λ value equivalent to a 4-h half-life. In this way, an outer shell (with a 2-h half-life) was separated from an inner sphere (with a 4-h half-life) (Fig. 1). This method allowed both regions to have nearly equivalent volumes. The procedure was used to generate a matrix representing a sphere with a uniform absorbed dose distribution despite having a nonuniform clearance rate. This matrix was generated by varying the initial activity such that the cumulative activity of both regions was identical. These 2 matrices were input into 3D-RD for the BED and EUD calculations. Input of a dose distribution rather than an activity distribution was necessary to enable a comparison with an analytic calculation. The partial-volume effects of a voxelized versus idealized sphere were avoided by using the shell and sphere volumes obtained from the voxelized sphere rather than from a mathematical sphere. The impact of sphere voxelization on voxel-based Monte Carlo calculations has previously been examined (32).
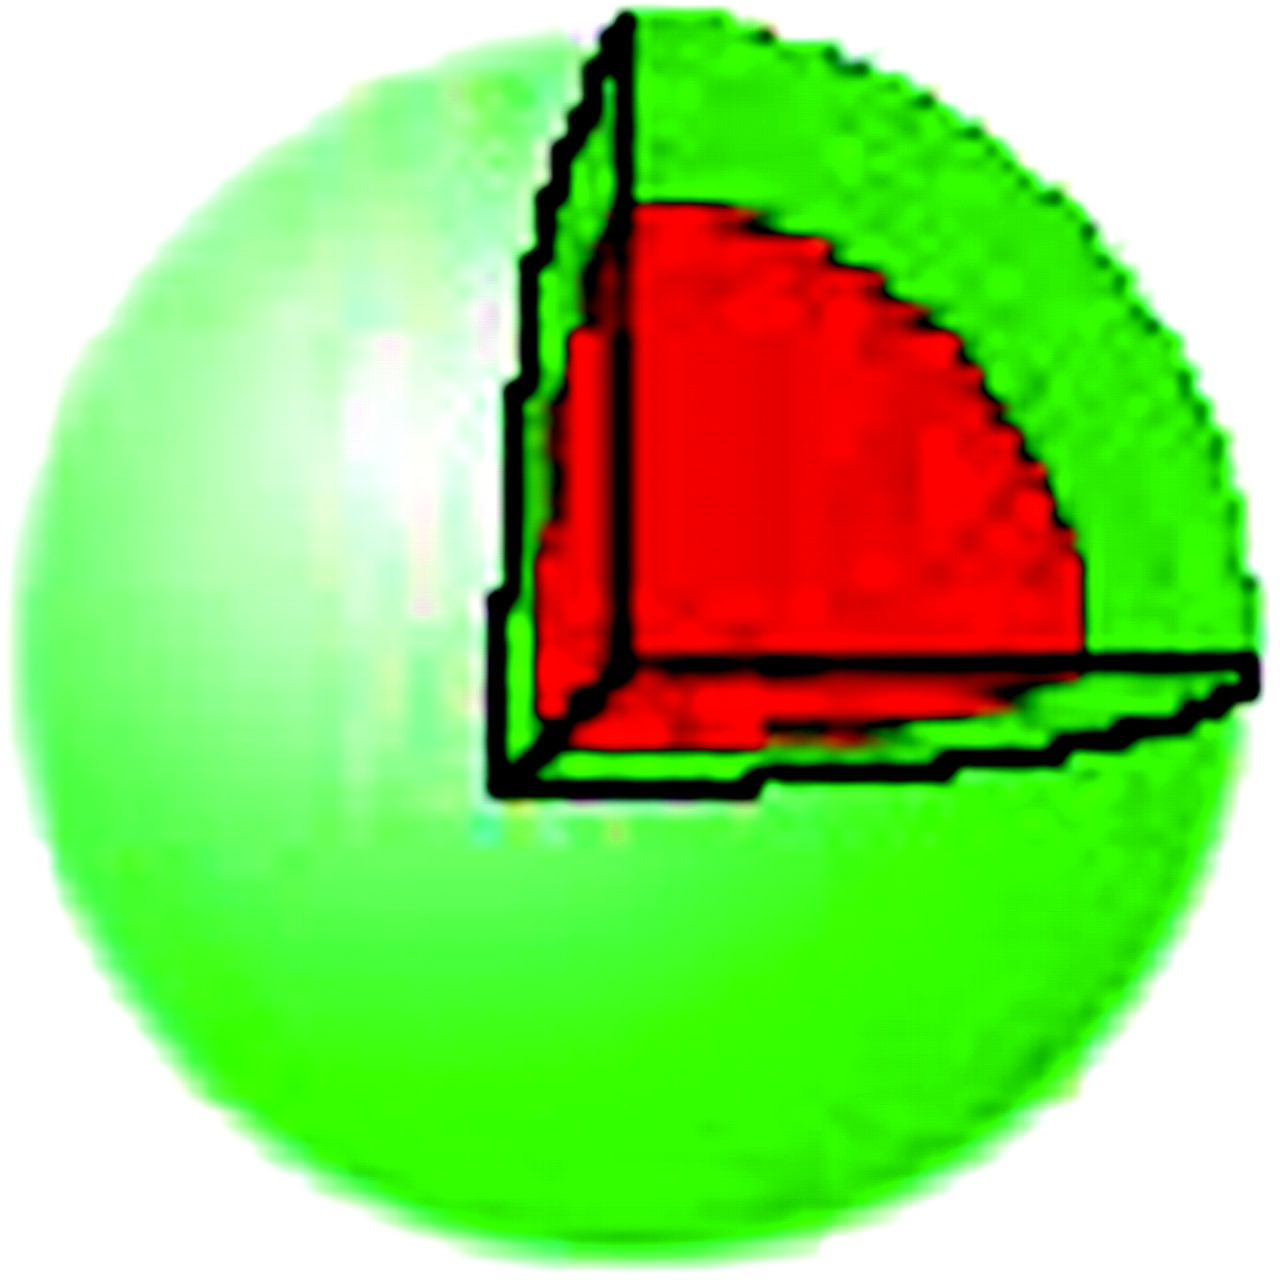
Uniform-density sphere with effective half-life of 2 h in outer green region and 4 h within red region. Green and red regions have equal volume in this example. Initial activity in each region is selected so that total numbers of decays are equal in both regions.
Absorbed Dose Distribution Effects
To demonstrate the impact of dose distribution on EUD, we evaluated the following model (Fig. 2). First, a uniform density sphere (1.04 g/cm3 in both regions) was evaluated with a uniform absorbed dose distribution of 10 Gy. Second, the uniform sphere was divided into 2 regions of equal volume. The inner sphere was assigned zero absorbed dose, and the outer shell was assigned an absorbed dose of 20 Gy. The effective half-life was 2 h in both regions. Again the average dose for the whole sphere was 10 Gy.

Density distribution (uniform) (A) for uniform activity distribution model (B) and nonuniform activity distribution model (C). In nonuniform distribution, same total activity as shown in Figure 3B is concentrated into half the volume (outer shell). Assuming a uniform density sphere (A), 2 activity distributions are depicted: uniform (B) and nonuniform (C). In C, the same total activity as in B is concentrated into the outer shell of the sphere.
Density Effects
To illustrate the effect of density differences, we created a 1.26-cm-radius sphere that had unit cumulated activity throughout but densities of 2 g/cm3 in a central spheric region of 1-cm radius and 1 g/cm3 in the surrounding spheric shell (Fig. 3). The input parameters were chosen to yield a mean dose over the whole sphere of 10 Gy. Because, for a constant spatial distribution of energy deposition, the absorbed dose is a function of density, the absorbed dose in the center is less than the absorbed dose of the shell. The distribution was selected so that the average over the 2 regions was 10 Gy. 3D-RD was used to generate a spatial distribution of absorbed dose values, which were then used to estimate EUD over the whole sphere.

(A) Spheric nonuniform density model in which inner sphere is twice unit density (2.0 g/cm3) and outer shell is at unit density (1.0 g/cm3). (B) Uniform activity distribution for density model in Figure 2A. (C) Cross-sectional slice of 3D-RD output for spheric nonuniform density model.
Application to a Patient Study
The 3D-RD dosimetry methodology was applied to an 11-y-old girl with thyroid cancer who had previously been described in a publication on Monte Carlo N-particle (MCNP)–based 3D-ID, or 3D internal dosimetry (32).
Imaging
SPECT/CT images were obtained at 27, 74, and 147 h after injection of 37-MBq (1.0-mCi) 131I. All 3 SPECT/CT images focused on the chest of the patient, and close attention was directed at aligning the patient identically for each image. The images were acquired with a Millennium VG Hawkeye system (GE Healthcare) with a 1.59-cm-thick crystal.
An ordered-subsets expectation maximization–based reconstruction scheme was used to improve quantization of the activity map (33). Ten iterations with 24 subsets per iteration were used. This reconstruction accounts for attenuation, patient scatter, and collimator response. Collimator response includes septal penetration and scatter. The SPECT image counts were converted to units of activity by accounting for the detector efficiency and acquisition time. This quantification procedure, combined with image alignment, made it possible to follow the kinetics of each voxel. Using the CT scans that were acquired with each SPECT scan, each subsequent SPECT and CT image was aligned to the 27-h 3D image set. A voxel-by-voxel fit to an exponential expression was then applied to the aligned dataset (22) to obtain the clearance half-time for each voxel.
To obtain mean absorbed dose, mean BED and EUD, and absorbed dose and BED volume histograms, we assigned voxels to either tumor or normal lung parenchyma using an activity threshold of 21% of the highest activity value; this approach is the same as one previously reported (32).
RESULTS
A spherical model was used to validate and illustrate the concepts of BED and EUD.
Clearance Rate Effects
Assuming that the sphere was lung tissue, and applying the radiobiologic parameters listed in Table 1, the BED value in the more slowly clearing region, corresponding to the inner sphere with an activity clearance half-life of 4 h, was 13.14 Gy. The more quickly clearing region (outer shell, 2-h half-life) yielded a BED value of 15.69 Gy. The same model using the radiobiologic values for tumor gave 10.09 Gy and 11.61 Gy for the more slowly and more quickly clearing regions, respectively. The mean absorbed dose value for all these regions was 10 Gy.
Absorbed Dose Distribution Effects
The EUD value over the whole sphere, when a uniform activity distribution was assumed, returned the mean absorbed dose of 10 Gy. A nonuniform absorbed dose distribution was applied such that the inner sphere was assigned an absorbed dose of zero and an outer shell of equal volume was assigned an absorbed dose of 20 Gy. In this case, the mean absorbed dose is 10 Gy, but the EUD was 1.83 Gy. The substantially lower EUD value is no longer a quantity that may be obtained strictly on physics principles but rather is dependent on the applied biologic model. The true absorbed dose has been adjusted to reflect the negligible probability of sterilizing all cells in a tumor volume when half the tumor volume receives an absorbed dose of zero.
Density Effects
In the sphere with nonuniform density (inner sphere density of 2 g/cm3; outer shell of equal volume (1 g/cm3)) and an average absorbed dose of 10 Gy, the EUD over the whole sphere was 6.83 Gy. The EUD value is lower than the absorbed dose value to reflect the nonuniformity in spatial absorbed dose (inner sphere, 5 Gy; outer shell, 15 Gy) arising from the density differences.
Application to a Patient Study
A 3D-RD calculation was performed for the clinical case. A dosimetric analysis for this patient, without the radiobiologic modeling described in this work, was previously published (32). That previous analysis used the Monte Carlo code MCNP, as opposed to EGSnrc that was used in this work. The clinical example illustrates all the elements investigated using the simple spherical geometry. As shown on the CT scan (Fig. 4A), there was a highly variable density distribution in the lungs because of tumor infiltration of normal lung parenchyma. Coupled with the low lung density, this variability gave a density and tissue composition that included air, lung parenchyma, and tumor (which was modeled as soft tissue). As shown on Figures 4B and 4C, the activity and clearance kinetics of 131I were also variable over the lung volume. These 2 datasets were used to calculate the cumulated activity images shown in Figure 4D.

(A) Clinical CT portion of a SPECT/CT scan of patient showing nonuniform density distribution in lungs. (B) Clinical SPECT scan of patient showing nonuniform activity distribution. (C) Rate map generated from 3 longitudinally aligned SPECT images; regions with effective half-life greater than physical half-life of 131I reflect tumor uptake. (D) Cumulative activity generated from rate map and SPECT.
The EGS-based 3D-RD calculation was compared with the previously published MCNP-based calculation (32). Figure 5 depicts the DVH of the absorbed dose distribution obtained with 3D-RD superimposed on the same plot as the previously published DVH. Good overall agreement between the 2 DVHs was observed, and the mean absorbed doses, expressed as absorbed dose per unit of cumulated activity in the lung volume, agreed well, at 3.01 × 10⁻⁵ and 2.88 × 10⁻⁵ mGy/MBq-s per voxel, for the published MCNP-based and 3D-RD values, respectively.
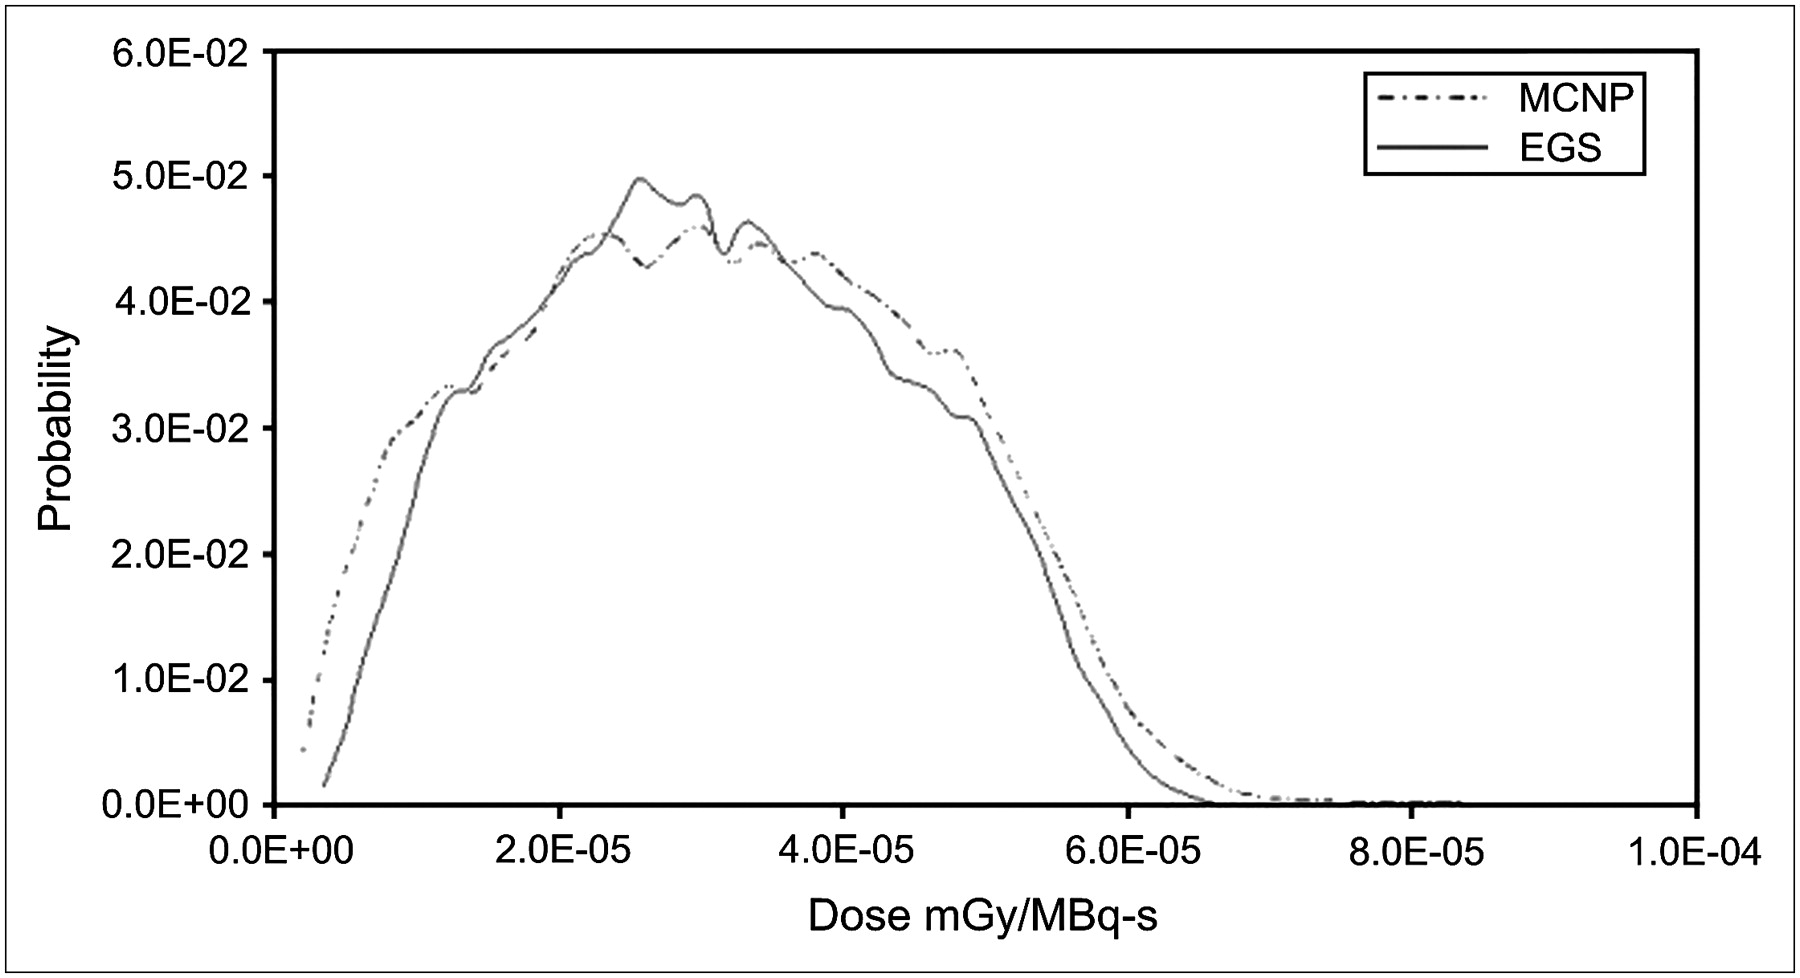
Comparison between MCNP-based dose volume histogram of Song et al. (32) over lung and tumor regions and results from EGS using same inputs. Mean value of MCNP method is 3.01 × 10⁻⁵ mGy/MBq-s per pixel, whereas EGS mean is 2.88 × 10⁻⁵ mGy/MBq-s per pixel.
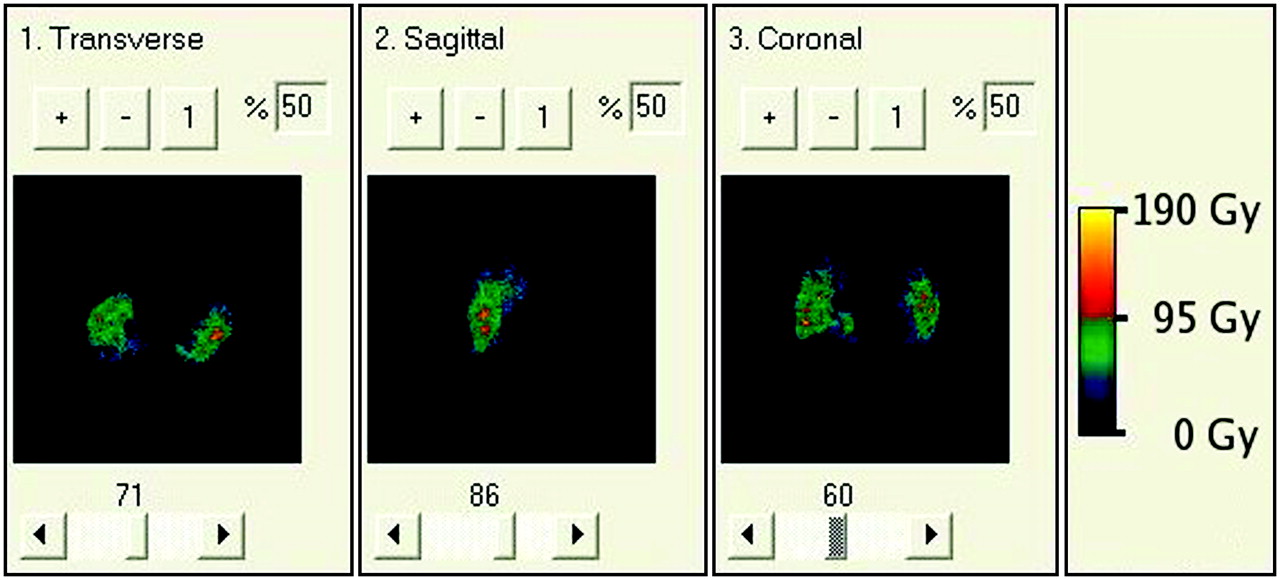
Figures 6 and 7 depict the results obtained with the radiobiologic modeling capabilities of 3D-RD. Figure 6 depicts a parametric image of BED values. Within this image, the spotty areas of highest dose are areas in which high activity and low density overlap. In Figure 7A, normalized (so that the area under the curve is equal to 1) DVH and BED DVH (BVH) are shown for tumor voxels. The near superimposition of DVH and BVH suggests that dose rate will have a minimal impact on tumor response in this case. Figure 7B depicts the normalized BVH for normal lung parenchyma. The DVH and BVH are given in Gy and reflect the predicted doses resulting from the administered therapeutic activity of 1.32 GBq (35.6 mCi) of 131I. These plots may be used to derive EUD values. It is important to note that the volume histograms must reflect the actual absorbed dose delivered and not the dose per unit of administered activity, because the EUD is a nonlinear function of absorbed dose. The model relies on estimation of a tumor control probability to yield the EUD. If the data used to estimate EUD are expressed as dose per administered activity, the EUD value will be incorrect. Mean absorbed dose, mean BED, and EUD are summarized in Table 2. The tumor EUD value, which accounts for the effect of a nonuniform dose distribution, was approximately 43% of the mean absorbed dose. This reduction brings the absorbed dose to a range that is not likely to lead to a complete response. The analysis demonstrates the impact of dose nonuniformity on the potential efficacy of a treatment.

BED map resulting from 3D-RD using full patient-specific data. Although values of absorbed dose and BED are different, their relative changes from voxel to voxel are so similar that it is nearly impossible to visually differentiate the two.
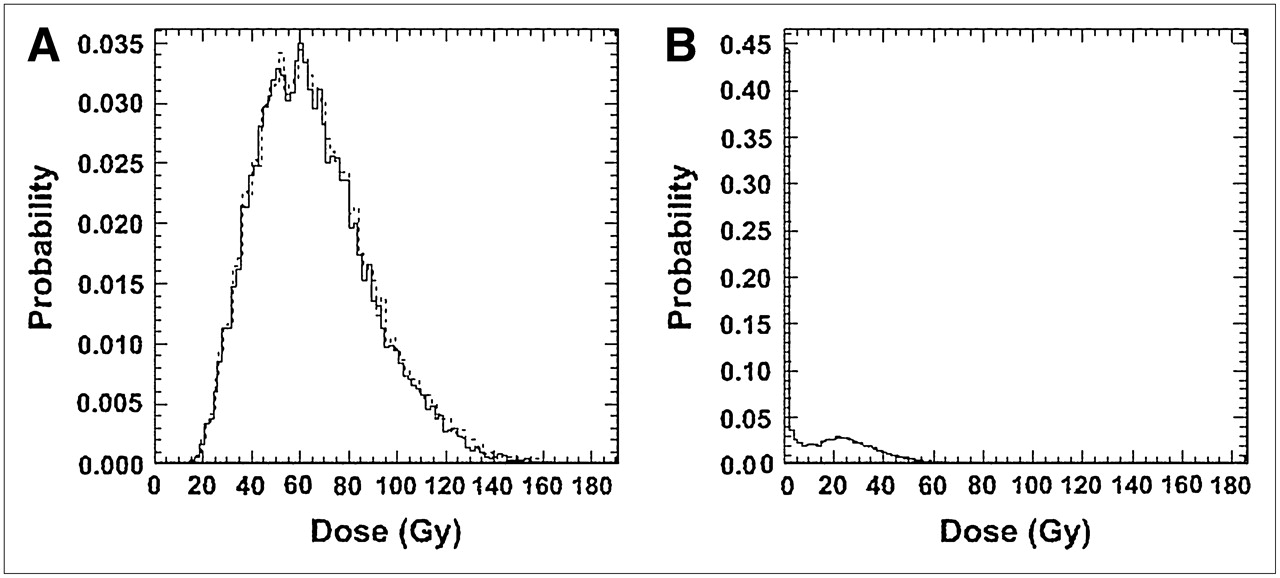
Differential absorbed dose (solid line) and BED (dashed line) volume histograms of tumor (A) and of lung (B) resulting from full patient-specific 3D-RD calculation.
Summary of Results from Clinical 3D-RD Calculation
DISCUSSION
The previously developed patient-specific dosimetry package, 3D-ID, is being rewritten to better integrate Monte Carlo calculations and also to incorporate radiobiologic modeling. The new package, 3D-RD, provides the radiobiologic dose parameters BED and EUD. The former adjusts the physical absorbed dose to reflect the impact of dose rate on tissue response, and the latter accounts for the spatial distribution of dose in adjusting the physical absorbed dose value.
The concept (and value) of EUD is illustrated by considering a tumor in which half the volume receives a dose of 200 Gy and the other half 0 Gy. Even though the average over the tumor volume is 100 Gy, such an absorbed dose distribution would lead to treatment failure because the tumor half not exposed to radiation would regrow. In this case, the equivalent absorbed dose delivered uniformly throughout the tumor volume (i.e., the EUD) would be close to zero in order to be consistent with the expected biologic effect of the dose distribution described above.
Although we have applied the EUD model to the lungs, EUD is not a valid measure of normal-organ toxicity because normal organs have a structural organization. Two hundred grays to even a small portion of the spine can lead to paralysis; in contrast, 200 Gy to a large portion of the liver might be inconsequential because the liver can regenerate. Normal-organ EUD should not be related to the potential normal-organ toxicity; rather, the difference between EUD and mean absorbed dose over a normal-organ volume should be seen as reflecting the spatial absorbed dose distribution within a normal organ.
The importance of BED has recently been highlighted by the use of engineered, lower-molecular-weight targeting agents (peptides and single-chain constructs) and by multistep targeting approaches (34–36). The targeting and excretion kinetics of these agents differ substantially, and as suggested by preclinical and clinical evidence (19,37,38), the dose rate is an important parameter in understanding normal-organ toxicity and tumor response. The BED model has also been used in combination with external-beam radiotherapy or radionuclide therapy studies (39).
Calculation of EUD and BED requires knowledge of the radiosensitivity and repair kinetic parameters. In the calculations presented in this work, a single set of thyroid cancer–specific or normal lung–specific parameter values was applied to all tumor- or normal lung–associated voxels, respectively. The assumption was made that all elements of the tumor were clonogenic. As is well recognized, radiosensitivity is likely to vary in different tumor regions (e.g., hypoxic vs. normoxic). The clonogenicity and DNA damage repair rate will also vary throughout the tumor (i.e., dormant vs. rapidly proliferating regions). Nevertheless, BED and EUD are still potentially useful in comparing different tumor absorbed dose distributions in a patient population. In the case of normal organs, the same concerns apply, especially regarding radiosensitivity and repair rate. In both cases, use of the voxel-by-voxel implementation demonstrated in this work would enable subdivision of a particular organ or tumor region if radiobiologic parameters were available for the organ or tumor subregions. For example, using 18F-misonidazole PET, one could identify hypoxic tumor regions that might be radioresistant (40).
CONCLUSION
Radiobiologic modeling has been implemented in a patient-specific imaging-based dosimetry software package, 3D-RD. The software package was used to demonstrate the implications of accounting for the absorbed dose rate and uniformity to thyroid tumor and to normal lung tissue. In addition, the package was used on a clinical case to demonstrate application of the methodology.
Acknowledgments
This work was supported by grant R01 CA116477 from the NIH NCI and by grant DE-FG02-05ER63967 from the DOE. We acknowledge and thank Katherine Kolbert for discussions related to this work and for her assistance with the MIAU software.
Footnotes
-
COPYRIGHT © 2007 by the Society of Nuclear Medicine, Inc.
References
- Received for publication November 11, 2006.
- Accepted for publication March 7, 2007.


Jump to section
Related Articles
Cited By...
- Dosimetry for Radiopharmaceutical Therapy: Current Practices and Commercial Resources
- Tumor Response to Radiopharmaceutical Therapies: The Knowns and the Unknowns
- PARaDIM: A PHITS-Based Monte Carlo Tool for Internal Dosimetry with Tetrahedral Mesh Computational Phantoms
- Three-Dimensional Dosimetry for Radiation Safety Estimates from Intrathecal Administration
- Recombinant Human Thyroid-Stimulating Hormone Versus Thyroid Hormone Withdrawal in 124I PET/CT-Based Dosimetry for 131I Therapy of Metastatic Differentiated Thyroid Cancer
- Radioiodine Scintigraphy with SPECT/CT: An Important Diagnostic Tool for Thyroid Cancer Staging and Risk Stratification
- Targeted Radionuclide Therapy: Proceedings of a Joint Workshop Hosted by the National Cancer Institute and the Society of Nuclear Medicine and Molecular Imaging
- Study of the Impact of Tissue Density Heterogeneities on 3-Dimensional Abdominal Dosimetry: Comparison Between Dose Kernel Convolution and Direct Monte Carlo Methods
- Radioiodine Scintigraphy with SPECT/CT: An Important Diagnostic Tool for Thyroid Cancer Staging and Risk Stratification
- Tumor Dosimetry and Response for 153Sm-Ethylenediamine Tetramethylene Phosphonic Acid Therapy of High-Risk Osteosarcoma
- Dosimetry and thyroid cancer: the individual dosage of radioiodine
- Methodology to Incorporate Biologically Effective Dose and Equivalent Uniform Dose in Patient-Specific 3-Dimensional Dosimetry for Non-Hodgkin Lymphoma Patients Targeted with 131I-Tositumomab Therapy
- The Monte Carlo Method in Nuclear Medicine: Current Uses and Future Potential
- Arterial Wall Dosimetry for Non-Hodgkin Lymphoma Patients Treated with Radioimmunotherapy
- Hybrid SPECT/CT: the end of "unclear" medicine
- 124I PET-Based 3D-RD Dosimetry for a Pediatric Thyroid Cancer Patient: Real-Time Treatment Planning and Methodologic Comparison
- SPECT/CT