


Abstract
A 3-dimensional (3D) imaging–based patient-specific dosimetry methodology incorporating antitumor biologic effects using biologically effective dose (BED) and equivalent uniform dose (EUD) was developed in this study. The methodology was applied to the dosimetry analysis of 6 non-Hodgkin lymphoma patients with a total of 10 tumors. Methods: Six registered SPECT/CT scans were obtained for each patient treated with 131I-labeled antibody. Three scans were obtained after tracer administration and 3 after therapy administration. The SPECT/CT scans were used to generate 3D images of cumulated activity. The cumulated activity images and corresponding CT scans were used as input to Monte Carlo dose-rate calculations. The dose-rate distributions were integrated over time to obtain 3D absorbed dose distributions. The time-dependent 3D cumulative dose distributions were used to generate 3D BED distributions. Techniques to incorporate the effect of unlabeled antibody (cold protein) in the BED analysis were explored. Finally, BED distributions were used to estimate an EUD for each tumor volume. Model parameters were determined from optimal fits to tumor regression data. The efficiency of dose delivery to tumors—the ratio of EUD to cumulative dose—was extracted for each tumor and correlated with patient response parameters. Results: The model developed in this study was validated for dosimetry of non-Hodgkin lymphoma patients treated with 131I-labeled antibody. Correlations between therapy efficiency generated from the model and tumor response were observed using averaged model parameters. Model parameter determination favored a threshold for the cold effect and typical magnitude for tumor radiosensitivity parameters. Conclusion: The inclusion of radiobiologic effects in the dosimetry modeling of internal emitter therapy provides a powerful platform to investigate correlations of patient outcome with planned therapy.
Accurate dose calculations are important for the continued development of radioimmunotherapy and other targeted therapies (1,2). Tositumomab and 131I-tositumomab anti-CD20 radioimmunotherapy (Bexxar) have successfully treated relapsed or refractory B-cell non-Hodgkin lymphoma (NHL) (3,4). Although the therapeutic effect of the antibody alone (cold protein effect) is significant, clinical trials have shown a consistent advantage to combining radionuclide and cold protein therapy (5).
The demonstration of a correlation between tumor absorbed dose and response in patients with low-grade NHL has been marginal at best (6,7). Challenges include a series of potentially confounding factors, including pretreatment status, location of gross tumor volumes, nonuniformity of tumor uptake (and associated absorbed dose), diverse disease presentation, and variable cold protein effect. Individualized treatment planning including dosimetric implications of tumor volume changes (e.g., tumor shrinkage) may be able to account for some of these confounding factors. The application of biologically effective dose (BED) and equivalent uniform dose (EUD) concepts to NHL patient dosimetry may provide an improved platform for interpretation of equivalent dose versus patient response.
The biologic effect of delivered dose was chosen to be described by the equivalent uniform dose EUD formalism (8) as a framework to incorporate many effects into 1 effective evaluation parameter. The use of the EUD in this application equates biologic effect to the surviving clonogen population for a linear absorbed dose response (9–11). The definition of EUD here varies from that defined by Niemierko (8) in that the reference dose response is the linear low-dose-rate response, rather than the dose response at 2 Gy per fraction chosen for external-beam therapy.
The estimation of absorbed dose has been challenging for several reasons. Antibody uptake nonuniformity and associated absorbed dose nonuniformity significantly affect the absorbed dose estimates. Another factor is that the time of tumor shrinkage is comparable to the time of maximal uptake and radioactive decay half-life, affecting the dose estimates because of volume changes during dose delivery. Recent studies have used 3-dimensional (3D) dose calculations based on improved imaging for dose estimation in radioimmunotherapy (6,12). Changes in target mass during therapy can significantly affect the estimated dose. Tumor volume growth and its effect on dose have been incorporated in dosimetric models (10,11,13). Others have mathematically incorporated mass changes in dosimetric calculations for thyroid therapy (14), fractionated radioimmunotherapy of lymphoma (15), and nodal regression in NHL (16).
The efficacy of targeted radionuclide therapy is dependent on the uniformity of the radionuclide uptake distribution within the target volume, radiosensitivity of the tissues, and biologic effects in the assessment of tumor–dose response (17). The therapeutic effect of tositumomab (cold protein) for the treatment of NHL is well established (5). Tositumomab is also known to have a variable effect on tumors. Teasing out a correlation between magnitude of absorbed dose and durability of response using a group study can be challenging in the presence of potentially large confounding factors, such as the cold protein effect. To help account for this factor, the cold protein effect can be incorporated into the dosimetric model.
A 3D imaging–based patient-specific dosimetry methodology that includes biologic effects is used to illustrate the concepts of BED and EUD in internal emitter dosimetry. The EUD approach is being applied to individualized dose calculations to help correlate an equivalent dose with objective patient outcome. Data collected detailing the distribution of uptake and initial tumor response are used to separate the cold protein and absorbed dose effects. The current model assumes no synergistic or destructive interaction between the 2 therapeutic effects. Our purpose was to illustrate methods to perform EUD calculations for NHL patient dosimetry.
MATERIALS AND METHODS
Drug Administration
Six patients with refractory follicular NHL undergoing 131I radioimmunotherapy in The Nuclear Medicine Clinic at the University of Michigan volunteered for this pilot study. Patients gave their written informed consent for all SPECT/CT scans, which were not part of the normal 131I-tositumomab protocol. This supplemental imaging protocol received approval from the University of Michigan Internal Review Board. The clinical protocol for drug administration consisted of 2 steps (3). In step 1 (tracer administration), patients received an infusion of 450 mg of unlabeled (cold) tositumomab, followed by an infusion of 35 mg of tositumomab labeled with 185 MBq (5 mCi) of 131I. In step 2 (therapy administration), 7–8 d after tracer administration, patients received another infusion of 450 mg of unlabeled tositumomab, followed by an infusion of 35 mg of tositumomab labeled with 2,849–5,661 MBq (77–153 mCi) of 131I. The labeled activity was calculated on the basis of posttracer planar imaging to deliver a nominal whole-body absorbed dose of 75 cGy.
Patient Imaging
A series of registered 3D SPECT/CT images were acquired on a Siemens Symbia TruePoint scanner with 6-slice CT capability. Imaging was sequential, with the low-dose CT performed immediately after each SPECT scan. Three SPECT/CT image sets were obtained within 6 d after the tracer administration, between 2 and 150 h on average. Three more (typical) SPECT/CT image sets were obtained within 10 d after therapy administration, between 50 and 190 h, on average. Further details of reconstructions, activity quantification, and registrations of CT and respective SPECT images are presented elsewhere (18). Tumors were outlined on CT images at each time point by a nuclear medicine specialist with radiology CT training. An example of a tumor outlined on a CT image and its corresponding SPECT activity distribution is illustrated in Figure 1.
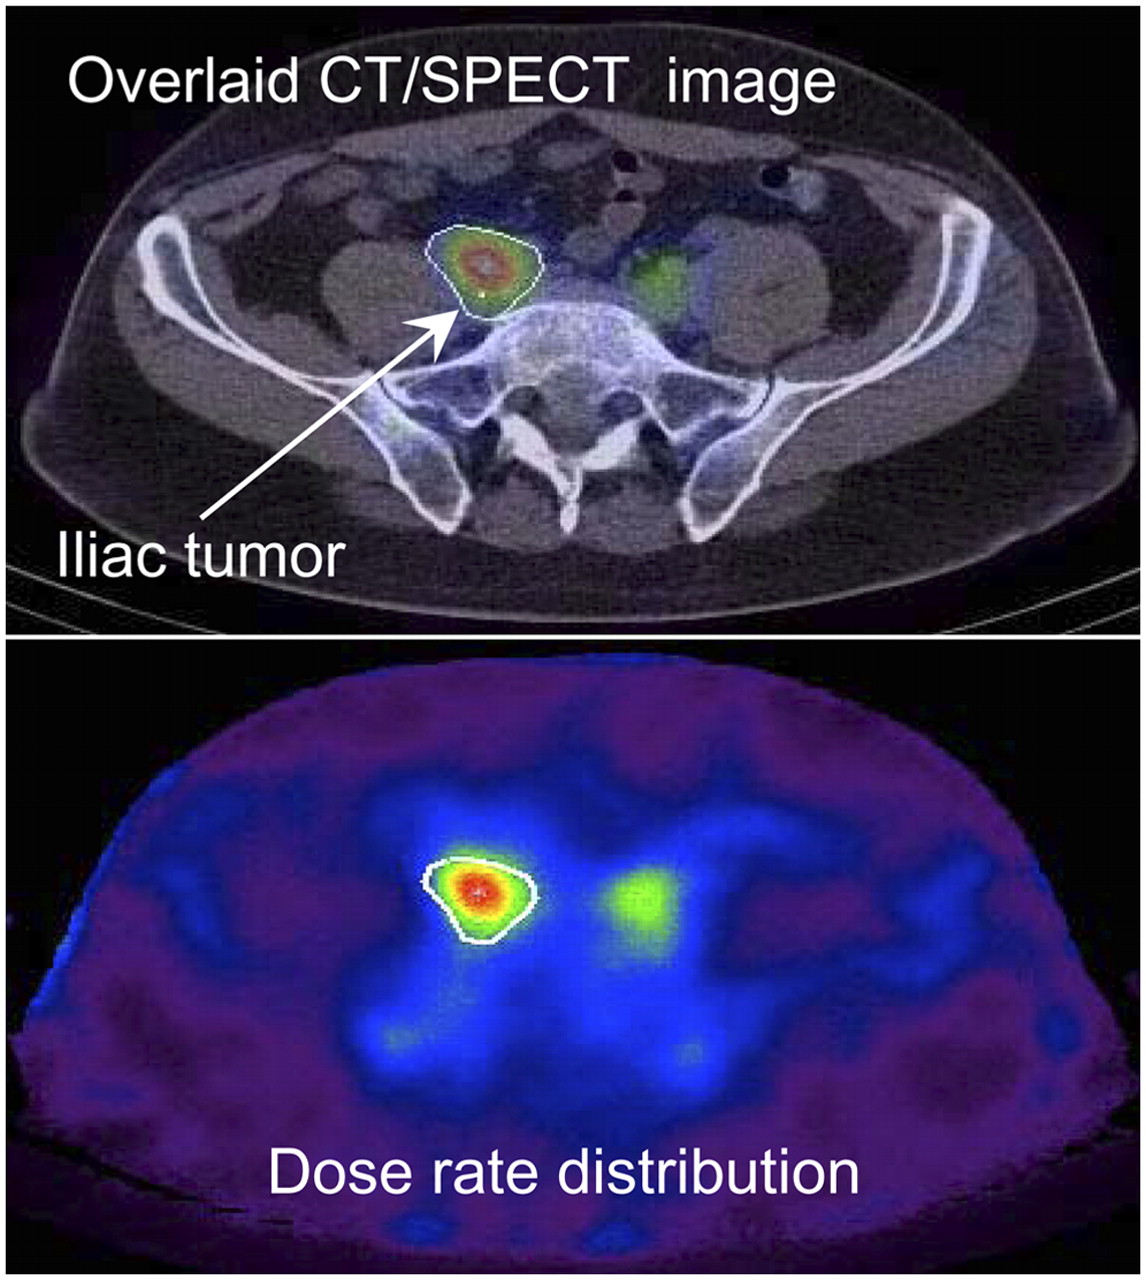
Fused SPECT/CT images (top) and matching Monte Carlo–generated dose-rate distribution (bottom). Tumor contours were outlined on CT images. 3D dose-rate calculations assumed that SPECT distributions represented radioactive source distributions.
3D Time-Dependent Dose-Rate Distributions
The CT and corresponding SPECT data were used as input to the dose-planning-method Monte Carlo code (19) to calculate the 3D tumor dose-rate distributions at 6 time points, 3 time points after tracer administration and 3 after therapy administration. An example of a dose-rate distribution calculated by the Monte Carlo code is shown in Figure 1. Time–activity curves were obtained by fitting double exponential functions to the measured cumulative activity data for the whole body and tumor. Separate fits were performed for tracer and therapy data. The cumulative tumor dose was calculated from the tumor self-dose and rest-of-body dose components.
The methodology developed in this study requires that the history of a given voxel in the tumor volume be tracked in time. Deformable registration used volume center-of-mass alignment and radial deformation of the tumor volumes. For the later scans, the tumor volumes were mapped onto the tumor volume of the first scan. This procedure retained the integrity of the number of voxels by altering the mass of each voxel by a constant value for subsequent time points. The time-dependent dose rates for each voxel were obtained from the calculated voxel dose rates and tumor time–activity curve. All voxels were assumed to have the same uptake signature. This procedure guaranteed a dose-rate history for each voxel (assumed to be a collection of clonogenic tumor cells) that summed to the correct dose rates for the total tumor volume. The 3D time-dependent dose rates were integrated to obtain 3D time-dependent (i.e., 4D) dose distributions.
Methodology for Incorporating Biologic Effects in Patient Dosimetry
The EUD was defined as the uniform dose that would lead to the same level of cell inactivation as a nonuniform, biologically active dose distribution and ignoring proliferation effects (i.e., simple linear cell inactivation). The BED was assumed to have 3 terms: the 3D cumulative dose, cell proliferation, and 3D therapeutic cold effect. The distribution of the cold antibody was calculated from the measured activity distributions. The therapeutic action of the cold antibody was assumed to be proportional to the amount of time that the cold antibody stayed in contact with the targeted cell.
Typical values were used for cell repair rate and the ratio of linear-quadratic (α/β) parameters. Time to recurrence for progression-free survival (∼12 mo) (3) was used to set the effective cell doubling time ( ). Model parameters for radiation sensitivity (α) and cold antibody sensitivity (
 ) were fit to the observed changes in tumor volumes for both tracer and therapy periods. Tumor volumes (shrinkage) were determined from contoured tumor structures over the time of the SPECT/CT research study, approximately 16 d after tracer administration. The fractional cell survival, S, was related to tumor volume changes using a cell inactivation delay of 1.5 d and a linear cell clearance coefficient representing a half-time of clearance of 3 d.
A further description of the model is provided in the Appendix.
RESULTS
EUD model performance is illustrated using patient-specific 3D dosimetry performed for 6 NHL patients with a total of 10 tumors treated with 131I-labeled tositumomab. Tumors analyzed in this study vary in initial volume, cumulative dose, and response to labeled and unlabeled antibody, as is summarized in Table 1 and Figure 2.
Initial Tumor Volume, Cumulative Dose, and EUD Values for 10 Tumors in 6 Patients
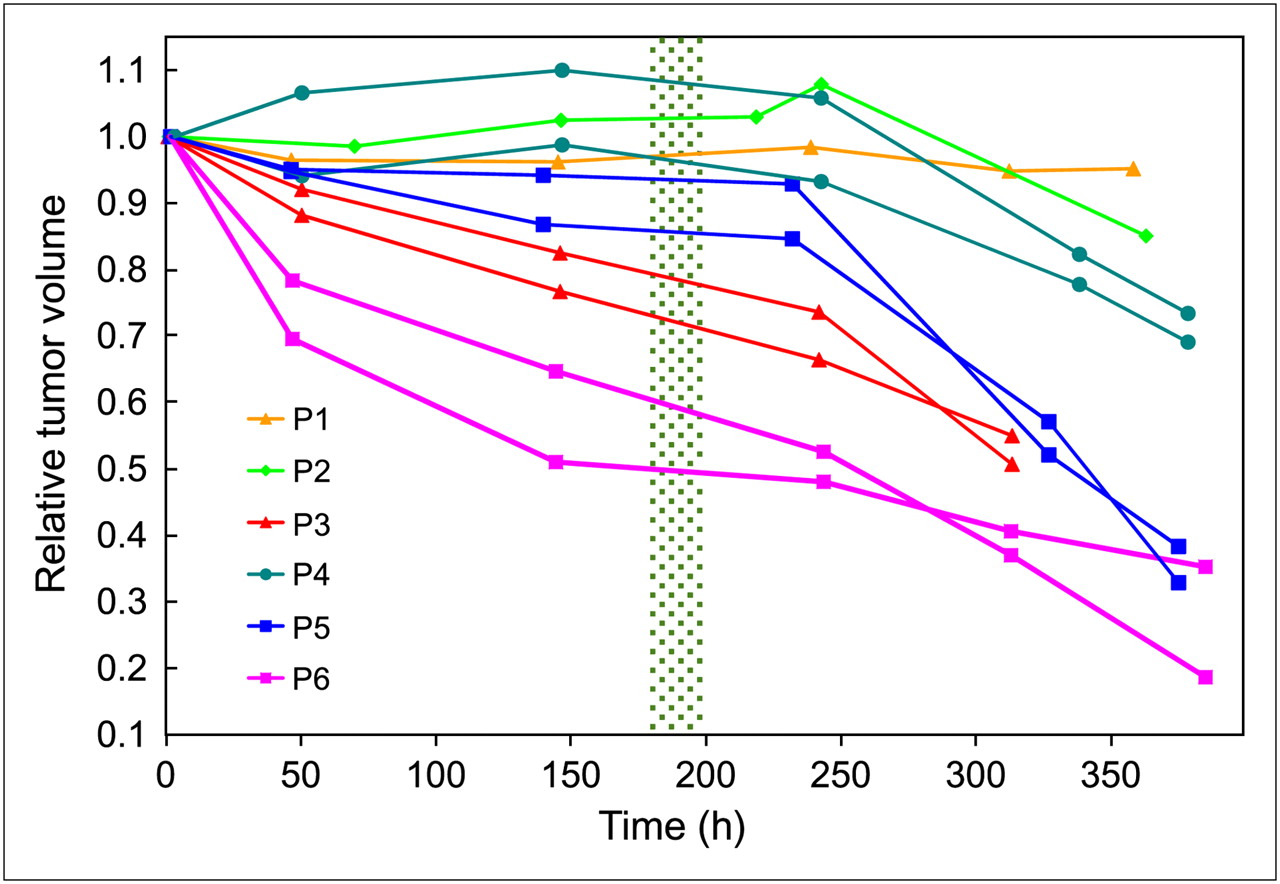
Tumor volume response to tracer and therapy administrations. Plotted are ratios of tumor volumes to volume from first (tracer) scan. First 3 time points are from tracer studies, and last 2 or 3 are from therapy studies. Therapy administration time was approximately 200 h after tracer injection (within highlighted region for all patients). Symbol and color are used for each patient. Tumor response to cold effects and radiation varied widely. Solid lines are drawn to guide the eyes.
Cumulative Dose, Initial Tumor Volume, and Tumor Response
Cumulative tumor doses are summarized in Table 1. Doses ranged from 1.7 to 4.2 Gy, with an average dose of 3.1 Gy. Figure 3A illustrates a significant correlation (P < 0.001) between fractional tumor shrinkage and initial tumor volume, showing a tendency of greater tumor shrinkage experienced by tumors with smaller initial volumes. There was a marginally significant (P = 0.03) increase in tumor shrinkage with higher cumulative dose (Fig. 3B).
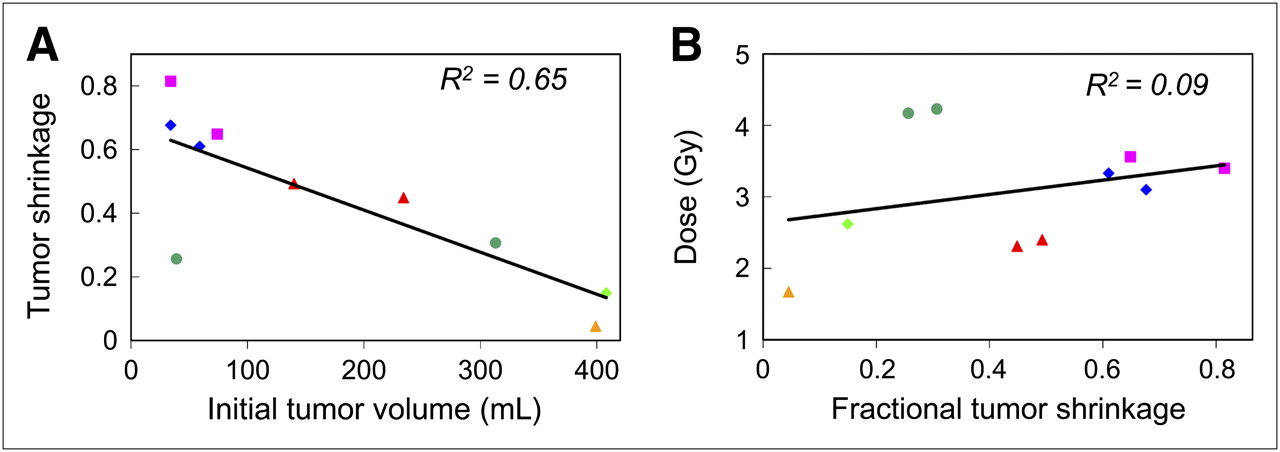
Fractional tumor shrinkage vs. initial tumor volume (A) and cumulative tumor dose (B). Plotted lines and R2 values are from linear least square fits to data points. Slope values are significantly different from zero (P < 0.001) in A and marginally different (P = 0.03) in B. Data points are color-coded as in Figure 2.
BED and EUD Analysis
Response to the unlabeled antibody varied widely between patients. Some patients showed no response, and others showed significant tumor shrinkage, primarily because of the cold protein effect (Fig. 2). If the patient was responsive to cold protein, all tumors in that patient were responsive, and vice versa. 3D time-dependent BED distributions and EUD values were calculated for all tumors using averaged parameter values derived from model fits to the tumor shrinkage data.
Averages for patients showing cold effect (P1, P2, and P4) were obtained separately from those for patients not showing cold effect (P3, P5, and P6). Average parameters were α = 0.22 Gy−1 and  for no cold effect and
  Gy−1 and
  mgp-h/gT (milligram of protein times hour per gram of tumor) for cold effect. Examples of surviving-fraction-volume histograms and dose-volume histograms generated from the EUD model at multiple times after therapy administration are plotted in Figure 4. The cumulative dose distributions and the surviving fractions become less uniform with time. Derived EUD values ranged from 1.1 to 6 Gy, with an average of 3.7 Gy (Table 1). EUD values greater than cumulative dose values are due to the therapeutic contribution of the cold effect.
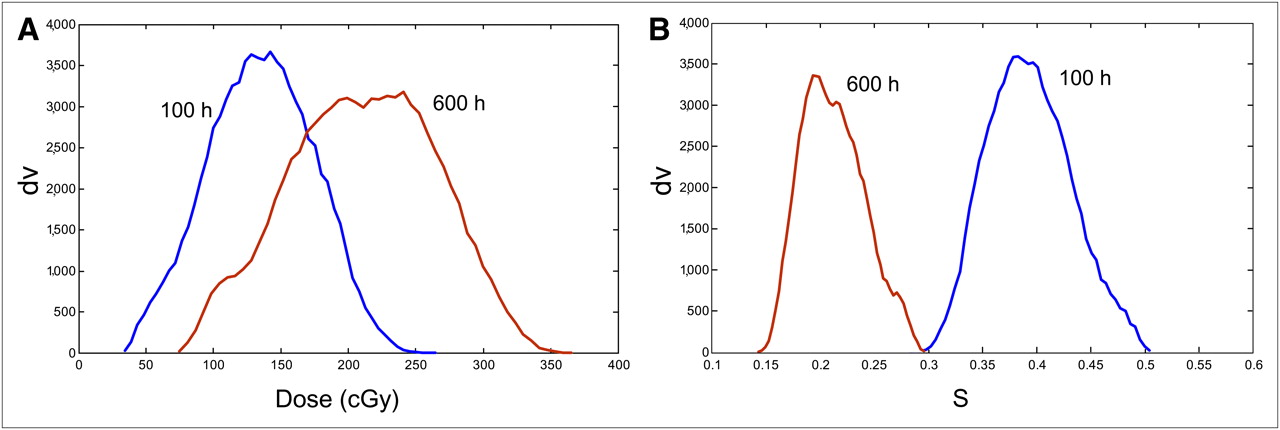
Example dose–volume histograms (A) and survival–volume histograms (B) at 2 time points. Higher dose levels imply lower survival. Histogram width over mean increases with time (more nonuniform).
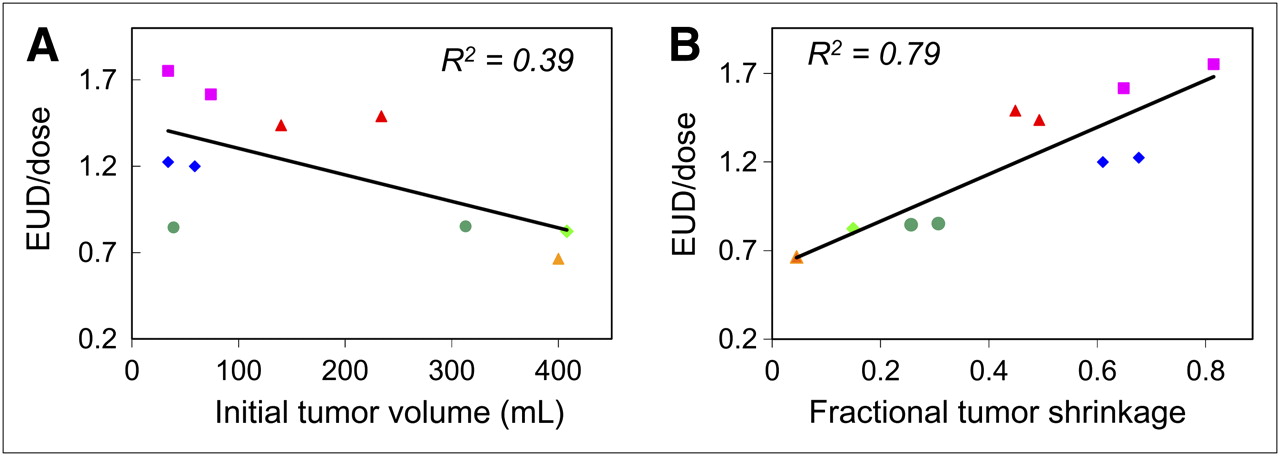
Treatment efficiency was defined as the ratio of the EUD value to the cumulative dose. Efficiency values smaller than unity are for tumors with no cold protein response—those EUD values that are reduced by dose nonuniformity and cell proliferation. Efficiency values larger than unity are for tumors that responded to cold protein—the cold protein effect is larger than the cell proliferation effect. There is a trend toward higher treatment efficiency in smaller tumors (Fig. 5A, R2 = 0.39, P < 0.001). Such correlations are not surprising, because small tumors would tend to be more homogeneous in structure. A strong correlation between treatment efficiency and tumor shrinkage (Fig. 5B, R2 = 0.79, P < 0.001) is a validation of the model fit to the data. A stronger response to therapy results in a greater model efficiency score. EUD values also correlate with tumor shrinkage (R2 = 0.77).
DISCUSSION
Others have used radiobiologically effective dosimetric modeling. Bodey et al. (20) used BED to relate the dose effect between targeted radionuclide therapy and external-beam therapy. The protracted time of dose delivery was interpreted as time for repair within the linear-quadratic model, without explicitly accounting for proliferative changes. If the time for delivery of external- and radioactive decay therapy was equivalent, there would be a canceling of proliferative effects in an isoeffect analysis. In contrast, Kalogianni et al. (21) and Prideaux et al. (1) used BED and EUD models to describe the dose effects of heterogeneous radioactive distributions. The time factor was confined to the linear-quadratic model through the time dependence of the uptake curve or effective clearance time for the radioactive material, allowing time for cell repair. Calculated EUD values would be isoeffective if spread over the same interval.
In an analysis to assess tumor–dose response for NHL patients treated with 131I-labeled tositumomab, Sgouros et al. (6) reported no significant dose-response relationship for tumors. The absence of response correlations could be attributed in part to target–dose heterogeneity in both space and time. Tumor response to unlabeled antibodies, variable radiosensitivity, proliferation, clearance rates, and previous treatment could also be confounding factors contributing to the lack of strong correlation between absorbed dose and tumor response. Here, the inclusion of the effects of unlabeled antibodies (cold effect), proliferation, and clearance within the model was an attempt to be inclusive of as many of the confounding factors as possible. Because the absorbed dose delivery is in conjunction with the cold antibody, both antitumor agents are present at the same time and could interact either synergistically, independently, or mutually destructively.
The dosimetric impact of tumor volume reduction during targeted radiotherapy has been a well-described topic: in theory (22), in animals (11,23), and in patients (15). The effects can be significant, but the limitations on the amount of patient data that can be reasonably collected dictates that the effects are estimated from a few data points. The current dosimetric calculations include these effects explicitly for the dose rates at the time of patient scanning. The interpolation between scan times and extrapolation to future times is done through the average antibody uptake curves. Improved estimates of this effect will follow improved estimates of the interpolation and extrapolation of the collected data through improved deformable registration between time points.
There are many challenges to the use of this model, resulting in nonquantifiable errors. Variations in the fit results can easily be attributed to ascribing observed changes incorrectly. For example, a declining tumor volume may be due to resolving swelling rather than clearance of obliterated tumor cells. Abrupt volume changes are suspect, a hint that non–cell-inactivation effects may be in play. One protection against this is to use an averaging of tumor volume reduction per patient rather than per tumor, as appears to be justified by the data. Another tool is to categorize tumor volume types. Tumors may behave differently based on the body environment (e.g., location).
The small sample of patient data used to illustrate the model showed interesting characteristics. The correlations of tumor response with cumulative dose (Fig. 3B) were marginal, in contrast to a strong correlation with treatment efficiency (Fig. 5B). This result is interpreted as a success of the model fit using averaged fit parameters. The correlation of EUD with tumor response was not as apparent, being diluted by the noncorrelative cumulative dose. It may be counterintuitive that the inclusion of cumulative dose would degrade the correlation but may be primarily an effect of the inclusion of the differential tumor response to cold protein. If the response to cold protein was exactly proportional to the response to cumulative dose, then a strong correlation with dose would be more favored.

Treatment efficiency (EUD/dose) vs. initial tumor volume (A) and tumor shrinkage (B). Plotted lines and R2 values are from linear least square fits to data points. Slope values are significantly different from zero (P < 0.001 for A and B). Data points are color-coded as in Figure 2.
CONCLUSION
A methodology to implement biologic modeling in patient-specific imaging-based 3D dosimetry of internal emitters has been developed using an in-house MATLAB-based software package (The MathWorks) and Monte Carlo 3D dose-rate calculations. Dosimetry analyses of 6 NHL patients were performed using this methodology to demonstrate its potential validity. The application of this model has yielded some insight to the data on a preliminary limited dataset. The inclusion of biologic effects in the dosimetry of internal emitters provides a powerful platform to investigate correlations of patient outcome with planned therapy.
APPENDIX
BED and EUD Model Description
The EUD formalism was used to incorporate biologic effects. The EUD leads to the same level of cell inactivation as a nonuniform or biologically active dose distribution: where
where  , and
, and  is the minimum volume-averaged (clonogen) tumor cell survival. A BED for each voxel was calculated using
 where
where  is the 3D cumulative dose delivered over time,
  is the relative effectiveness,
  is the proliferation constant (
 where
where  is the effective doubling time),
  is the cold protein constant (
 , where
  is the half-time of cell inactivation by the antigen-bound antibody molecule), and
  is the 3D cold protein distribution per unit mass.
  was calculated from the decay-corrected activity distribution:
 where
where  is the injected cold protein.
  is the fractional 3D time activity distribution,
  is the tumor mass, and the exponential factor corrects for radioactive decay with decay constant γ. This methodology is incorporated into an in-house MATLAB-based software package.
For human cells, the characteristic repair half-time ranges from a few minutes to several hours. An appropriate value of the repair constant, μ, for normal tissues is 0.46 h−1, corresponding to a repair half-time of 1.5 h (24). The α-to-β ratio for tumor is approximately 10 Gy (25). The RE factor differs from unity by less than 1% and was set to unity. The time-dependent 3D formulation for the RE factor appropriate for this model is given by Millar (26).
Acknowledgments
We thank Drs. Anca Avram and Mark Kaminski for providing the data used for EUD model development. This work was supported by NIH 2R01 EB001994.
Footnotes
-
COPYRIGHT © 2010 by the Society of Nuclear Medicine, Inc.
References
- Received for publication August 11, 2009.
- Accepted for publication December 21, 2009.


Jump to section
Related Articles
Cited By...
- Dosimetry in Radiopharmaceutical Therapy
- Dosimetry for Radiopharmaceutical Therapy: Current Practices and Commercial Resources
- Tumor Response to Radiopharmaceutical Therapies: The Knowns and the Unknowns
- 131I-Tositumomab Radioimmunotherapy: Initial Tumor Dose-Response Results Using 3-Dimensional Dosimetry Including Radiobiologic Modeling