


Abstract
N-(5-Fluoro-2-phenoxyphenyl)-N-(2-18F-fluoroethyl-5-methoxybenzyl)acetamide (18F-FEDAA1106) is a potential PET ligand with highly selective and specific binding to peripheral benzodiazepine receptor (PBR). It has been reported that the regional density of PBR in the brain is increased in several neurodegenerative and psychiatric disorders. Thus, a reliable tracer method for evaluating PBR would be of use clinically and for research. To our knowledge, this is the first study to investigate the 18F-FEDAA1106 binding to PBR in living human brain by PET. We also aimed to evaluate various analytic methods to quantify the density of PBR. Methods: PET studies with 18F-FEDAA1106 were performed on 7 healthy men. Volumes of interest (VOIs) were drawn on PET images. In each VOI, binding potential (BP) was calculated by nonlinear least-squares (NLS) fitting based on the 2-tissue compartment model, and the distribution volume (DV) was also estimated by NLS, Logan plot, and multilinear analysis (MA) methods. To estimate errors in calculation of BP and DV, simulation studies were also performed. Results: The DVs estimated with each of the methods were significantly correlated. There was also significant correlation between BP with NLS and DV with NLS, Logan plot, or MA. But the interindividual differences in the distribution volume of the free and nonspecific binding compartment (K1/k2) were relatively large. In a simulation study, variation of the DV estimated by Logan plot was relatively small, but it was underestimated as the noise increased. By MA, the bias of DV was smaller, but the variation of DV was larger than by Logan plot. Within a 3% noise level, there was almost no difference between Logan plot and MA in both bias and variation. DVs estimated by both Logan plot and MA were underestimated by 10%–20%. Although the variation of DV was larger by NLS than by Logan plot, it was small enough in the noise level of VOI analysis, and the bias of DV was 0%–2%. Conclusion: The simulation studies indicated that NLS is a suitable method for the estimation of 18F-FEDAA1106 binding to PBRs.
Benzodiazepine receptors can be divided into two types—central and peripheral. Peripheral benzodiazepine receptor (PBR) was originally detected on mitochondrial membranes in peripheral organs such as kidney, liver, heart, and lung (1,2). Later studies using ligands specific for PBR, such as 3H-Ro5-4864 and 3H-PK11195, demonstrated its presence in the central nervous system, and its density equaled or even exceeded that of central benzodiazepine receptor in the central nervous system (3,4). In the brain, PBRs mainly localize in glial cells (5). The density of PBR increases in microglia, which are activated by brain damage (6,7).
PET studies with 11C-PK11195 showed the increase in PBR density as an indicator of neuronal damage or loss in several neurodegenerative disorders, such as Alzheimer's disease (8), refractory epilepsy (9), multiple sclerosis (10), glioma (11), and stroke-induced brain injury (12). However, there are some problems with the estimation of PBR by the use of 11C-PK11195—for example, the relatively low specific binding of this ligand.
To measure the binding of 11C-PK11195, some studies performed a semiquantitative analysis of specific binding by normalizing the time–activity of volumes of interest (VOIs) by the radioactivity in the cerebellum (13), whole brain (14), and cortical gray matter (15) as a reference. Other studies performed cluster analysis with a compartment model without arterial blood sampling to evaluate the specific binding potential (BP) using the extraction of voxels with normal ligand kinetics as a reference input function (8,10). However, in 11C-PK11195 studies, the uptake ratio of the ligand into the brain was very low, the ligand was excreted from the brain soon after injection, and the signal-to-noise ratio in the brain was not high; it was concluded that 11C-PK11195 was not suitable for stable quantitative analysis.
N-(5-Fluoro-2-phenoxyphenyl)-N-(2-18F-fluoroethyl-5-methoxybenzyl)acetamide (18F-FEDAA1106) is a potential PET ligand with a highly selective and specific binding to PBR. The synthesis of 18F-FEDAA1106 and its high specific binding in the rat brain, especially in the olfactory bulb, have been reported (16). The 18F-FEDAA1106 uptake ratio into the brain was about 6 times higher than that of 11C-PK11195 and 1.5 times higher than that of 11C-DAA1106 in the monkey occipital cortex (17,18). In the present study, we performed a kinetic analysis for the quantification of 18F-FEDAA1106 distribution and binding in the human brain.
MATERIALS AND METHODS
Subjects
Seven healthy male volunteers (age, 20–31 y; mean age ± SD, 23.1 ± 4.0 y) participated in this study. All volunteers were free of any somatic, neurologic, or psychiatric disorders, and they had no history of current or previous drug abuse. This study was approved by the ethics and radiation safety committees of the National Institute of Radiologic Sciences, Chiba, Japan. Written informed consent was obtained from each subject.
Radioligands
DAA1106 (19) and DAA1123 (16) (N-(5-fluoro-2-phenoxyphenyl)-N-(2-hydroxy-5-methoxybenzyl)acetamide) as desmethyl precursors were kindly donated by Taisho Pharmaceutical Co. 2-18F-Fluoroethyl bromide for radiosynthesis was prepared by the reaction of 18F-F− with 2-bromoethyl triflate using a newly developed automated system (16). 18F-FCH2CH2Br was purified by distillation and trapped in a solution of N,N-dimethylformanide (DMF) containing DAA1123 (1 mg) and NaH (6–8 μL, 0.5 g/20 mL DMF) at −15°C. After the radioactive reagent trapping ended, fluoroethylation required a further 10 min at 130°C. After adding CH3CN/H2O (6:4, 500 μL), the radioactive mixture was applied to a semipreparative high-performance liquid chromatography (HPLC) column (16). The radioactive fraction corresponding to 18F-FEDAA1106 was collected in a sterile flask. Radiochemical purity was >95% and specific radioactivities were 12–120 (mean ± SD, 54 ± 32) GBq/μmol at the time of injection. 18F-FEDAA1106 was injected intravenously at a dose of 176–190 MBq (mean ± SD, 183.0 ± 5.04).
PET and MRI Study
PET was performed using an ECAT EXACT HR+system (CTI-Siemens) in 3-dimensional (3D) mode, providing 63 planes and a 15.5-cm field of view. To minimize head movement during the brain scans, a head fixation device with an individual mouthpiece was used (Fixster Instruments). A 10-min transmission scan was performed with a 68Ge-68Ga source to correct for attenuation. PET was performed according to the following protocol: 20 s × 9 frames, 60 s × 5 frames, 120 s × 4 frames, 240 s × 11 frames, and 300 s × 12 frames. All emission scans were reconstructed with a Hanning filter cutoff frequency of 0.4 (full-width half-maximum = 7.5 mm). T1-weighted MRI was acquired by an Intera, 1.5-T system (Philips Medical Systems). T1-weighted images of the brain were obtained from all subjects. The scan parameters were 1-mm thick, 3D, T1 images with a transverse plane (repetition time/echo time, 21/9.2; flip angle, 30°; matrix, 256 × 256; field of view, 256 × 256 mm).
Arterial Blood Sampling and Metabolite Analysis
A catheter was kept in the radial artery during the PET scan. To obtain arterial input function, an automated blood sampling system was used during the first 12 min of each PET measurement. The concentration of radioactivity in arterial blood was measured every second. The time difference between the appearance of radioactivity in the brain and automated blood sampling was experimentally defined and considered in the calculation.
At the same time, arterial blood samples were taken manually from the open end of the catheter 40 times during the scan. Each blood sample was separated into plasma and blood cell fractions by centrifugation, and the concentrations of radioactivity in whole blood and in plasma were measured.
Arterial blood samples were also taken 11 times after injection to measure the ratio of the unchanged ligand to the whole radioactive substances in plasma. To each plasma sample, acetonitrile was added and then centrifuged. The obtained supernatant was subjected to radio-HPLC analysis (μBondapak C18 column; mobile phase, 65:35 acetonitrile/distilled water; Waters Corp.) to measure the ratio of the unmetabolized ligand to the whole radioactive agents. The plasma time–activity curve was corrected by the percentile amount of unchanged ligand in plasma.
Data Analysis
The MR images were coregistered to PET images using SPM99 (Wellcome Department of Cognitive Neurology). VOIs were defined over the dorsolateral prefrontal cortex, medial prefrontal cortex, temporal cortex, medial temporal cortex, parietal cortex, occipital cortex, anterior cingulate, posterior cingulate, striatum, thalamus, and cerebellum with a template-based method (20). The striatum and thalamus were refined manually by using coregistered images. Regional radioactivity of each brain region was obtained from these VOIs. Analysis of human data was implemented using MATLAB (The MathWorks) and PMOD (PMOD Technologies).
Theory
Compartment Models.
The compartment model for 18F-FEDAA1106 kinetic analysis is shown in Figure 1. K1 is the rate constant for transfer from plasma to the free and nonspecific binding compartment Cf, k2 is the rate constant for transfer from Cf to plasma, and k3 and k4 represent the binding and dissociation of the radioligand at the PBR site, respectively. The total distribution volume (DV) is represented by K1/k2(1 + k3/k4), and BP is defined as k3/k4 (21).

Kinetic model for 18F-FEDAA1106. Cp = the radioactivity concentration in the metabolite-corrected plasma; Cf = the free and nonspecific binding compartment; Cs = the specific binding compartment; BBB = blood–brain barrier.
Logan Plot Method.
The Logan plot yields total DV by using the plasma input function and time–activity curve information only after reaching equilibrium (22). Total DV is estimated from the following equation: Eq. 1where Cp is the radioactivity concentration in the metabolite-corrected plasma, Ct is the radioactivity concentration in the tissue, and V represents total DV. Because V and b become constants only after equilibration time t*, V and b are estimated as a slope and an intercept, respectively, by using points of T > t* (from 40 to 120 min after injection).
Multilinear Analysis (MA) Method.
Equation 1 can be mathematically rearranged to Equation 2 to reduce the noise-induced bias (23): Eq. 2β1 = −V/b and β2 = 1/b are estimated by linear regression analysis for T > t* (from 40 to 120 min after injection) and V is calculated from –β1/β2.
Simulation Study
Simulated time–activity curves of 18F-FEDAA1106 with several noise levels were generated to investigate the bias and variation of parameter estimation caused by statistical noise for each analysis method. A dynamic tracer concentration for 18F-FEDAA1106 was derived from the rate constant values (k values) given as true values and the measured input function according to the human PET protocol. The true k values used for the simulation were K1 = 0.25, k2 = 0.078, k3 = 0.043, and k4 = 0.0086 as determined from the human data of the dorsolateral prefrontal cortex by the nonlinear least-squares (NLS) method with a 2-tissue compartment model.
The noise ratio for each frame was determined according to the collected total count given by: Eq. 3
Eq. 3 Eq. 4where i is the frame number, Ct is the nondecaying tissue radioactivity concentration derived from the k values and the plasma input function, ti is the midpoint time of the ith frame, Δti is the data collection time, λ is the radioisotope decay constant, and F is a scaling factor representing the sensitivity of the measurement system, introduced here to adjust the noise level. The noise was generated with random numbers based on gaussian distribution and added to the nondecaying tissue activity for each frame. The level of the noise for the dynamic data was expressed as the mean of percent noise described in Equation 3 from 1 to 120 min. In this simulation study, 1,000 noisy datasets were generated for each noise level of 1%, 2%, 3%, 4%, 5%, 7%, and 10%.
In these simulated time–activity curves, each k value was estimated by the NLS method, and the DV value was estimated by the Logan plot and MA methods. For NLS, initial k values varied between ±25% from the true k value, and parameter estimates were considered invalid if K1, k2, k3, and k4 were outside the range 0.0 < k <0.5, or k3/k4 was >3 times the true value. For Logan plot and MA, t* was fixed at 30, 40, 50, or 60 min. For Logan plot and MA methods, parameter estimates were considered invalid if DV was >3 times the true value. The reliability of the estimated parameters was evaluated by the mean and coefficient of variation (COV; SD/mean [%]) of the estimates, and the relationship between the reliability of parameter estimation and noise level was investigated for each analysis method. In the Logan plot and MA methods, the relationship between estimated DV and t* was also investigated with 1%, 3%, 5%, 7%, and 10% noise time–activity curves.
We also investigated the relationship between scan time and the reliability of each parameter for 60, 70, 80, 90, 100, 110, and 120 min using 5,000 simulated time–activity curves with 1%, 2%, 3%, 4%, or 5% noise. The simulations were performed on Dr.View (Asahi Kasei Information Systems Co.).
RESULTS
Human Study
Typical examples of time–activity curves for several regions are shown in Figure 2. Parameters estimated by each method are listed in Table 1. There was not much difference among regions in young healthy volunteers. Although the mean DV values estimated by GA and MA were about 20% smaller than those estimated by NLS in all regions, there were significant correlations between DV estimated by NLS, Logan plot, and MA in each region (Fig. 3). Significant correlation was also observed between BP estimated by NLS and DV estimated by each method in any of the regions (Fig. 4 for dorsolateral prefrontal cortex). In a small region, such as medial temporal and thalamus, DVs are underestimated in comparison with BPs. This may be due to a partial-volume effect caused by limited spatial resolution of the PET scanner. Typical examples of fitting curves by Logan plot and MA are shown in Figure 5. As shown, each curve generated by each method fits to the time–activity curve data very well.
Parameters Estimated by NLS, GA, and MA for Normal Studies (n = 7)

Time–activity curves of dorsolateral prefrontal cortex, occipital cortex, and thalamus for 18F-FEDAA1106. (Inset) Graphs are time–activity curves for first 5 min.

Correlation between DV estimated by NLS and Logan plot (A) and NLS and MA (B).

Correlation between BP and DV estimated by NLS (A), Logan plot (B), and MA (C).
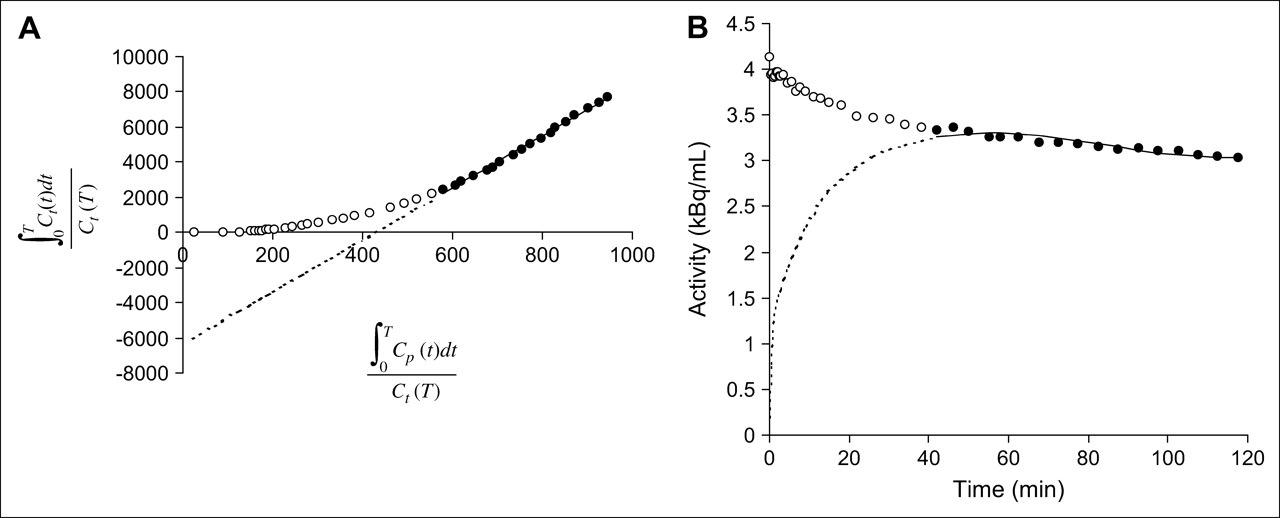
Fitting curve by Logan plot (A) and MA (B). ○, Each data point; •, points after 40 min; bold line, fitting curve.
Simulation Study
Examples of simulated time–activity curves with several noise levels are shown in Figure 6. K1, k2, k3, and k4 were estimated by NLS, and DV was estimated by Logan plot and MA in these simulated time–activity curves.

Time–activity curves with 1%, 5%, and 10% noise. (Inset) Graphs are time–activity curves for first 5 min.
By the NLS method, the biases of DV, BP, and K1/k2 were approximately 0.8%, 0.7%, and 0.2%, respectively, when the noise level was 3%. The variation of estimated DV and BP became larger as the noise increased (Table 2). When the noise level was 3%, the COVs of DV, BP, and K1/k2 were 5.8%, 5.6%, and 5.9%, respectively.
Effect of Various Simulated Noises and Start Time (t*) on BP or DV Estimated by NLS, Logan Plot, and MA
By the Logan plot method, the variation was a little smaller than by the other methods (Table 2). However, DV was underestimated even at a low noise level, and this bias became gradually larger with increasing noise. Bias and COV were affected by the starting point of linear regression, t*. Earlier t* induced a smaller COV and larger bias, whereas later t* induced a larger COV and smaller bias.
By the MA method, DV was also underestimated by about 10%–15%, but the bias did not change much with the noise level (Table 2). COVs of the estimated parameters were a little larger than by Logan plot. Bias and COV were greatly affected by t*. Earlier t* induced a smaller COV and larger bias, whereas later t* induced a larger COV and smaller bias, the same as by the Logan plot method. The variation by the NLS method was larger than by Logan plot or MA. But when the noise level was low, there was little difference in variation in comparison with Logan plot and MA.
In both Logan plot and MA, even though t* was increased from 30 up to 60 min, the estimated DV did not approach the true DV value.
The effect of the scan time on the bias and COV of BP and DV estimated by NLS was also investigated with 5,000 simulated time–activity curves with 1%, 2%, 3%, 4%, or 5% noise. The longer the scan time was, the smaller the bias and COV were (Fig. 7).

Effect of scan time on COV (A) and bias (B).
DISCUSSION
18F-FEDAA1106 Binding in Human Brain
The estimated BP values for the healthy volunteers are listed in Table 1. There was not much difference among regions in young healthy volunteers. It is expected that the BP and DV values of 18F-FEDAA1106 will increase in case of neuronal damage or loss in several neurodegenerative and psychiatric disorders. In 11C-PK11195 PET studies, semiquantification of specific binding was performed by normalizing the time–activity of VOIs by the activity of the cerebellum (13), cortical gray matter (15), and whole brain (14). However, in terms of the semiquantitative approach, the choice of the area used for normalization may affect the sensitivity for detecting changes. Moreover, as the uptake ratio of 11C-PK11195 into the brain is very low and the ligand is excreted soon after the injection, the signal amplitude in the brain is not high.
18F-FEDAA1106 shows a 6-fold higher signal than 11C-PK11195 (17,18) and a stable plasma concentration, so the application of 18F-FEDAA1106 can be expected to provide useful information. Moreover, 18F is convenient for long-time storage, and there may indeed be possibilities of its long-distance transportation to other facilities in the future.
Comparison of Various Analytic Methods for 18F-FEDAA1106
It is difficult to define a region where there are few PBRs because microglia are spread over the whole brain. This indicates that a reference method using a region with rare specific binding cannot be applied for the quantification of PBR. In this study, several quantification methods for receptor binding with arterial input function were applied for 18F-FEDAA1106.
In the simulation study, the COV of the Logan plot method was smaller than that with the other methods. However, the DV was underestimated by at least >10%, and the bias became larger as the noise increased. This bias becomes a problem when comparing the estimated DV among time–activity curves with different noise levels. This bias was partially caused by the noise in the tissue time–activity curve, and several methods for reducing the bias in the Logan plot have been suggested. By smoothing the time–activity curves with the iterative method termed generalized linear least squares, it was possible to reduce the noise-induced bias of the Logan plot (24). Another approach was rearranging Equation 1 of the Logan plot to a multilinear form, and it was demonstrated that this multilinear analysis reduced the noise-induced bias for both the 1-tissue compartment model and the 2-tissue compartment model—that is, the MA method (23). When the noise level was high, the bias of MA became smaller than that of the Logan plot, but, within the noise level of 5%, there was almost no difference between the 2 methods. Equation 2 of MA is multilinear, so the COV of the MA method was larger than that of the Logan plot. However, within the noise level of 5%, there was also almost no difference between these methods.
For tracers with early equilibrium time, enough points for linear regression can be obtained after reaching equilibrium, so either the Logan plot or MA is useful for DV estimation. However, these methods are not appropriate for slow kinetic tracers because sufficient points for linear regression cannot be obtained after equilibrium (23). It is very difficult to determine the optimal t* of the Logan plot or MA because a t* that is too early will cause underestimation, whereas the DV estimated with later t* is greatly affected by noise. In the simulation study, the DVs estimated by Logan plot and MA methods could not approach the true value, indicating that the equilibrium time t* was not early (Table 2). In human data, DVs estimated by Logan plot and MA with t* = 40 min were smaller than that by NLS. These results were consistent with the simulation result, showing that the optimal t* satisfying both the condition of equilibrium and the effect of noise did not exist in the 18F-FEDAA1106 120-min scan. Therefore, Logan plot and MA are not appropriate for the quantification of 18F-FEDAA1106. Another disadvantage of Logan plot and MA is that the only estimated parameter with these methods is DV. In general, k3/k4 and DV are considered to be parallel to each other on the assumption that there is little difference in K1/k2 among the regions and individuals. But because DV is the product of K1/k2 and (1 + k3/k4), the possibility that DV does not directly reflect the receptor density still remains.
The advantage of the NLS method is that every parameter can be estimated, with a disadvantage being that the COV is large in the simulation study (Table 2). But within a noise level of 3%, the variations of DV and BP were sufficiently small. In addition, the COV of DV estimated by the NLS method was smaller than those estimated by Logan plot and MA methods in human data (Table 1). Thus, we concluded that estimation by the NLS method is the most appropriate for the quantitative assessment of PBR with 18F-FEDAA1106.
To improve the reliability of parameter estimation, the ratio of K1/k2 is often used. However, in an 18F-FEDAA1106 study, K1/k2 cannot be constrained because the reference region cannot be determined.
Effect of Scan Time and Noise Level on BP Reliability
Because positron-emitting ligands have a minute-order half-life, the collected count in late life is relatively small. But, as 18F has an advantage over 11C with a longer half-life (110 vs. 20 min), we can extend the duration of the scan time to >90 min. Therefore, the effect of the scan time on the bias and COV of BP and DV as estimated by NLS was investigated on 5,000 simulated time–activity curves with 1%, 2%, 3%, 4%, or 5% noise. The longer the scan time is, the smaller the bias and COV are (Fig. 7). Also, the lower the noise level is, the smaller the bias and COV are. The bias and COV of BP for a 60-min scan with 1% noise were nearly the same as those for a 120-min scan with 5% noise. In summary, the longer the scan time is, the smaller the COV and bias become. A longer scan time is needed for better validity of the parameters. However, for VOIs with a small noise level, the duration of scan time can be shortened by 10–60 min in practice—for example, in case of a patient's inability to remain still for a long time.
CONCLUSION
We have presented three methods for the quantification of 18F-FEDAA1106 binding. In the PBR imaging study, we cannot use a reference method that needs a region with rare specific binding because PBRs are spread throughout the brain. In a 18F-FEDAA1106 study, because the equilibrium time is not fast, optimal t* cannot be defined, and DVs are always underestimated by the Logan plot and MA methods. The COV of DV estimated by the NLS method was smaller than those estimated by the Logan plot and MA in the human data.
Thus, we conclude that estimation of BP and DV by the nonlinear least squares method is the most reliable for the quantitative analysis of 18F-FEDAA1106.
Acknowledgments
This research was supported by the Ministry of Education, Culture, Sports, Science and Technology, Grant-in-Aid for Young Scientists B (16790709, 2004), and the PET project of the National Institute of Radiological Sciences in Chiba, Japan. We are grateful to Takehito Ito for metabolite analysis, to Hinako Toyama and Jun Maeda for their helpful suggestions, and to Taisho Pharmaceutical Co., Ltd., for providing the samples (DAA1106 and precursor) and helpful suggestions.
References
- Received for publication August 26, 2005.
- Accepted for publication October 18, 2005.


Jump to section
Related Articles
Cited By...
- Relative Equilibrium Plot Improves Graphical Analysis and Allows Bias Correction of Standardized Uptake Value Ratio in Quantitative 11C-PiB PET Studies
- Quantitative, Preclinical PET of Translocator Protein Expression in Glioma Using 18F-N-Fluoroacetyl-N-(2,5-Dimethoxybenzyl)-2-Phenoxyaniline
- 18F-FEAC and 18F-FEDAC: PET of the Monkey Brain and Imaging of Translocator Protein (18 kDa) in the Infarcted Rat Brain
- Quantification of Translocator Protein (18 kDa) in the Human Brain with PET and a Novel Radioligand, 18F-PBR06
- Quantitative Analysis of Peripheral Benzodiazepine Receptor in the Human Brain Using PET with 11C-AC-5216
- Imaging of Peripheral Benzodiazepine Receptor Expression as Biomarkers of Detrimental versus Beneficial Glial Responses in Mouse Models of Alzheimer's and Other CNS Pathologies
- DPA-714, a New Translocator Protein-Specific Ligand: Synthesis, Radiofluorination, and Pharmacologic Characterization
- Radiation Dosimetry and Biodistribution in Monkey and Man of 11C-PBR28: A PET Radioligand to Image Inflammation
- 11C-AC-5216: A Novel PET Ligand for Peripheral Benzodiazepine Receptors in the Primate Brain
- 11C-DPA-713: A Novel Peripheral Benzodiazepine Receptor PET Ligand for In Vivo Imaging of Neuroinflammation