


Abstract
Translocator protein (TSPO), also referred to as peripheral benzodiazepine receptor (PBR), is a crucial 18-kDa outer mitochondrial membrane protein involved in numerous cellular functions, including the regulation of cholesterol metabolism, steroidogenesis, and apoptosis. Elevated expression of TSPO in oncology correlates with disease progression and poor survival, suggesting that molecular probes capable of assaying TSPO levels may have potential as cancer imaging biomarkers. In preclinical PET studies, we characterized a high-affinity aryloxyanilide-based TSPO imaging ligand, 18F-N-fluoroacetyl-N-(2,5-dimethoxybenzyl)-2-phenoxyaniline (18F-PBR06), as a candidate probe for the quantitative assessment of TSPO expression in glioma. Methods: Glioma-bearing rats were imaged with 18F-PBR06 in a small-animal PET system. Dynamic images were acquired simultaneously on injection of 18F-PBR06 (70–100 MBq/0.2 mL). Over the course of scanning, arterial blood was collected to derive the input function, with high-performance liquid chromatography radiometabolite analysis performed on selected samples for arterial input function correction. Compartmental modeling of the PET data was performed using the corrected arterial input function. Specific tumor cell binding of PBR06 was evaluated by radioligand displacement of 3H-PK 11195 with PBR06 in vitro and by displacement of 18F-PBR06 with excess PBR06 in vivo. Immediately after imaging, tumor tissue and adjacent healthy brain were harvested for assay of TSPO protein levels by Western blotting and immunohistochemistry. Results: 18F-PBR06 was found to preferentially accumulate in tumors, with modest uptake in the contralateral brain, facilitating excellent contrast between tumor and adjacent tissue. Infusion with PBR06 (10 mg/kg) displaced 18F-PBR06 binding by approximately 75%. The accumulation of 18F-PBR06 in tumor tissues and adjacent brain agreed with the ex vivo assay of TSPO protein levels by Western blotting and quantitative immunohistochemistry. Conclusion: These preclinical studies illustrate that 18F-PBR06 is a promising tracer for visualization of TSPO-expressing tumors. Importantly, the close correlation between 18F-PBR06 uptake and TSPO expression in tumors and normal tissues, coupled with the high degree of displaceable binding from both tumors and the normal brain, represents a significant improvement over other TSPO imaging ligands previously evaluated in glioma. These data suggest the potential of 18F-PBR06 to elucidate the role of TSPO in oncology, as well as its potential development as a cancer imaging biomarker.
Translocator protein (TSPO), also referred to as peripheral benzodiazepine receptor (PBR), is an 18-kDa outer mitochondrial membrane protein that participates in regulation of numerous cellular processes, including cholesterol metabolism, steroid biosynthesis, cellular proliferation, and apoptosis. In normal tissues, TSPO expression tends to be highest in those that produce steroids or are enriched by mitochondria, such as skeletal muscle, renal tissue, and myocardium, whereas tissues such as liver and brain exhibit comparatively modest expression (1). Elevated TSPO expression is found in numerous disease states, which include neuroinflammation and psychiatric disorders, such as Alzheimer and Huntington diseases, as well as cancers of the breast, prostate, colon, and brain (2). Elevated TSPO expression has been linked with disease progression and diminished survival in patients presenting with several types of cancer, including colorectal (3) and brain (2), suggesting its potential importance as a predictive cancer imaging biomarker.
Clinically, two of the most common imaging metrics used to detect and diagnose brain tumors are CT and MRI. These modalities provide little, if any, molecular information attributable to the pathologic status of the disease. Furthermore, numerous studies document the inherent difficulty associated with visualization of the true extent of brain tumor pathology using CT or MRI, particularly with highly infiltrative disease. PET using 18F-FDG is among the most powerful imaging approaches currently available for tumor detection in nearly all organ sites, including the brain. However, high glucose uptake in the normal brain results in modest tumor-to-background ratios, which can confound delineation of disease margins and subsequent grading. An alternative and potentially superior approach to 18F-FDG PET is L-[methyl-11C]methionine (4). Though promising, the half-life of 11C limits the broad implementation of this technique. Therefore, there is a considerable need to develop and validate improved molecular imaging techniques suitable for detection or molecular profiling of brain tumors.
Given its elevated expression and correlation with aggressive tumor phenotypes, cellular proliferation, and glioma grade (5), imaging TSPO expression in brain tumors has been suggested and explored previously (5–10). Almost exclusively, these studies used the well-known TSPO ligand (R)-N-[3H/11C]methyl-N-(1-methylpropyl)-1-(2-chlorophenyl)-isoquinoline-3-carboxamide) (3H/11C-(R)-PK 11195) for either autoradiographic methods or PET. Although these studies established the potential of imaging TSPO in brain tumors, they also highlighted important limitations of PK 11195 as a molecular imaging probe. For example, despite the fact that TSPO expression can be up to 12-fold higher in brain tumors than in the normal brain (5), 11C-(R)-PK 11195 uptake was shown to be relatively modest in tumors, compared with normal brain tissue (≤2:1 tumor–to–normal tissue ratio (7,9)). The high degree of nondisplaceable PK 11195 binding documented in both the normal brain and tumors (9) limits the ability of 11C-(R)-PK 11195 to directly reflect TSPO expression. Importantly, these shortcomings, combined with the modest signal-to-noise ratio and low blood–brain barrier permeability typically observed with 11C-PK 11195 (11), could potentially be overcome by use of improved TSPO imaging ligands.
Recently, novel PET ligands with improved in vivo specificity for TSPO have been reported; presently, however, these compounds are uncharacterized in tumor studies. Among the most promising compounds reported to date are the aryloxyanilides, including 11C-DAA1106 (12) and 18F-FEDAA1106 (13). Another aryloxyanilide, 18F-N-fluoroacetyl-N-(2,5-dimethoxybenzyl)-2-phenoxyaniline (18F-PBR06), has recently demonstrated high affinity and specificity for TSPO across multiple species (14), suggesting the potential suitability of this probe to span preclinical and human studies. The objective of this study was to evaluate 18F-PBR06 as a candidate probe for quantitative assessment of TSPO expression in glioma. Data presented herein suggest that 18F-PBR06 is a promising tracer for visualization of TSPO expression in brain tumors and for quantification of TSPO in tumor tissue. Compared with the previous reports using 11C-(R)-PK 11195 in brain tumor studies, 18F-PBR06 demonstrated superior TSPO specificity in vivo, resulting in close agreement between tracer accumulation and TSPO protein levels. As a role for TSPO as a biomarker in oncology continues to emerge, these findings suggest that 18F-PBR06 represents a useful imaging tool for preclinical studies and should be explored clinically in human brain tumor studies.
MATERIALS AND METHODS
Chemicals
3H-PK 11195 was purchased from PerkinElmer. Phosphate-buffered saline and CytoScint ES Liquid Scintillation Cocktail were purchased from MP Biomedicals.
Cold Ligand and Radioligand Precursor Preparation
19F-PBR06 (PBR06) and radioligand precursor were prepared according to published methods (15).
In Vitro Radioligand Binding Assay
Radioligand binding experiments using lysates from C6 glioma cells were conducted as previously described using PBR06 as the cold ligand (16). All experiments were performed in triplicate.
Radioligand Preparation
18F-PBR06 was prepared according to published methods (15). Using a commercial apparatus (TRACERlab FXF-N; GE Healthcare), we dried aqueous 18F-fluoride ion (∼111 GBq) by iterative cycles of addition and evaporation of acetonitrile, followed by complexation with K+-K+-2.2.2/K2CO3. The complex was reacted with N-bromoacetyl-N-(2,5-dimethoxybenzyl)-2-phenoxyaniline (0.8–1.2 mg) at 100°C for 20 min. 18F-PBR06 was purified using reversed-phase high-performance liquid chromatography (HPLC) (C18, Dynamax 250 × 21.4 mm; Varian) eluted at 6.0 mL/min with 10 mM NaH2PO4 buffer (pH 6.7) and ethanol (47.5:52.5, v/v). 18F-PBR06 was collected, washed with 120 mL of water (deionized), and passed through a C18 Sep-Pak (Waters). 18F-PBR06 was eluted with ethanol (1.0 mL) into a sterile flask loaded with saline (9.0 mL). Typical specific activities were 222 TBq/mmol or greater.
Rat Model
All studies involving animals were conducted in compliance with federal and institutional guidelines. Two weeks before imaging, healthy male Wistar rats were stereotactically inoculated in the right hemisphere with 1.0 × 10⁵ C6 glioma cells (American Type Culture Collection). Before imaging, rats were affixed with jugular–carotid catheters.
MRI
MRI was used to localize tumors. Rats were secured in a prone position in a 63-mm-inner-diameter radiofrequency coil and placed in a 4.7-T horizontal bore imaging system (Varian Inc.). A constant body temperature of 37°C was maintained using heated air flow. An initial multislice gradient-echo imaging sequence (repetition time, 150 ms; echo time, 3.5 ms; matrix, 128 × 128; field of view, 40 × 40 mm; slice thickness, 2 mm) was used to acquire 7 slices in each imaging plane (axial, coronal, and sagittal) for proper positioning of subsequent scans. A multislice T2-weighted fast spin-echo scan with 8 echoes and 8.6-ms echo spacing was then collected with a repetition time of 2,000 ms, field of view of 32 × 32 mm, matrix of 128 × 128, 16 acquisitions, and 8 coronal slices (thickness, 2 mm). The same anatomic slices were then imaged at the same field of view and resolution using a diffusion-weighted spin-echo sequence (repetition time, 2,000 ms; echo time, 35.4 ms; number of acquisitions, 8; δ = 4 ms; Δ = 25 ms) at b values of 0 and 600 s/mm2.
PET/CT
PET/CT was performed within 24 h of MRI in rats with confirmed tumors. Tumor-bearing rats were administered 18F-PBR06 (∼70–100 MBq/0.2 mL) via a jugular catheter while in a microPET Focus 220 scanner (Siemens Preclinical Solutions). Dynamic images (90 min) were collected, followed by CT (microCAT II; Siemens Preclinical Solutions) for attenuation correction. For displacement studies, cold PBR06 (10 mg/kg) was injected via a jugular catheter at 30 min after radiotracer administration.
The dynamic PET acquisition was divided into twelve 5-s frames for the first minute, followed by eighty-nine 60-s frames for the duration of the scan. Data from all possible lines of response were saved in the list-mode raw data format. The raw data were then binned into 3-dimensional sinograms with a span of 3 and ring difference of 47. The images were reconstructed into transaxial slices (128 × 128 × 95) with voxel sizes of 0.095 × 0.095 × 0.08 cm, after scatter and attenuation corrections were applied, using an iterative ordered-subsets expectation maximization algorithm with 16 subsets and 4 iterations. Attenuation correction was accomplished by generating an attenuation map (sinogram) from the CT image. The CT image was first coregistered with the small-animal PET image; segmented into air, soft tissue, and bone; and then projected into sinograms with a span of 47 and ring difference of 23.
Measurement of 18F-PBR06 in Plasma
Immediately after the administration of 18F-PBR06, arterial blood samples (50 μL) were collected at 10-s intervals during the first minute of scanning, followed by collection at 90 s and 2, 8, 12, 20, 30, 45, 60, 75, and 90 min. Plasma radioactivity was measured by first centrifuging blood samples (50 μL) at 14,000 rpm for 5 min in a microcentrifuge. Next, plasma (15 μL) was removed and measured in a NaI well counter (Capintec).
HPLC Radiometabolite Analysis
Blood samples (200 μL) were collected (2, 25, and 45 min) for radiometabolite analysis. After centrifugation, plasma was extracted with acetonitrile:water (340 μL, 7.5:1, v/v). The mixture was centrifuged and the supernatant used for HPLC analysis. Radioanalysis was conducted as previously described (14). Radiochromatographic data were recorded and collected using a radioisotope detector (Bioscan), decay-corrected to time zero of each radiochromatogram, and smoothed using a locally weighted scatter plot smoothing method (17). The plasma time–activity curve was corrected with the fraction of unchanged radioligand.
Histology/Western Blotting
Whole brains were harvested and fixed in 4% formalin for 48 h, followed by paraffin embedding. For immunohistochemistry, tissues were collected and sectioned (5.0-μm thickness). TSPO immunoreactivity was assessed using a TSPO-specific rabbit polyclonal antibody that was a gift from Professor Vassilios Papadopoulos of McGill University, Montreal, Canada. Immunoreactivity was assessed using a horseradish peroxidase detection kit (Dako). For histology quantification, optical density measurements of multispectral image cubes were collected using a CRI Nuance camera, and the total intensity of positive pixels was determined.
For Western blotting, protein (50 μg) from each sample was loaded into 10% gels and resolved by electrophoresis before being transferred to polyvinylidene fluoride membranes. Membranes were blocked in tris-buffered saline and 0.1% polysorbate-20 (TBST) containing 5% w/v milk. Membranes were immunoblotted with TSPO antibody. Probing occurred overnight at 4°C (1:1,000 in TBST with 5% milk), followed by incubation for 1 h at room temperature with horseradish peroxidase secondary antibody (1:4,000 in TBST with 5% milk). Chemiluminescence (ECLplus; GE Healthcare-Biosciences) was used for protein detection.
Image Analysis and Modeling
Time–activity curves were generated by manually segmenting 3-dimensional volumes of interest over the tumor and contralateral brain using ASIPro (Siemens Preclinical Solutions), avoiding areas of central necrosis if present. The arterial input function was computed from plasma sampling during imaging and corrected for metabolism of the parent ligand. A 3-compartment, 4-rate-constant kinetic model was used to characterize 18F-PBR06 pharmacokinetics as previously described (15). Model parameters were estimated for constants for influx (K1) and efflux (k2) rates of radioligand diffusion between plasma and tissue compartments and exchange between specific (k3) and nonspecific binding (k4) compartments using the COMKAT software package (18). Modeling was performed for the whole brain (excluding tumor) and tumor, individually, by fitting time–activity curves of each region. In addition, using the first 60 min of data (beyond which, tracer was undetectable in blood), a graphical analysis method (19) was used to estimate the total distribution volume (VT) for the whole brain (excluding tumor) and tumor, with goodness of fit evaluated by inspection.
RESULTS
Specific Binding of PBR06 to TSPO in C6 Glioma Cell Line Homogenates
Previous imaging studies used 18F-PBR06 to evaluate TSPO expression associated with microglial activation in the brain (15,20). Given our focus on profiling TSPO expression in tumors, radioligand displacement of the high-affinity isoquinoline carboxamide TSPO ligand 3H-PK 11195 was used to evaluate the specific binding of the nonradioactive analog PBR06 in C6 glioma cell line homogenates in vitro (Fig. 1). In these studies, PBR06 was highly specific for TSPO in C6 cell homogenates, exhibiting robust dose-dependent displacement of 3H-PK 11195 to near-background levels. Nonlinear regression analysis of the binding data yielded an inhibitory concentration of 50% of approximately 12.6 nM for PBR06 in repeated studies.

Radioligand displacement of 3H-PK 11195 using PBR06 in C6 glioma cell lysate (calculated inhibitory concentration of 50%, 12 nM). Chemical structure of PBR06 is shown inset. Error bars denote percentage SD corresponding to triplicate measurements. Conc = concentration.
In Vivo Uptake of 18F-PBR06 in C6 Glioma
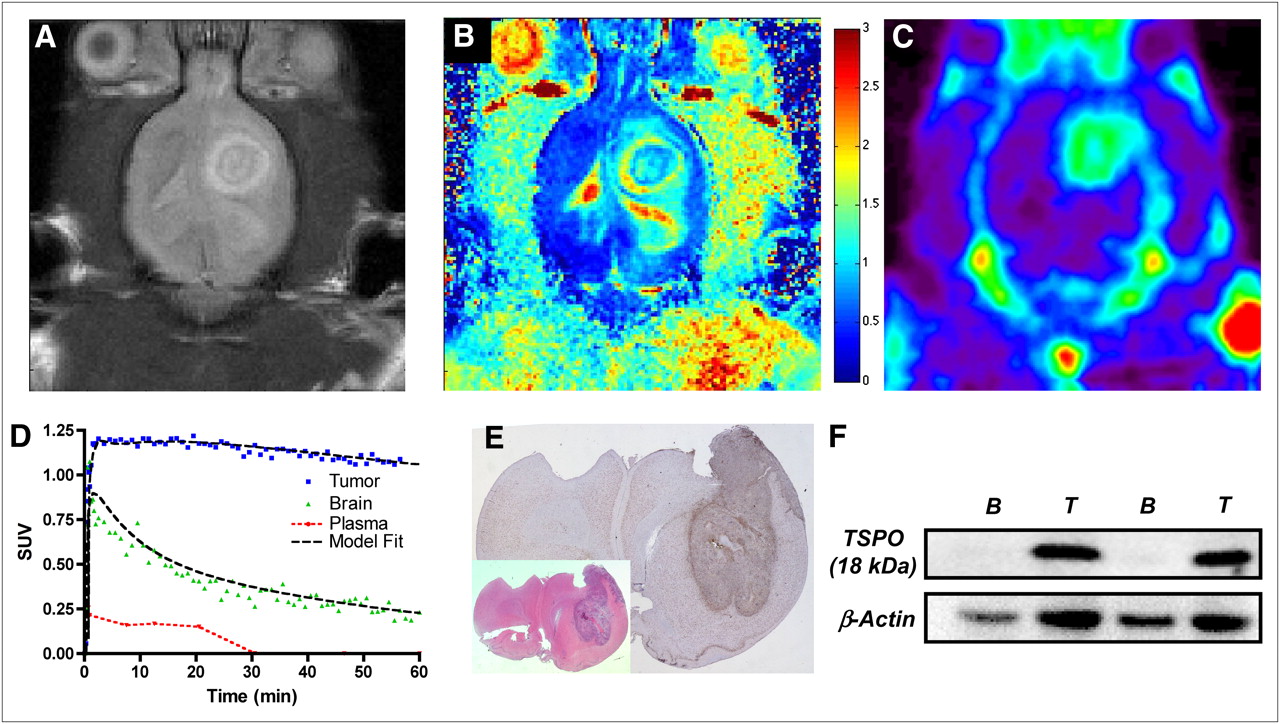
Before PET, tumor-bearing animals were subjected to T2-weighted and diffusion-weighted MRI performed at 4.7 T. In these studies, C6 tumors exhibited marked hyperintensity throughout most of the tumor, indicative of longer T2 relaxation times in the tumor than in the surrounding brain (white matter). Furthermore, a portion of the examined tumors exhibited central core regions characterized by shorter T2 values than were found in more peripheral regions (Fig. 2A). Tissues demonstrating long T2 values also exhibited increased diffusion consistent with edema typical of the C6 model (Fig. 2B). Dynamic PET of 18F-PBR06 illustrated that most of the uptake in the brain was localized to tumor tissue, with only minor uptake in adjacent normal areas of the brain (Fig. 2C). Total radioactivity levels in tumor tissue were approximately 3- to 4-fold higher than in the normal brain when compared over the last 20 min of the PET scan. We observed minor radioactivity in the skull that appeared to be consistent with 18F− uptake as well as activity that appeared to be consistent with the olfactory epithelium. Across all animals studied, we found that tumor uptake tended to be slightly higher in more peripheral regions of the tumor, presumably consistent with the regions of highest proliferation and infiltrative disease. Some tumors imaged over the course of these studies exhibited modest levels of central necrosis, similar to that shown in Figure 2. Within these tumor regions, only modest tracer uptake was observed. Figure 2D illustrates time–activity curves for the whole tumor, the normal brain, and plasma activity for a typical 90-min scan. We found that 18F-PBR06 washed into both the normal brain and the tumor tissue rapidly, but the washout from tumor tissue was much slower than from the normal brain. After the initial spike in the plasma activity consistent with tracer injection, 18F-PBR06 rapidly cleared from plasma. Immediately after imaging, brains were harvested and processed for subsequent staining and immunohistochemistry. Using standard hematoxylin and eosin staining to localize the tumor (Fig. 2E, inset), we found that TSPO immunoreactivity was significantly higher in the tumor than in the normal brain (Fig. 2E). Consistent with previous studies of TSPO expression in glioma, TSPO protein levels measured by immunohistochemistry optical density were approximately 3.3-fold higher in tumor tissue than in normal brain tissue (5). Analogous to the accumulation of 18F-PBR06, TSPO expression within the tumor appeared to be somewhat higher nearer the tumor periphery (Fig. 2E), suggesting higher TSPO density in areas of active tumor proliferation. As further confirmation of the TSPO expression density in the tumor compared with the contralateral brain, Western blot analysis was performed on resected tumor tissue and contralateral normal brain. Similar to the immunohistochemistry studies, analysis of the relative TSPO immunoreactivity (18-kDa band) from multiple subjects demonstrated that TSPO levels were approximately 3-fold higher in the tumor tissue than in the contralateral brain tissue (Fig. 2F). Importantly, excellent agreement was observed between 18F-PBR06 accumulation and TSPO protein levels measured by both immunohistochemistry and Western blotting.

T2-weighted (A) and diffusion-weighted (B) MR images of rat bearing C6 glioma in right brain hemisphere. (C) PET demonstrates elevated uptake of 18F-PBR06 in tumor tissues, compared with contralateral brain (summed dynamic scan, 0–90 min). (D) 18F-PBR06 time–activity curves and model fit (3 compartment, 4 parameter) for tumor (blue), contralateral brain (green), and plasma (red) demonstrate rapid tracer uptake in tumor and normal brain, followed by rapid clearance from plasma and normal tissue. Comparatively slow washout of 18F-PBR06 was observed in tumor tissues, facilitating significant contrast between tumor and contralateral brain. (E) Serial histologic analysis of typical C6 glioma by standard hematoxylin and eosin staining (inset) and immunohistochemistry for TSPO expression illustrating elevated TSPO expression within tumor tissue, compared with contralateral brain. (F) Western blot assay illustrating relative TSPO protein expression levels in matched contralateral brain tissue and C6 glioma tissues harvested from similar C6 glioma–bearing rat cohorts. Color bar in B corresponds to units of diffusion (μm2/ms). B = brain tissue; T = C6 glioma tissue.
In Vivo Displacement of 18F-PBR06
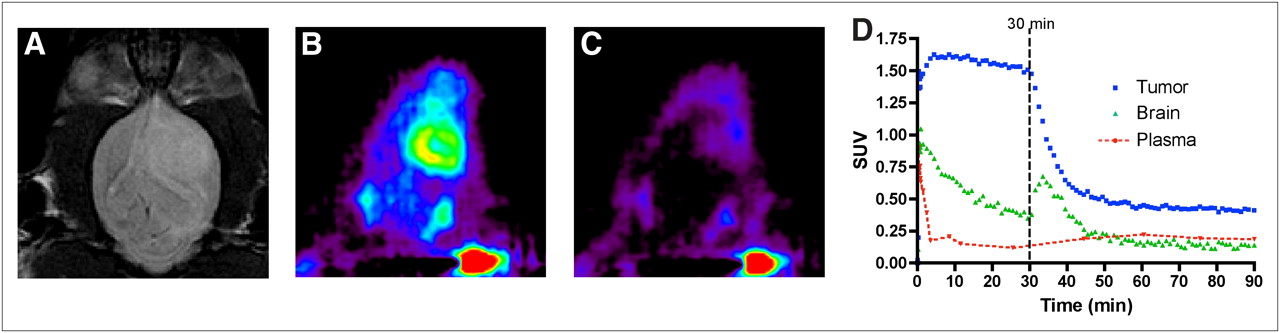
To evaluate the in vivo TSPO specificity of 18F-PBR06, we performed displacement studies in C6-bearing rats using the cold analog, PBR06. As shown in Figure 3, during the dynamic PET study, excess (10 mg/kg) PBR06 was administered intravenously at 30 min after injection of 18F-PBR06. Summation of the first 30 min of the PET scan before injection of PBR06 (0–30 min) demonstrated typical uptake characteristics of 18F-PBR06 (Fig. 3B). However, summation of the final 30 min of the PET scan (60–90 min) demonstrated significant displacement of 18F-PBR06 in normal brain and tumor tissues (Fig. 3C). Accordingly, time–activity curve analysis (Fig. 3D) demonstrated that after injection of PBR06, tumor activity was reduced to approximately 25% of the peak tumor uptake. During tumor displacement, we observed a minor influx of tracer into normal brain that rapidly cleared and elevated radioactivity in the plasma. In further studies, an additional injection of excess cold ligand at 45 min after 18F-PBR06 injection did not result in additional displacement of the radiotracer (data not shown), suggesting that the level of displaceable binding in these studies was approximately 75%.

In vivo displacement of 18F-PBR06 in C6 glioma–bearing cohort. (A) T2-weighted MR image of rat bearing C6 glioma in right brain hemisphere. Relative 18F-PBR06 uptake before (B) and after (C) intravenous infusion of excess PBR06. (D) 18F-PBR06 time–activity curves generated for tumor (blue), contralateral brain (green), and plasma (red). Immediately after infusion of 18F-PBR06, tumor activity drops to approximately 25% of maximum uptake level, accompanied by minor, transient tracer influx observed in contralateral brain and elevated plasma activity. Data are representative of repeated imaging studies.
Characterization of 18F-PBR06 Radiometabolites
Arterial blood samples were collected to assay 18F-PBR06 radiometabolites for correction of the arterial input function. Figure 4 illustrates a typical activity-corrected reversed-phase HPLC trace of a blood sample collected at 2 min after injection of 18F-PBR06. At this time point, we noted the presence of both 18F− (retention time, 2.8 min) and the parent ligand (retention time, 10.1 min) in a respective ratio of approximately 1:3. Analogously, 25- to 30-min blood samples routinely demonstrated significantly decreased plasma levels of parent ligand and slightly decreased levels of 18F−. In contrast to human studies using 18F-PBR06 (15), we did not observe additional radiometabolites during these studies. Plasma analysis of samples after displacement of 18F-PBR06 with PBR06 exhibited elevated levels of both parent ligand and 18F−, suggesting that tracer metabolism in this model is a plasma-specific event.

HPLC radiochromatograms illustrating plasma composition of parent ligand (18F-PBR06) and primary radiometabolite 18F− as function of time after tracer injection. At 2 and 25 min after injection of 18F-PBR06, free 18F− (25% at 2.8 min, 62% at 30 min) and parent ligand (75% at 2.8 min, 38% at 30 min) are detectable in plasma. After infusion of PBR06 at 30 min after administration of 18F-PBR06, both fraction of 18F-PBR06 (57% at 45 min) and 18F− (43% at 45 min) were elevated in plasma. Dashed gray line = 2 min after 18F-PBR06 injection; dashed black line = 25 min after 18F-PBR06 injection; solid black line = 45 min after 18F-PBR06 injection and 15 min after cold PBR06 injection.
Compartmental Modeling
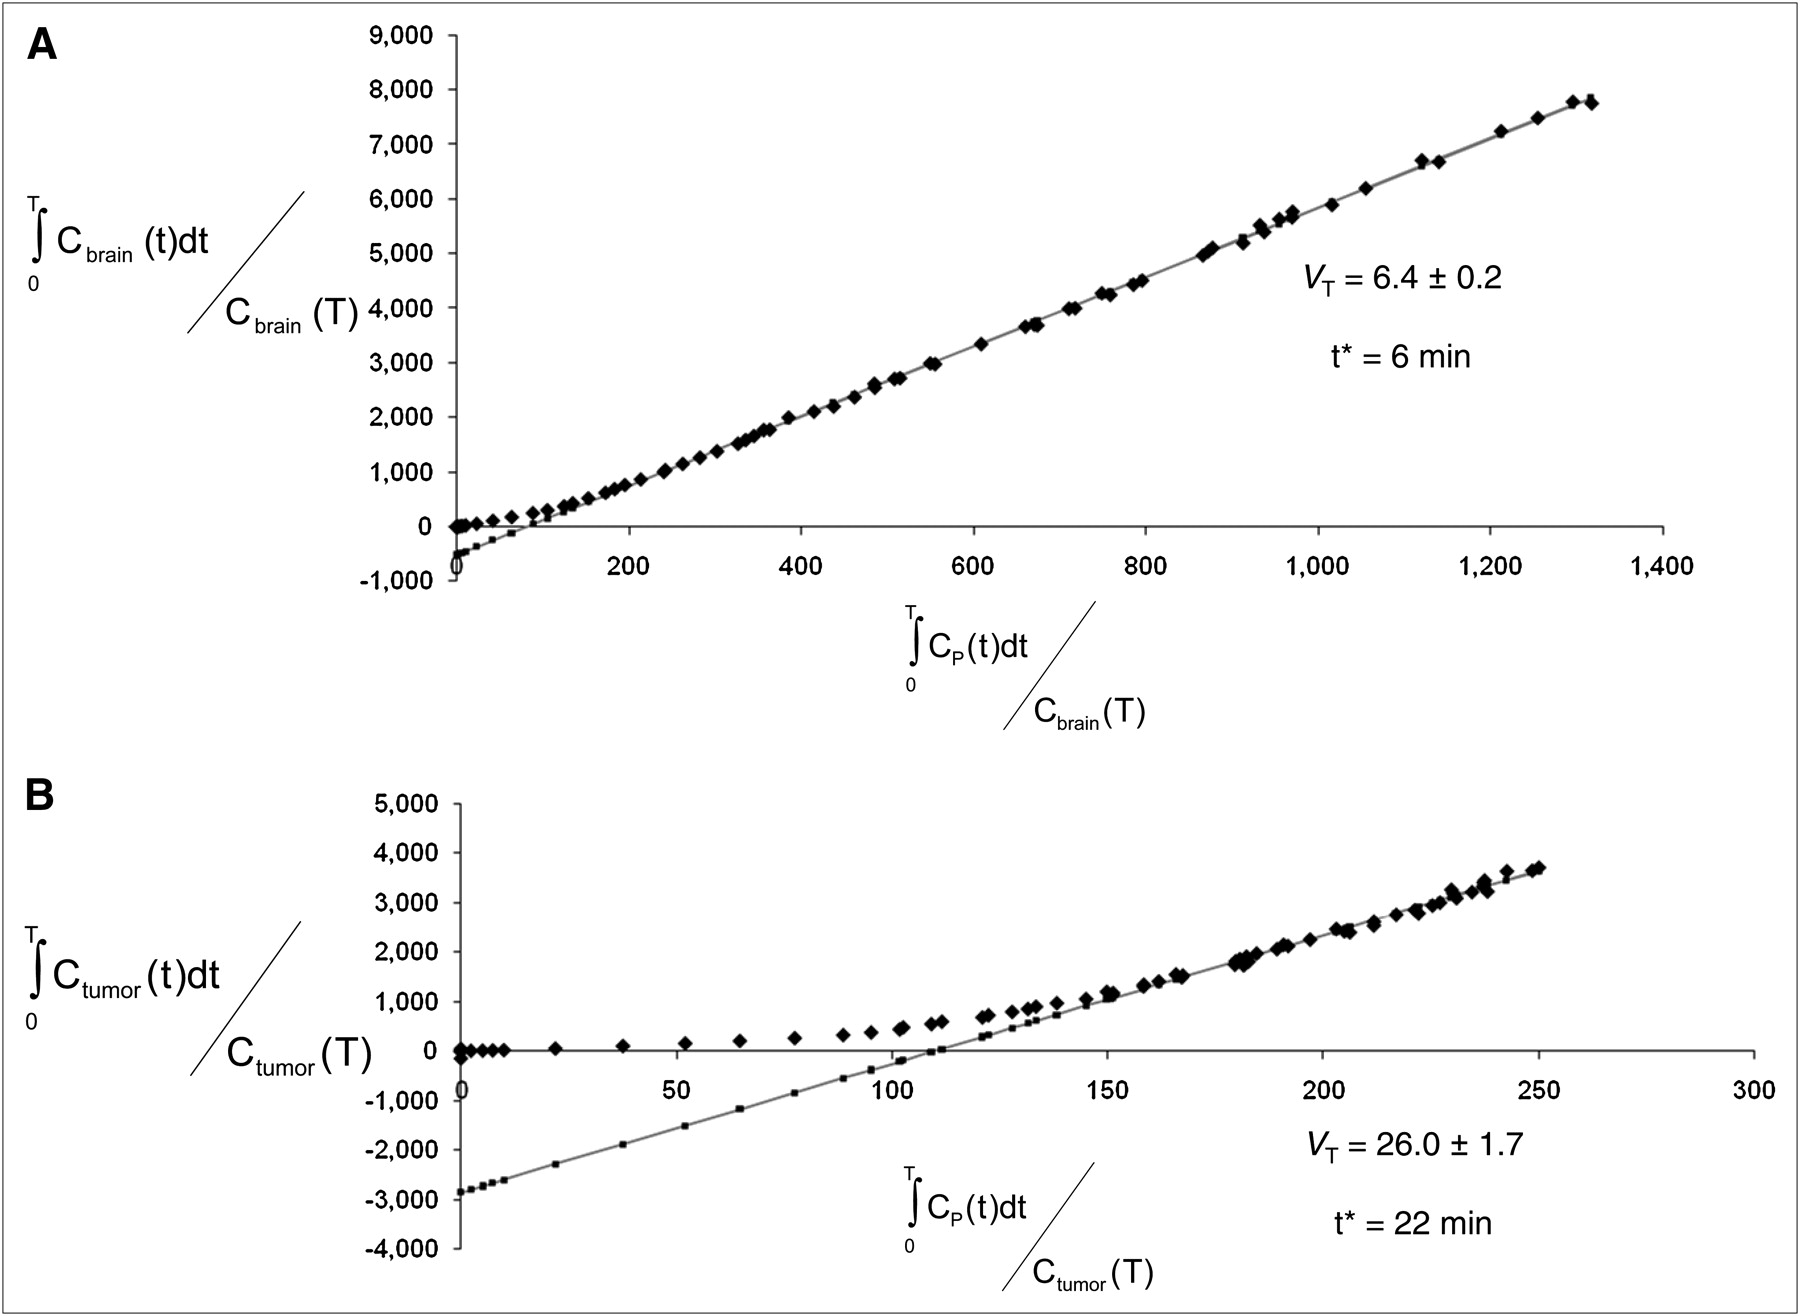
Previous human studies have demonstrated good fitting of 18F-PBR06 imaging data to a 3-compartment, 4-kinetic parameter model for quantitative analysis in brain tissues (14). Using this model and the metabolite-corrected arterial input function, we solved the parameters K1, k2, k3, and k4 for tumor tissue and normal brain (Table 1; curve fitting shown in Fig. 2D). We noted good agreement for measured parameters in the normal brain, particularly k3 and k4, when comparing our rat studies to values previously determined in nonhuman primates (20). Similarly, though studies describing direct estimation of parameters in tumor tissue using 18F-PBR06 are unreported, it appeared that direct parameter estimation was possible in tumor tissue. Unlike the normal brain, however, tumor tissues tended to exhibit k4 values approaching zero (Table 1). The low k4 values resulted in estimations of VT from tumor-derived parameters (data not shown) that were not supported by direct measures of TSPO density (immunohistochemistry, Western blot). In contrast, graphical estimation of VT, which does not depend on the direct measurement of k4, yielded statistically significant values that closely mirrored TSPO expression levels in tumor, compared with the normal brain (Figs. 5A and 5B; Table 1). Though further study is warranted, these data suggest that graphical estimation of VT for 18F-PBR06 uptake in tumor tissue is likely superior to estimation using kinetic parameters.
Parameter Estimations for 18F-PBR06 Uptake

Representative graphical analysis of VT for 1 subject studied in this investigation. Fit was performed for normal brain (A) and for tumor (B). Line = linear regression; t* = start time for linear regression. Cbrain(t) = concentration of radiotracer in brain at time (t); Cp(t) = concentration of radiotracer in plasma at time (t); Ctumor(t) = concentration of radiotracer in tumor at time (t).
DISCUSSION
The earliest published evidence supporting the hypothesis that TSPO ligands could be useful for detection and possibly grading of human brain tumors emerged more than 20 years ago (6,8,10). These reports easily predated molecular studies seeking to elucidate the role of TSPO in tumorogenesis, many of which continue today (1,21,22). The first proof-of-principle imaging studies used 3H-PK 11195 and autoradiography to visualize TSPO expression in experimental models of glioma (6,10) and postmortem human brain sections (8). These ex vivo studies established that 3H-PK 11195, a highly selective TSPO ligand without appreciable affinity for the central benzodiazepine receptor, could discriminate brain tumors from normal cortex. Furthermore, the amount of ligand uptake appeared to be proportional to tumor aggressiveness, cell proliferation, and tumor grade (5,8). Supported by these data, the first human PET studies using 11C-PK 11195 to image brain tumors were conducted (7,9), and these seminal investigations led to several important observations. In one report, Junck et al. imaged a range of human gliomas with two different TSPO ligands, 11C-PK 11195 and 11C-Ro5-4864 (9). Although both PK 11195 and Ro5-4864 are potent and selective TSPO ligands with in vitro affinity in the low nanomolar range (23), this study established the clear superiority of 11C-PK 11195 over 11C-Ro5-4864 for brain tumor imaging. PET scans with 11C-Ro5-4864 failed to demonstrate higher levels of radioactivity in tumor tissue than in normal brain, supporting an earlier autoradiography study comparing 3H-PK 11195 with 3H-Ro5-4864 (8). In contrast, 11C-PK 11195 demonstrated significantly elevated uptake in gliomas, when compared with contralateral normal brain, in 8 of 10 patients, with tumor–to–gray matter ratios approaching 2 in 3 of 10 patients (7). In addition to the tumor-selective nature of 11C-PK 11195, these data illustrate that chemical, biochemical, and pharmacologic determinants are not well understood regarding the rational selection of TSPO ligands as potential cancer imaging probes. In subsequent investigations, Pappata et al. (9) found similar levels of 11C-PK 11195 uptake in a glioma study. However, these authors also performed a displacement study using cold ligand and demonstrated that slightly less than 30% of the 11C-PK 11195 was displaceable. Both of these studies suggest the utility of TSPO ligands for brain tumor imaging. However, the relatively modest uptake and attendant contrast afforded by 11C-PK 11195 in tumor tissue, compared with the normal brain—despite considerably larger differences in relative TSPO expression—coupled with high levels of nondisplaceable ligand binding, suggest that exploration and development of novel TSPO ligands could improve the prospects of advancing TSPO as a cancer imaging biomarker.
Within this context, we evaluated 18F-PBR06 in the C6 preclinical model of glioma. Because this agent has yet to be reported in a cancer imaging study, we synthesized PBR06 and evaluated its in vitro specificity for TSPO in C6 tumor cell lysates. As expected, PBR06 displaced 3H-PK 11195 in the nanomolar range, indicating acceptable in vitro TSPO specificity using C6 tumor cell lysates. In vivo imaging studies using C6 glioma–bearing rats demonstrated that quantified uptake of 18F-PBR06 in tumor and normal brain accurately reflected the relative TSPO expression levels in these tissues. Specifically, we observed strikingly similar tumor–to–normal brain ratios when comparing total radioactivity over the last 20 min of the PET scan, graphically estimated VT ratios (tumor–to–normal brain ratios), and TSPO protein levels as measured by immunohistochemistry and Western blot analysis. Moreover, we found that approximately 75% of the in vivo tumor uptake of 18F-PBR06 could be displaced with PBR06, suggesting that, unlike 11C-PK 11195, most tracer uptake reflects specific TSPO binding. Interestingly, estimation of VT calculated from kinetic parameters appeared feasible in the normal brain, yet tumor estimates were confounded by near-zero k4 values. Though future studies should further confirm the reversibility of 18F-PBR06 binding in various tumor tissues, importantly, graphical estimations of VT in these studies more closely reflected the relative TSPO expression in normal and tumor tissues. Thus, in this work we have reported VT estimates using graphical methods only. Complementary to studies using TSPO immunoreactivity in tumors to document a relationship between TSPO protein levels and outcome (3,24,25), our data suggest the feasibility of carrying out similar investigations in which TSPO levels are assayed using noninvasive molecular imaging. Though these studies did not specifically address the delineation of tumor-specific TSPO expression from that of a tumor-related inflammatory infiltrate, our previous studies conducted in this area (26) suggest that the relative tumor cellularity and resultant overall tumor TSPO density circumvent limitations imposed by a comparatively modest density comprising the inflammatory microenvironment.
To the best of our knowledge, this is the first tumor imaging study using the aryloxyanilide-based PET ligand 18F-PBR06. Though further validation of this tracer in tumor studies is warranted, we envision that development of novel TSPO ligands for cancer imaging represents a potentially fruitful area of research, particularly given the increasing prevalence of preclinical PET scanners and rapid, library-based synthesis methodology. For example, we recently reported a high-throughput, microwave-assisted organic synthesis method adaptable to library-based synthesis of novel pyrazolopyrimidines that reduces synthetic reaction times from weeks to a few hours (27). Among the pyrazolopyrimidine class, 18F-DPA-714 is a promising TSPO PET ligand that demonstrates attractive kinetics and a high degree of displaceable binding in nonhuman primates (28). Like the aryloxyanilide evaluated herein, it may be equally promising to evaluate pyrazolopyrimidine-based imaging ligands as cancer imaging probes.
CONCLUSION
The objective of this study was to explore the utility of 18F-PBR06 to assess TSPO expression in preclinical models of glioma. 18F-PBR06 uptake accurately reflected TSPO densities in normal brain and tumor tissue and appears to be an ideal candidate probe for exploration of TSPO expression in other preclinical cancer models, with future applications in human cancer imaging studies.
Acknowledgments
We gratefully acknowledge Professor Vassilios Papadopoulos of McGill University for the TSPO antibody. Clare A. Osborne, Zou Yue, and Fuxue Xin provided imaging support. This work was supported in part by funding from the National Cancer Institute (1R01 CA140628, K25 CA127349, 1RC1CA145138-01, 1P50CA128323, and U24 CA126588) and training grants (5R25 CA092043-09, T32 EB003817, and R25 CA136440).
- © 2011 by Society of Nuclear Medicine
REFERENCES
- Received for publication July 26, 2010.
- Accepted for publication October 12, 2010.


Jump to section
Related Articles
Cited By...
- TSPO-targeted PET and Optical Probes for the Detection and Localization of Premalignant and Malignant Pancreatic Lesions
- Imaging Macrophage Accumulation in a Murine Model of Chronic Pancreatitis with 125I-Iodo-DPA-713 SPECT/CT
- Combined PET Imaging of the Inflammatory Tumor Microenvironment Identifies Margins of Unique Radiotracer Uptake
- Imaging Microglial Activation with TSPO PET: Lighting Up Neurologic Diseases?
- TSPO as a target for glioblastoma therapeutics
- TSPO is a REDOX regulator of cell mitophagy
- The 18-kDa Mitochondrial Translocator Protein in Human Gliomas: An 11C-(R)PK11195 PET Imaging and Neuropathology Study
- The Translocator Protein Radioligand 18F-DPA-714 Monitors Antitumor Effect of Erufosine in a Rat 9L Intracranial Glioma Model
- Quantitative Preclinical Imaging of TSPO Expression in Glioma Using N,N-Diethyl-2-(2-(4-(2-18F-Fluoroethoxy)Phenyl)-5,7-Dimethylpyrazolo[1,5-a]Pyrimidin-3-yl)Acetamide
- The Translocator Protein