


Abstract
Peripheral benzodiazepine receptor (PBR) is upregulated in activated glial cells and is therefore a useful biomarker for inflammation in the brain and neurodegenerative disorders. We developed a new PET radioligand, 11C-AC-N-benzyl-N-ethyl-2-(7-methyl-8-oxo-2-pheyl-7,8-dihydro-9H-purin-9-yl)acetamide (11C-AC-5216), that allows the imaging and quantification of PBRs in monkey and mouse brains. The aim of this study was to evaluate a quantification method of 11C-AC-5216 binding in the human brain. Methods: A 90-min dynamic PET scan was obtained for each of 12 healthy men after an intravenous injection of 11C-AC-5216. Regions of interest were drawn on several brain regions. Binding potential, compared with nondisplaceable uptake (BPND), was calculated by a nonlinear least-squares fitting (NLS) method with the 2-tissue-compartment model, and total volume of distribution (VT) was estimated by NLS and graphical analysis methods. Results: BPND was highest in the thalamus (4.6 ± 1.0) and lowest in the striatum (3.5 ± 0.7). VT obtained by NLS or graphical analysis showed regional distribution similar to BPND. However, there was no correlation between BPND and VT because of the interindividual variation of K1/k2. BPND obtained with data from a scan time of 60 min was in good agreement with that from a scan time of 90 min (r = 0.87). Conclusion: Regional distribution of 11C-AC-5216 was in good agreement with previous PET studies of PBRs in the human brain. BPND is more appropriate for estimating 11C-AC-5216 binding than is VT because of the interindividual variation of K1/k2. 11C-AC-5216 is a promising PET ligand for quantifying PBR in the human brain.
Peripheral benzodiazepine receptor (PBR) is pharmacologically distinct from central benzodiazepine receptor (CBR). PBR is primarily found on mitochondrial membranes in various peripheral organs (1–4) and is mainly located in glial cells in the brain; its expression was found to be increased in activated microglia in vivo by brain injury (5,6). The increase in PBR density has thus been used as an indicator of neuronal damage and neurodegenerative disorders, such as Alzheimer disease (7,8). These findings then gave impetus to the development of an imaging agent labeled with a radioisotope, making it possible to visualize the distribution of PBR also in the animal brain in vivo (9–11). Specific radiolabeled ligands for PBR, such as 11C-PK11195 and 11C-DAA1106, have been used in many clinical studies. 11C-PK11195 was first developed to characterize PBR in the human brain (12). 11C-PK11195 binding was reported to have increased in the stroke region (13), plaque of multiple sclerosis (14–16), brain of Alzheimer disease (17,18), and epileptic foci (19). However, the relatively low uptake of 11C-PK11195 in the brain limited its wider application (20,21). Therefore, to characterize PBR precisely using PET with advantages over 11C-PK11195, we developed 2 novel radioligands, 11C-DAA1106 (22,23) and 18F-FEDAA1106 (24). These ligands exhibited more potent in vitro binding affinity for PBR than did PK11195 and displayed high selectivity against other receptors, including CBR (24,25). In vivo studies demonstrated that these ligands had higher uptake and specific binding in rodent and primate brains than did 11C-PK11195 (22–24). We have reported a kinetic analysis method for 11C-DAA1106 and 18F-FEDAA1106 binding in the human brain (26,27) and a broad increase of PBR binding in the Alzheimer disease brain using 11C-DAA1106 (28).
N-benzyl-N-ethyl-2-(7-methyl-8-oxo-2-pheyl-7,8-dihydro-9H-purin-9-yl)acetamide (AC-5216) is a new candidate as a PET ligand for PBR (29). Affinity of AC-5216 for PBR (inhibition constant, 0.297 nM) was higher than PK11195 (0.602 nM) (29) and lower than DAA1106 (36–108 pM) (30). AC-5216 exhibited negligible affinity for CBR and other receptors, monoamine transporters, and ion channels. The synthesis of 11C-labeled AC-5216 (11C-AC-5216) and its high accumulation in the mouse brain have been reported (31). A PET study in monkeys demonstrated high uptake of 11C-AC-5216 in the brain, and the binding was inhibited by unlabeled AC-5216 and PK11195 (31). 11C-AC-5216 can be used for the clinical investigation of PBR expression and therefore also microglia activation in neurologic diseases, but the quantification method of 11C-AC-5216 binding in the living human brain has not yet been established. In the present study, PET measurements with 11C-AC-5216 were performed on healthy human subjects. We evaluated kinetic analysis methods for the quantification of 11C-AC-5216 binding in the human brain.
MATERIALS AND METHODS
Subjects
Twelve male healthy volunteers (age range, 20–33 y; mean age ± SD, 24.6 ± 4.5 y) participated in this study. All volunteers were free of any somatic, neurologic, or psychiatric disorders, and they had no history of current or previous drug abuse. This study was approved by the ethics and radiation safety committees of the National Institute of Radiologic Sciences. Written informed consent was obtained from each subject.
Radioligand Preparation
11C-AC-5216 was synthesized as described previously (31). In brief, AC-5216 and its desmethyl precursor were synthesized starting from commercially available compounds. 11C-AC-5216 was radiosynthesized through the reaction of the precursor with 11C-CH3I in the presence of sodium hydride.
PET
An ECAT EXACT HR+ PET scanner system (CTI-Siemens) was used for all measurements. A head-fixation device was used to minimize head movement. A transmission scan for attenuation correction was obtained using a 68Ge/68Ga source. Dynamic PET scans were obtained after a 1-min intravenous slow bolus injection of 11C-AC-5216 (354.6–385.1 MBq [372.8 ± 9.7 MBq]). The specific radioactivities were 93.7–224.2 GBq/μmol (148.2 ± 35.6 GBq/μmol) at the time of injection. Brain radioactivities were measured from 0 to 90 min (20 s × 9, 60 s × 5, 120 s × 4, 240 s × 11, and 300 s × 6). MR images of the brain were acquired with a 1.5-T MRI scanner (Gyroscan NT; Philips). T1-weighted images were obtained at 1-mm slices.
Arterial Blood Sampling
To obtain the arterial input function, arterial blood samples were taken manually 32 times (10, 20, 30, 40, 50, 60, 70, 80, 90, 100, 110, 120, and 150 s and 3, 4, 5, 6, 7, 8, 9, 10, 12, 15, 20, 25, 30, 40, 50, 60, 70, 80, and 90 min after the radiotracer injection) during the PET scan. Each blood sample was centrifuged to obtain plasma and blood cell fractions, and the concentrations of radioactivity in whole blood and plasma were measured. Plasma protein binding was not determined in this study.
The percentage of unchanged 11C-AC-5216 in plasma was determined by high-performance liquid chromatography (HPLC) in 10 blood samples (3, 10, 20, 30, 40, 50, 60, 70, 80, and 90 min after injection). Acetonitrile was added to each plasma sample, and the samples were then centrifuged. The supernatant was subjected to radio–high-performance liquid chromatography analysis (column, XBridge Prep C18 [Waters]; mobile phase, 50% acetonitrile). The plasma input function was defined as the radioactivity of plasma multiplied by the percentage of unchanged radioligand.
Regions of Interest (ROIs)
All MR images were coregistered to PET images using PMOD (version 2.8; PMOD Technologies). Eleven ROIs were drawn manually on the PET images with reference to coregistered MR images. ROIs were delineated for the cerebellum, dorsolateral prefrontal cortex, medial prefrontal cortex, parietal cortex, lateral temporal cortex, medial temporal cortex, occipital cortex, anterior cingulate cortex, posterior cingulate cortex, striatum, and thalamus.
Kinetic Model of 11C-AC-5216
To describe the kinetics of 11C-AC-5216 in the brain, the 2-tissue-compartment model with 4 rate constants (K1, k2, k3, and k4) was used (32). The 3 compartments were defined as follows: CP, the radioactivity concentration of unchanged radioligand in plasma (arterial input function); CND, the radioactivity concentration of nondisplaceable radioligand in brain, including nonspecifically bound and free radioligand; and CS, the radioactivity concentration of radioligand specifically bound to receptors. The rate constants K1 and k2 represent the influx and efflux rates for radioligand diffusion through the blood–brain barrier. The rate constants k3 and k4 represent the radioligand transfers between the compartments for nondisplaceable and specifically bound radioligand. This model can be described by the following equations: Eq. 1
Eq. 1 Eq. 2
Eq. 2 Eq. 3CT(t) is the total radioactivity concentration in a brain region measured by PET. In this analysis, blood volume (Vb) was fixed to be 0.05 mL/mL (26).
Calculation of 11C-AC-5216 Binding
In the nonlinear least-squares fitting (NLS) method, 11C-AC-5216 bindings were expressed as binding potentials relative to nondisplaceable binding (BPND). BPND can be expressed as: Eq. 4Bmax is the receptor density, 1/Kd is the affinity, and fND is the free fraction of ligand in the nondisplaceable tissue compartment. We also calculated the total distribution volume (VT), which can be expressed as:
 Eq. 5
Eq. 5
In the graphical analysis (GA) method, GA yields VT from the arterial input function and the tissue time–activity curve (33). Parameters are estimated from the equation: Eq. 6where V represents VT after equilibration time t*. Because b becomes constant only after equilibration time t*, V and b are estimated as a slope and an intercept, respectively, using the points of T > t*. The starting time for linear regression t* was set at 30 min.
In these methods, the PET scan data for 90 min and those for 60 min were used. For these analyses, PMOD was used.
RESULTS
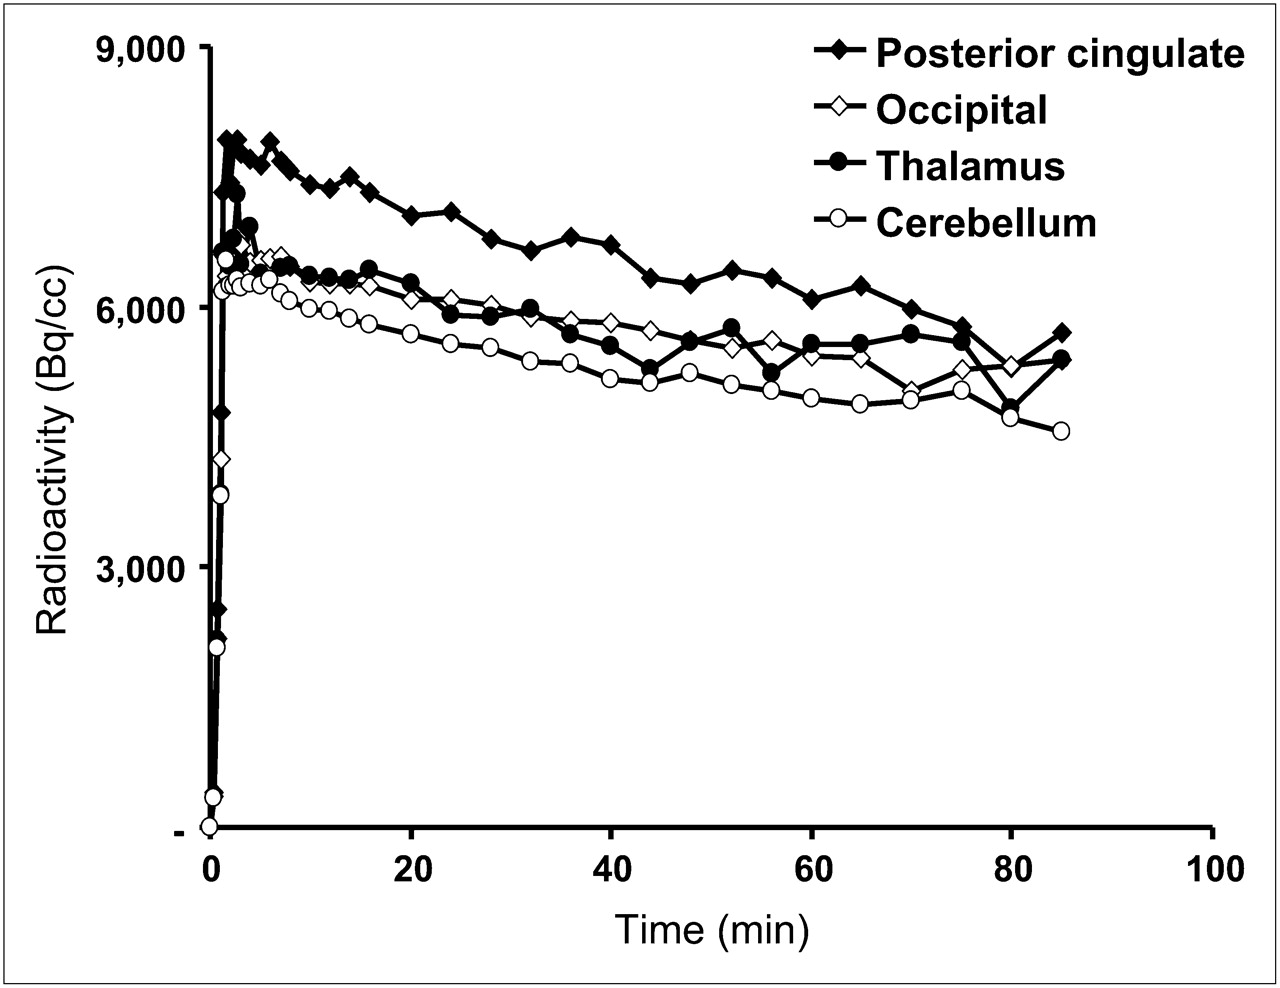
Typical summated PET images (0–10, 10–30, 30–60, and 60–90 min) and T1-weighted MR images are shown in Figure 1. The distribution of radioactivity was widespread and fairly uniform in the gray matter of the cerebral cortices and cerebellum, striatum, and thalamus. Typical time–activity curves of measured brain regions are shown in Figure 2. After an intervenous injection of 11C-AC-5216, radioactivity peaked at about 2–3 min, followed by slow washout. The average percentage of unchanged 11C-AC-5216 in plasma was 99.8% ± 0.2% at 3 min, 89.1% ± 4.5% at 30 min, and 69.6% ± 12.0% at 90 min (mean ± SD) (Fig.3).
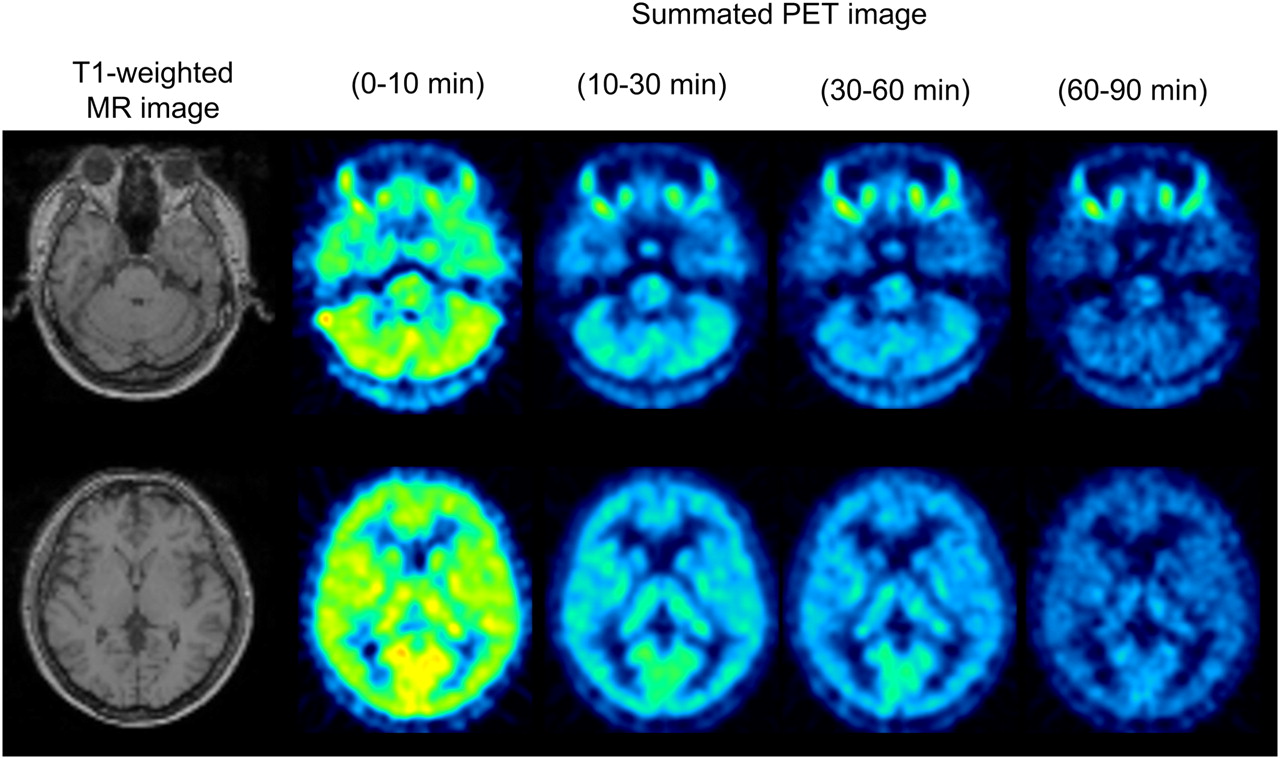
Typical summated PET images from 0 to 10, 10 to 30, 30 to 60, and 60 to 90 min of 11C-AC-5216 and T1-weighted MR images.

Typical time–activity curves of 11C-AC-5216 in occipital cortex, posterior cingulate cortex, thalamus, and cerebellum.

Average percentage of unchanged 11C-AC-5216 in plasma. Bars indicate SD.
The K1, K1/k2, k3, k3/k4, and VT values estimated by NLS and VT estimated by GA are listed in Tables 1 and 2 for scan times of 90 and 60 min, showing the mean and coefficient of variation (COV) (SD/mean [%]) of all ROIs. Although the mean VT values estimated by GA were larger than those by NLS in all regions, good correlation was observed between them (r = 0.93, P < 0.001) (Fig. 4). However, no correlation was observed between BPND estimated by NLS and VT estimated by NLS or GA for all regions (VT by NLS, r = 0.31; VT by GA, r = 0.19) (Figs. 5A and 5B). BPND values estimated by NLS with a scan time of 60 min were in good agreement with those with a scan time of 90 min (r = 0.87, P < 0.001) (Fig. 6). VT values estimated by NLS or GA with a scan time of 60 min were in good agreement with those with a scan time of 90 min (VT by NLS, r = 0.82, P < 0.001; VT by GA, r = 0.92, P < 0.001).
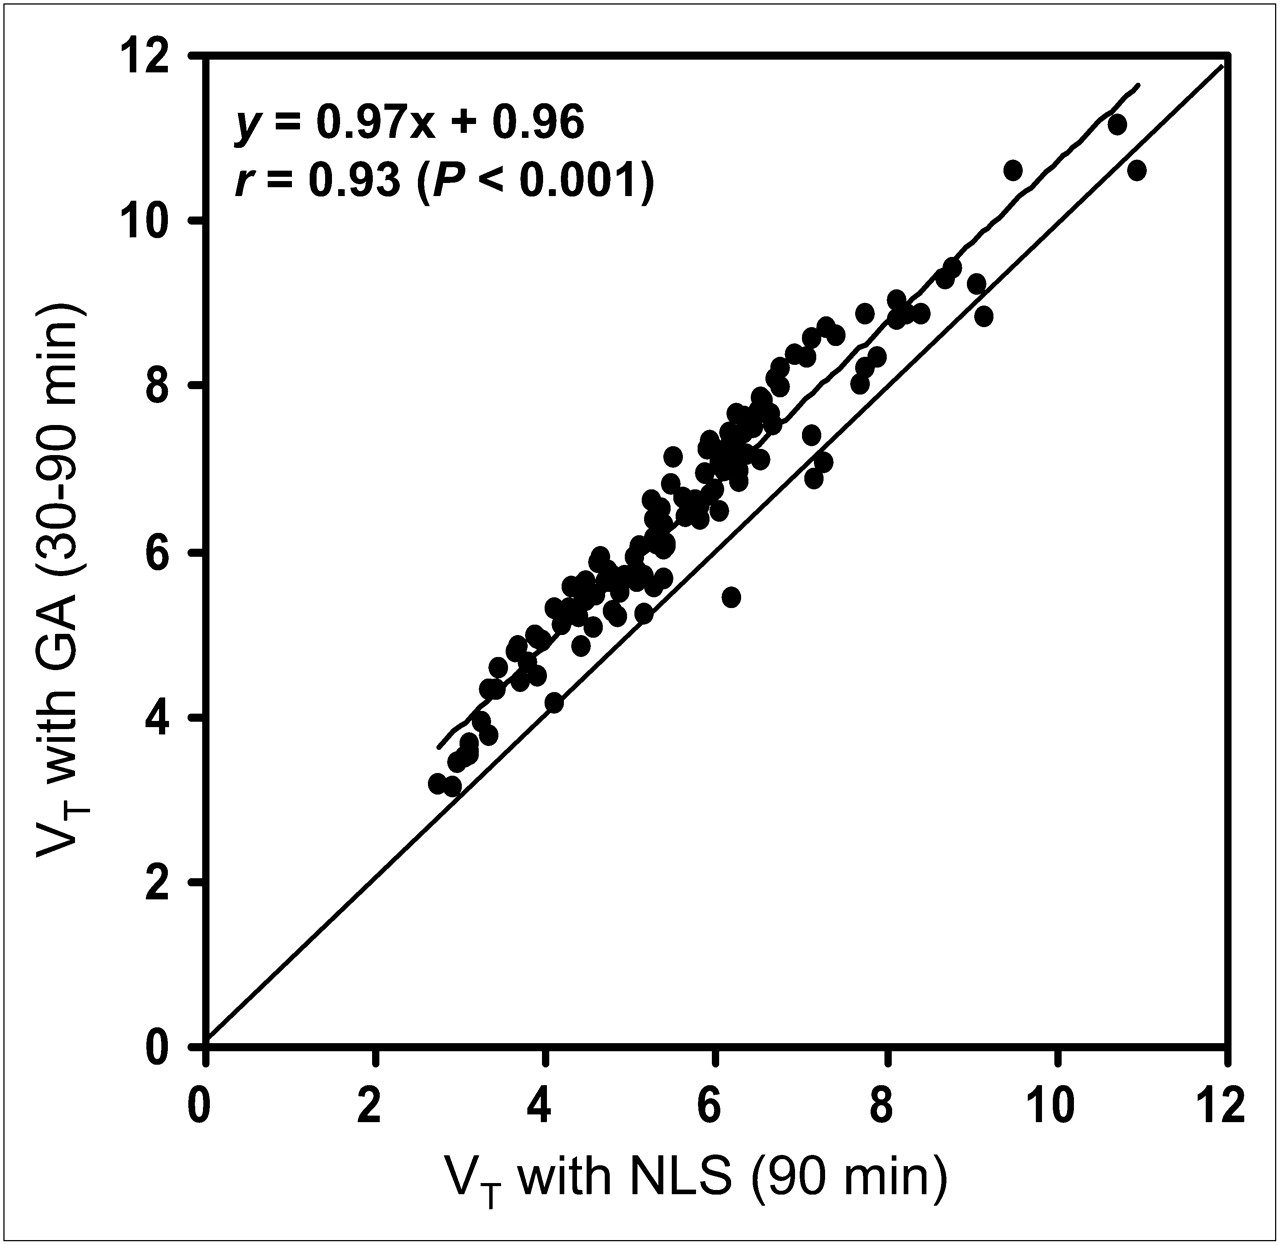
Relationship between VT estimated by NLS method and VT estimated by GA method in all regions.

Relationship between BPND estimated by NLS method and VT estimated by NLS (A) or GA (B) method in all regions.

Relationship between BPND estimated by NLS method with scan time of 90 min and that with scan time of 60 min in all regions.
Average Values of Parameters Estimated by Each Method with 90-Minute Scan Time (n = 12)
Average Values of Parameters Estimated by Each Method with 60-Minute Scan Time (n = 12)
DISCUSSION
This study describes the first, to our knowledge, quantitative analysis of PET measurement with 11C-AC-5216 for PBR binding in the living human brain. Intravenous injection of 11C-AC-5216 showed radioactivity to peak at about 2–3 min, followed by slow washout, similar to the pattern of 11C-DAA1106 in animal (31) and human studies (26). BPND was highest in the thalamus in this study, consistent with 11C-PK11195 (18) and 11C-DAA1106 (26) studies. BPND was relatively higher in the medial temporal cortex and cerebellum and lower in the striatum, which was also consistent with 11C-DAA1106 (26). VT obtained by NLS or GA showed regional distribution similar to BPND in this study, whereas VT was highest in the cerebellum in the 11C-DAA1106 study (26).
Although VT showed regional distribution similar to BPND, BPND did not correlate with VT obtained by NLS or GA. The COVs of K1/k2 (mean, 27.5; range, 17.6–34.4) were larger than those of k3/k4 (mean, 22.8; range, 19.3–26.9), indicating that the interindividual variation of VT is mainly caused by the variation of K1/k2 rather than k3/k4. The same observation was documented in the 11C-DAA1106 study, in which we reported that interindividual variation of K1/k2 may have been due to errors in plasma input functions, including interindividual variation of plasma protein binding of the radioligand, and that BPND with the NLS method was the most appropriate for the quantification of 11C-DAA1106 binding (26). The COVs of K1/k2 of 11C-AC-5216 were similar to those of 11C-DAA1106 (mean, 26.2; range, 22.0–30.4). Thus, we concluded that BPND is more appropriate for the quantification of 11C-AC-5216 binding than VT.
For clinical research, a short scan time is preferred. In the present study, the BPND values obtained by the NLS method with a scan time 60 min were in good agreement with those obtained with a scan time of 90 min (r = 0.87, P < 0.001). VT values estimated by NLS or GA with a scan time of 60 min were also in good agreement with those with a scan time of 90 min (VT by NLS, r = 0.82, P < 0.001; VT by GA, r = 0.92, P < 0.001). These results suggest that the scan time of 60 min would be valid for clinical studies.
11C-AC-5216 is suitable for the in vivo quantification of PBR in human subjects, because our recent investigation of animal models has indicated roles of PBR-positive microglia and astrocytes in neurodegenerative processes (34,35). Indeed, the monitoring of PBR levels in living brains could provide mechanistic insights into Alzheimer disease and allied dementias, in consideration of the intimate links between amyloid plaques and reactive astrocytes expressing PBR in mice transgenic for amyloid precursor protein (APP) (35), and between the accumulation of phosphorylated tau proteins and PBR-positive microglia in transgenic mice overexpressing a frontotemporal dementia with parkinsonism-17 (FTDP-17) mutant tau (35,36). Although we have also revealed elevated levels of PBR in multiple regions of Alzheimer disease brains as measured with 11C-DAA1106 (28), detection of earlier changes in this component is required for elucidating how the gliotic reactions extensively spread in the course of the aging–disease continuum. In this consideration, our PET assays of PBR in APP and tau transgenics have shown the superiority of 11C-AC-5216 to other existing radioligands in sensitively capturing glial responses to the hallmark pathologies in these animals (Jun Maeda et al., unpublished data), supporting the potential utility of 11C-AC-5216 for the pursuit of neurodegenerative pathologies in humans from an incipient stage.
Accuracy in the measurements of PBR by means of PET would also be critical for gaining statistical power in assessing the neuroinflammatory status after therapies of neurologic conditions. As demonstrated by our PET scans of APP transgenic mice receiving an antibody against amyloid β peptide using 18F-FEDAA1106 and an amyloid-binding radiotracer, 11C-Pittsburgh compound-B (37), PBR and amyloid ligands may conjunctively allow clarification of relationships between amyloid removal and glial activations yielded by the amyloid β immunization. In addition, the amounts of initially existing amyloid were found to positively correlate with the neuroinflammation provoked by the immunization (37), and this observation highlights the need for rigorous regulation of the glial response within an appropriate range to avoid treatment-induced microglial overactivations, which may accelerate tau-associated neuropathologies as proven by our previous study on FTDP-17 mutant tau transgenic mice (36). For this purpose, the analytic methods for 11C-AC-5216-PET data established here would provide an acceptably precise index of therapeutic and adverse effects.
Longitudinal in vivo PBR imaging with 11C-AC-5216 could be used as a powerful tool for quantitatively estimating the neuroinflammatory pathology and outcomes of disease-modifying treatments in neurodegenerative disorders exemplified by Alzheimer disease.
CONCLUSION
The regional distribution of 11C-AC-5216 was in good agreement with previous PET studies using PBR ligand in the human brain, for example, 11C-PK11195 and 11C-DAA1106. BPND estimated from NLS did not correlate with VT estimated from NLS or GA. In this study, the variation of K1/k2 between individuals was larger than that of k3/k4. Thus, BPND is more appropriate than is VT for the quantitative analysis of 11C-AC-5216. 11C-AC-5216 is a promising PET ligand for quantifying PBR in the human brain.
Acknowledgments
We thank Katsuyuki Tanimoto and Takahiro Shiraishi for their assistance in performing the PET experiments at the National Institute of Radiological Sciences. We also thank Yoshiko Fukushima of the National Institute of Radiological Sciences for her help as clinical research coordinator. This study was supported by a grant-in-aid for Molecular Imaging Program from the Ministry of Education, Culture, Sports, Science and Technology (MEXT), Japanese government.
Footnotes
-
COPYRIGHT © 2009 by the Society of Nuclear Medicine, Inc.
References
- Received for publication January 26, 2009.
- Accepted for publication March 12, 2009.


Jump to section
Related Articles
Cited By...
- TSPO is a REDOX regulator of cell mitophagy
- In Vivo Positron Emission Tomographic Imaging of Glial Responses to Amyloid-{beta} and Tau Pathologies in Mouse Models of Alzheimer's Disease and Related Disorders
- 18F-FEAC and 18F-FEDAC: PET of the Monkey Brain and Imaging of Translocator Protein (18 kDa) in the Infarcted Rat Brain