


Abstract
Despite the increased use of statistical mapping to detect brain functional changes in Alzheimer’s disease (AD), potential artifacts introduced by stereotactic anatomic standardization of atrophied brains have not been examined carefully. We investigated the effects of anatomic standardization by Statistical Parametric Mapping (SPM) and NEUROSTAT. Methods: First, 10 AD patients and 10 age-matched healthy volunteers underwent 18F-FDG brain PET imaging. Each image set was standardized to a stereotactic brain template using SPM or NEUROSTAT, followed by pixel normalization to the global or cerebellar activity. Within-group comparisons of standardized image sets by each method and a between-group comparison of healthy volunteers and AD patients were performed using the statistical analysis routines of SPM. Second, simulated PET image sets were generated from segmented MR image sets of 5 healthy volunteers and 5 AD patients. Using the anatomic standardization parameters estimated on the simulated image sets, original gray matter MR image sets were transformed to the stereotactic coordinate system. Between-group subtraction analyses of the transformed gray matter image sets between healthy volunteers and AD groups were performed to examine the accuracy of cortical gray matter matching. Results: Between-group comparison by SPM or NEUROSTAT showed generally similar areas of hypometabolism in bilateral temporoparietal, posterior cingulate, and left frontal cortices. Both methods showed possible deformation artifacts in the anterior part of the corpus callosum. The localization of the peak hypometabolism varied considerably between the two methods when global normalization was applied. The use of a common brain template for standardization resulted in asymmetric differences in cortical margins, indicating systematic differences in the deformation algorithms. The realistic simulation study revealed gray matter mismatches to be 20% greater with SPM than with NEUROSTAT. Conclusion: Although different statistical mapping methods may yield grossly similar patterns of hypometabolism in AD, the extent, severity, and peak location of metabolic changes can be inconsistent. Deformation accuracy appears to be more prone to atrophy. These limitations need to be considered carefully in the application and interpretation of brain mapping analysis in atrophied brains.
Voxelwise comparison of PET and SPECT brain images is a powerful diagnostic tool to elucidate disease-associated functional changes. Initially proposed for SPECT brain image analysis (1), this diagnostic method has been enhanced significantly by the development of anatomic standardization and data extraction techniques (2,3) and has been applied to various investigations of dementing disorders (4–7).
For intersubject comparisons of functional brain images on a voxel-by-voxel basis, individual brain images need to be transformed into a standard coordinate system, such as that proposed by Talairach and Tournoux (8), to compensate for individual variability in size and shape. Several methods for the anatomic standardization of brain images have been developed, including Human Brain Atlas (Department of Neuroscience, Karolinska Institute, Stockholm, Sweden) (9); Statistical Parametric Mapping ([SPM] The Wellcome Department of Neurology, London, U.K.) (10–12); and NEUROSTAT (Department of Internal Medicine, University of Michigan, Ann Arbor, MI) (13–15). For Human Brain Atlas, MR images are used for transformation, and accuracy is limited by the accuracy of registration between PET/SPECT and MR images and identification of brain structures by observers. In addition, MR images are not always readily available on-line for routine clinical cases or even for research studies. With SPM and NEUROSTAT, PET or SPECT data can be transformed into a standard coordinate system without MR images, and both of these approaches are used at various institutions for both research and clinical studies.
When anatomic standardization techniques are applied to diseased brains, however, potential artifacts can be introduced. This effect has not been examined carefully. SPM was developed originally as a research tool for PET activation studies on healthy volunteers and was not intended for clinical use with diseased brains. The application to atrophic brains, as seen with Alzheimer’s disease (AD), has not been well validated except by empiric applications and observations. Signorini et al. (16) reported that they applied SPM for glucose metabolic images of six patients with AD and evaluated the clinical validity of SPM. In contrast, NEUROSTAT was developed specifically to overcome these potential artifacts by the use of a novel data extraction technique, namely three-dimensional stereotactic surface projection, for statistical comparisons between a normal database and diseased brains (3). However, the accuracy of the anatomic standardization algorithm has not been examined thoroughly in atrophic brains. To properly interpret results and appropriately apply brain mapping techniques to diseased brains, one must understand the potential limitations of the analysis. The purpose of this study was to assess the accuracy of two commonly used techniques, SPM and NEUROSTAT, in the anatomic standardization of normal brains and brains atrophied from AD and to estimate potential artifacts introduced in voxel-by-voxel statistical group comparisons between normal and atrophied brains.
MATERIALS AND METHODS
This study used clinical PET data and simulated PET data from actual brain MR images of healthy volunteers and AD patients for validations. The use of simulated PET data generated from actual anatomic data permitted objective comparisons of anatomic standardization accuracy with different analytic methods.
Clinical PET Data
Twenty subjects were recruited for the study, including 10 patients with AD (3 women, 7 men; mean age ± SD, 63.0 ± 6.8 y; Mini-Mental State Exam score, 17.4 ± 4.5; clinical dementia rating, 1.6 ± 0.5) and 10 age-matched healthy volunteers (6 women, 4 men; mean age, 62.0 ± 8.9 y). The diagnosis of AD was established using the criteria of the National Institute of Neurological Disease and Stroke/Alzheimer’s Disease and Related Disorders Association for probable AD (17). Written informed consent was obtained from all subjects. The study protocol was approved by the institutional ethics committee and the radiation protection authorities. PET images were obtained using a 951R/31 PET scanner (Siemens Medical Systems, Inc., Hoffman Estates, IL) for 13 subjects or an ECAT EXACT PET scanner (CTI, Knoxville, TN) for 7 subjects. A transmission scan was obtained using a 68Ga/68Ge pin source for attenuation correction. Emission scans were acquired in two-dimensional mode with a total axial field of view of either 10.5 or 16.2 cm and no interplane dead space. PET studies were performed with the subjects under resting conditions with eyes closed and ears unplugged, comfortably lying in a darkened and quiet room. All subjects fasted for at least 4 h before PET scanning. Thirty minutes after injection of 370 MBq 18F-FDG, a sequence of three 10-min frames was acquired and later summated into a single frame. Images were reconstructed by filtered backprojection with a Hanning filter (cutoff frequency at 0.5 cycles per projection element) in both scanners. The dimensions of the reconstructed PET images were 128 × 128 with a pixel size of 1.99 × 1.99 mm and an interslice distance of 3.375 mm (no gap space).
Simulation PET Data
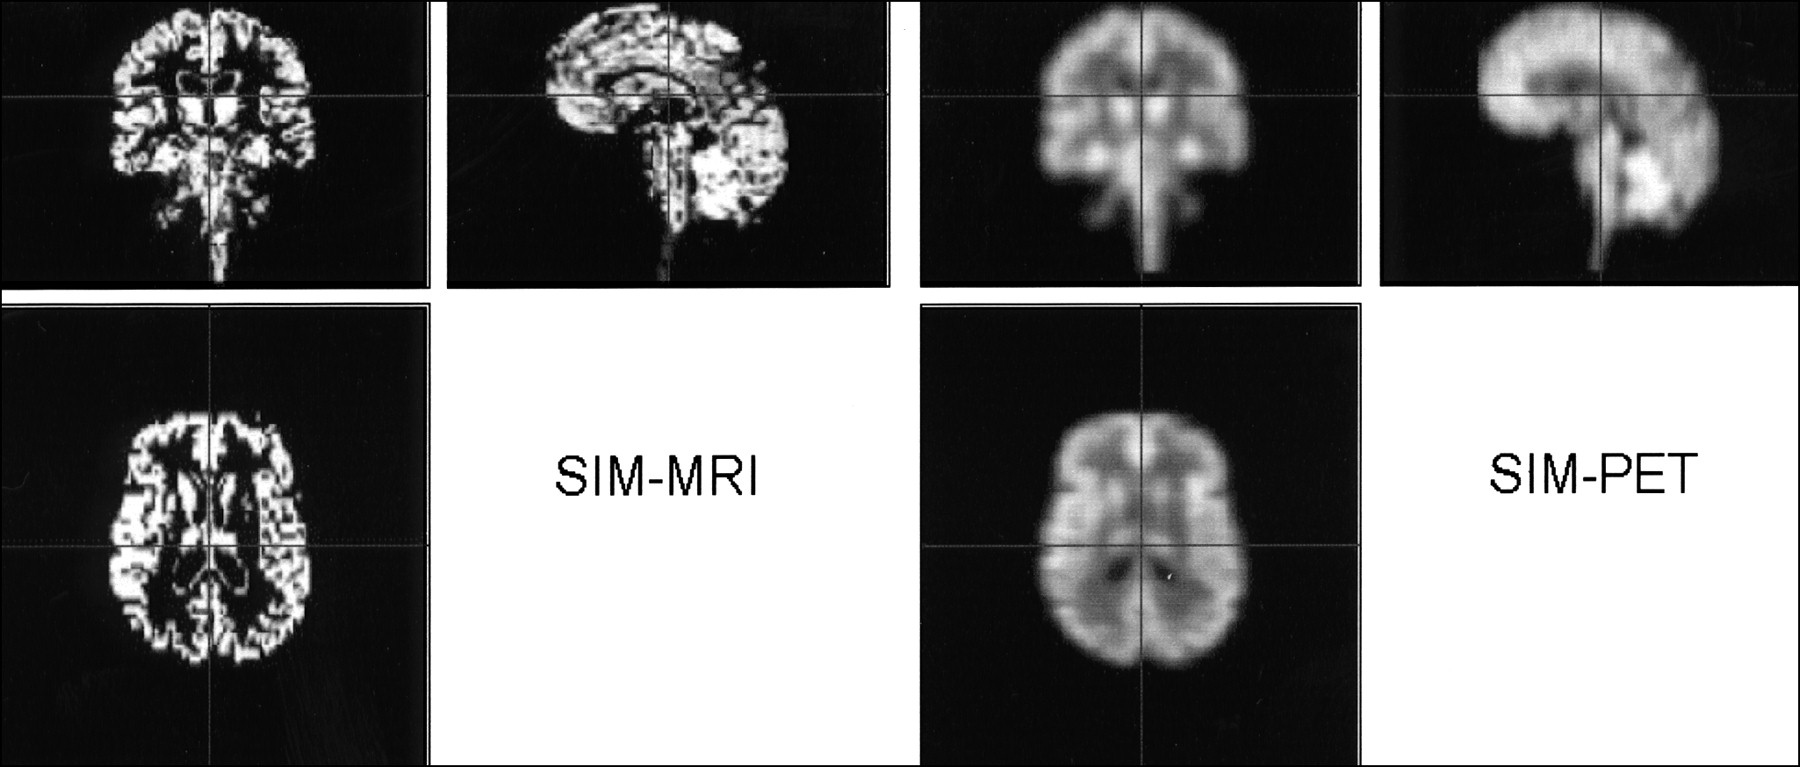
Five healthy volunteers (three women, two men; mean age, 66.8 ± 4.0 y) and five patients with AD (three women, two men; mean age, 64.8 ± 5.2 y; clinical dementia rating, 1 in all subjects) underwent MRI. Coronal MR images (1.5-T Advance scanner; General Electric Medical Systems, Milwaukee, WI) were acquired in three-dimensional mode with a gradient-echo pulse sequence using spoiled gradient-recalled acquisition in the steady state (repetition time, 40 ms; echo time, 3 ms; one excitation). The image dimensions were 256 × 256 × 60, with an approximate in-plane pixel size of 0.8 mm and a slice thickness of 3 mm. The MR images were segmented into regions of cerebrospinal fluid, white matter, and gray matter using probabilistic histogram analysis (18). To reduce segmentation noise and encourage well-defined regions, weights based on the neighboring probabilities were included to determine the class of the region. An index of atrophy calculated as the gray matter volume of the whole brain based on the segmented MRI data showed a 5.7% reduction in AD patients compared with healthy volunteers. Simulated ECAT EXACT PET image sets (two-dimensional mode acquisition) were generated from segmented MR images. Gray matter voxels were assigned an activity concentration of 4 MBq/mL, white matter voxels were assigned an activity concentration of 1 MBq/mL, and the activity concentration for cerebrospinal fluid was 0 MBq/mL. Two-dimensional PET sinograms were simulated for the ECAT EXACT geometry, as 128 × 192 sinograms with a projection bin width of 3.375 mm and a detector efficiency of 0.66%. Photon dispersion and scatter were included in the simulated sinogram data using spatially invariant convolution kernels. Poisson noise was included in the emission sinograms. The transmission sinograms were noise free, resulting in an ideal attenuation correction. The simulated attenuation-corrected emission sinograms were reconstructed using filtered backprojection with a Hanning filter having a frequency cutoff of 0.5. The dimensions of the reconstructed PET images were 128 × 128, with a voxel size of 3.375 mm. Corresponding segmented MRI gray matter was set to 400 for subsequent analyses (Fig. 1).

Segmented MR and simulated PET images from 58-y-old woman with AD (Mini-Mental State Exam score = 14). SIM-MRI = segmented MR images (gray matter); SIM-PET = simulated PET images using segmented MR images.
Anatomic Standardization
Two commonly used anatomic standardization techniques, NEUROSTAT and SPM99, were evaluated.
NEUROSTAT.
A SunOS version of NEUROSTAT was implemented on a UNIX machine (SPARC 20; Sun Microsystems, Mountain View, CA). Image sets were written in the CTI format. Anatomic standardization of FDG PET image sets was performed using a part of a program set that generates standardized three-dimensional stereotactic surface projection datasets for individual subjects (3). In this algorithm, an individual brain image set was first realigned to the midsagittal plane (13). The AC-PC line (a line passing through the anterior and posterior commissures) was estimated by iterative matching between the individual image set and a standard atlas template. This standard atlas template was produced as an average of FDG images from 66 healthy volunteers. The template was created using a nonlinear stereotactic deformation method originally developed in 1993 (14). The right hemisphere was inverted and copied to the left hemisphere to make the template symmetric. The individual image set was realigned to the standard stereotactic coordinate system based on the estimated AC-PC line. Differences in size between the individual brain and the standard template were removed by linear scaling. For this process, nine affine transformation parameters were estimated. To adjust the individual brain shape to the stereotactic atlas coordinate system proposed by Talairach and Tournoux (8), nonlinear warping along the directions of major neuronal fiber bundles within the brain was performed. The directions were predefined in the stereotactic coordinate space on the basis of the fiber origins and their cortical projections (15). Individual landmarks for cortical projections were searched iteratively between centers and cortical landmarks predetermined on the template brain using a profile curve analysis. Detected individual landmarks were then warped to predefined landmarks, resulting in a standardized image set with a uniform voxel size of 2.25 mm, interpolation to 60 slices, and a matrix size of 128 × 128.
SPM.
SPM99 software was installed on a UNIX machine (O2; SGI, Mountain View, CA). Calculations and image matrix manipulations were performed in MATLAB 5.3 (The MathWorks, Inc., Natick, MA). For SPM99, all the CTI format image datasets were converted to ANALYZE format and displayed as the right hemisphere on the right. In SPM99, the first step of the normalization was to determine the optimum 12-parameter affine transformation. Next, nonlinear deformation of individual brain shape was performed by a linear combination of three-dimensional discrete cosine transform basis functions. For default value results, each of the deformation fields was described by 1,176 parameters, which represented the deformation coefficients in three orthogonal directions. Matching involved simultaneous minimization of membrane energies from the deformation fields and the residual squared difference between the images and template (12). For anatomic standardization, the number of nonlinear basis functions was set to 7 × 8 × 7, the number of iterations to 12, and the nonlinear regularization to medium. These default parameters were suggested by SPM. The maximum number of iterations (n = 16) was also tested to evaluate any additional improvement of results; however, warping at this number was extremely slow. Other parameters for normalized image set output by SPM99 were as follows: bounding box, −90 −91, −126 91, −72 109; voxel sizes, 2 × 2 × 2 mm; image size, 91 × 109 × 91; and origin, (46, 64, 37). Created with 15O-H2O PET images, the SPM PET template may not be ideal for FDG image processing, because image contrast differs from FDG images. For the comparison between SPM99 and NEUROSTAT, the analysis was performed with a common FDG PET template (NEUROSTAT). When a NEUROSTAT template was used, the bounding box was set to −141.75:145.25 −157.5:129.50 −60.75:73.25, voxel sizes were 2.25 × 2.25 × 2.25 mm, image size was 128 × 128 × 60, and origin was (64, 71, 28). Additionally, we performed SPM99 analysis with the original SPM template that was created from 15O-H2O PET images. In this case, we used the original bounding box, voxel size, and origin of SPM99.
Comparison and Validation of NEUROSTAT and SPM.
After anatomic standardization by each method, clinical PET data were compared using the statistical analysis component of SPM99. The image sets were smoothed with an isotropic gaussian filter (12 mm full width at half maximum), and individual global counts were normalized by proportional scaling to a mean value of 50 mg/100 mL/min. This arbitrary value was derived from mean cerebral blood flow but used conventionally in this analysis. In addition, voxel values of each individual image set were normalized to the cerebellar activity because cerebellar glucose metabolism is relatively preserved in AD. Cerebellar reference values were measured by region-of-interest analysis on original PET image sets. Normalized datasets from healthy volunteers and AD patients were compared on a voxel-by-voxel basis using a two-sample t statistic test (t values were converted to z scores). For comparison of the methods, voxels exceeding a threshold of P < 0.02 (uncorrected for multiple comparisons) by a two-sided t statistic test for proportional scaling of global normalization and P < 0.002 (uncorrected) by a two-sided t test for cerebellar normalization were displayed as a volume image rendered in three orthogonal projections. Areas of significant metabolic reduction in AD patients were assessed using both spatial extent and peak value and compared with the areas of metabolic reductions shown previously in AD patients (3).
Using a common NEUROSTAT template to standardize image sets of healthy volunteers and AD patients, NEUROSTAT and SPM methods were compared directly using voxel-by-voxel one-sample (paired) t tests. The results were displayed as volume-rendered images in three orthogonal projections (P < 0.05, uncorrected). This statistical threshold for image display was determined to appreciate a wide range of the statistical differences between the two standardization methods but to be high enough to distinguish separate clusters of differences.
Simulated PET data and segmented MR image sets were used to directly assess residual regional anatomic variations after anatomic standardization. Anatomic standardization parameters were estimated on the simulated PET image sets using either NEUROSTAT or SPM99 with a common template. Corresponding original gray matter MR image sets (gray matter = 400) were then transformed to the standard stereotactic coordinate system using the estimated transformation parameters. For each method, the transformed gray matter MR image sets were averaged across healthy volunteers and AD patients. Subtraction image sets between averaged gray matter maps of healthy volunteers and AD patients were generated for each method without pixel normalization. With an “ideal” anatomic standardization process, resultant subtraction maps should exhibit zero positive or negative pixels.
RESULTS
Clinical PET Data
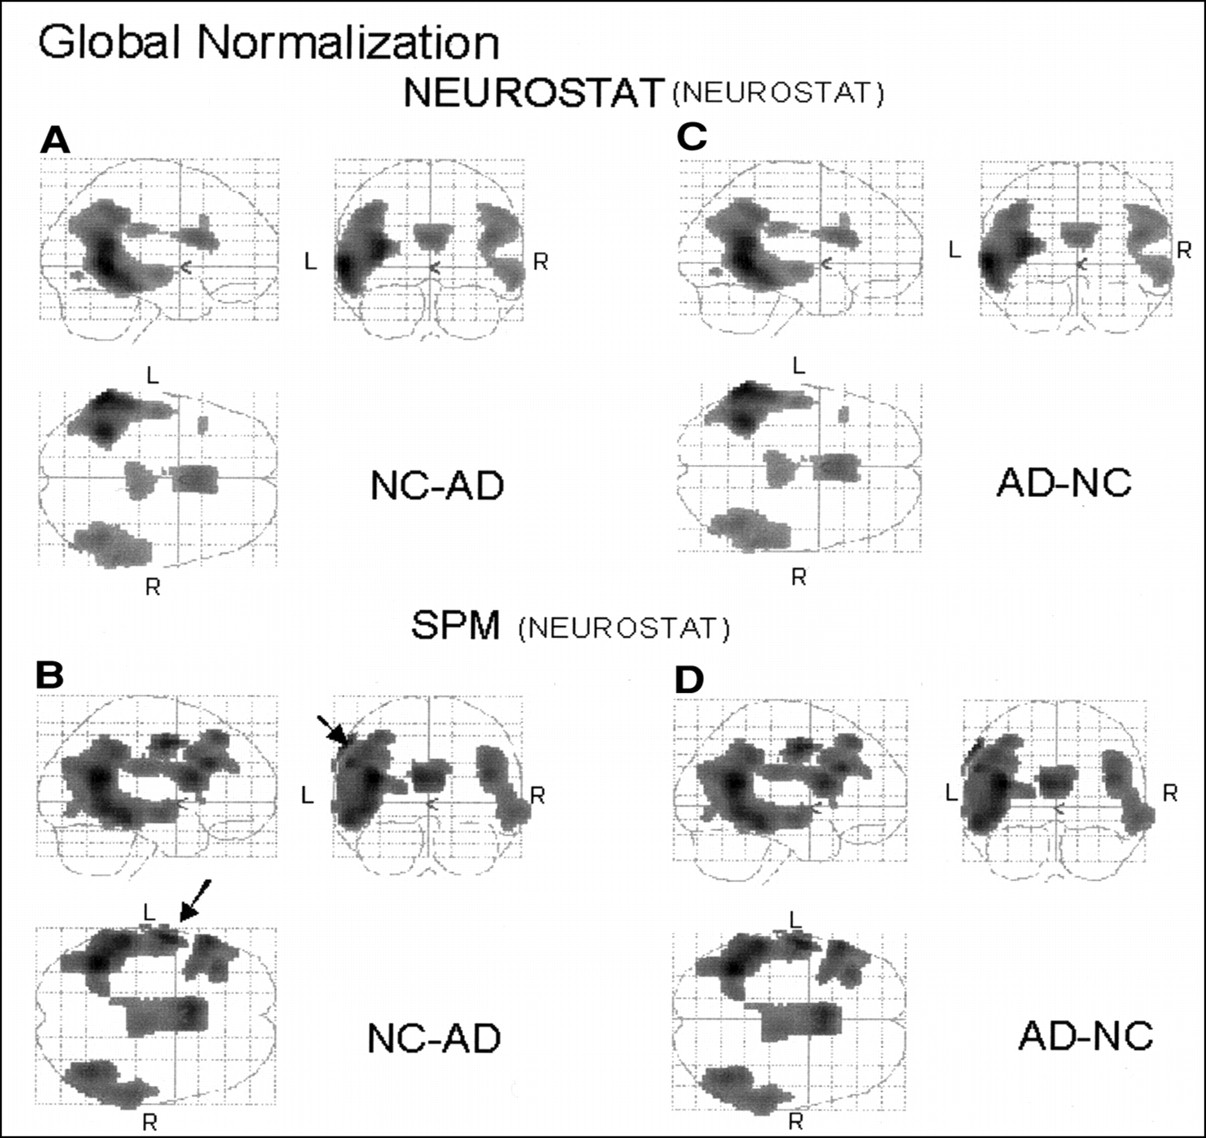
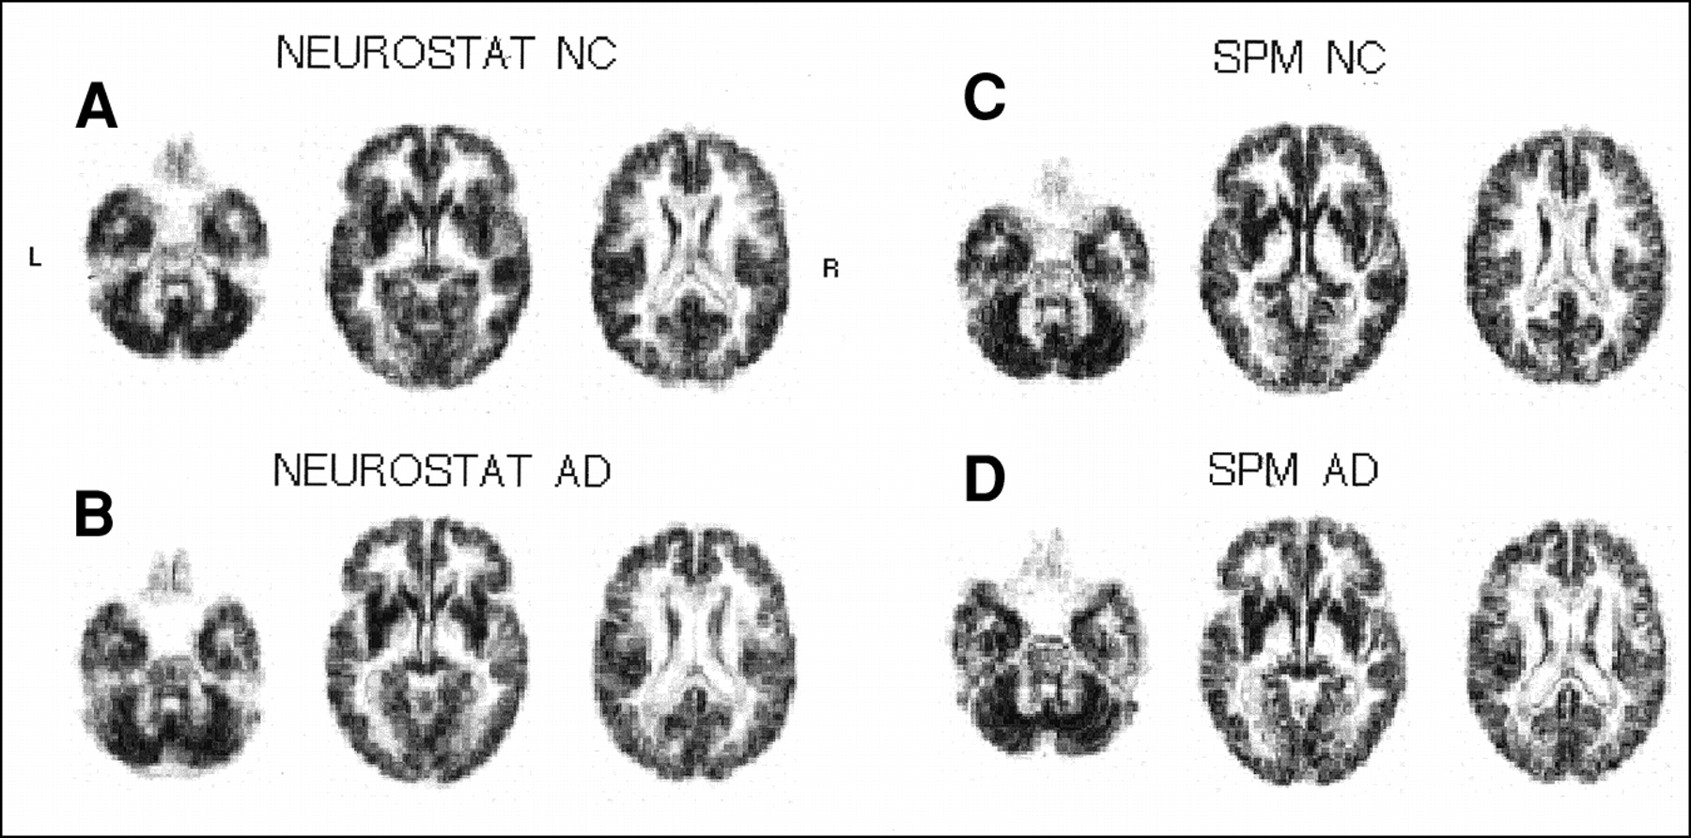
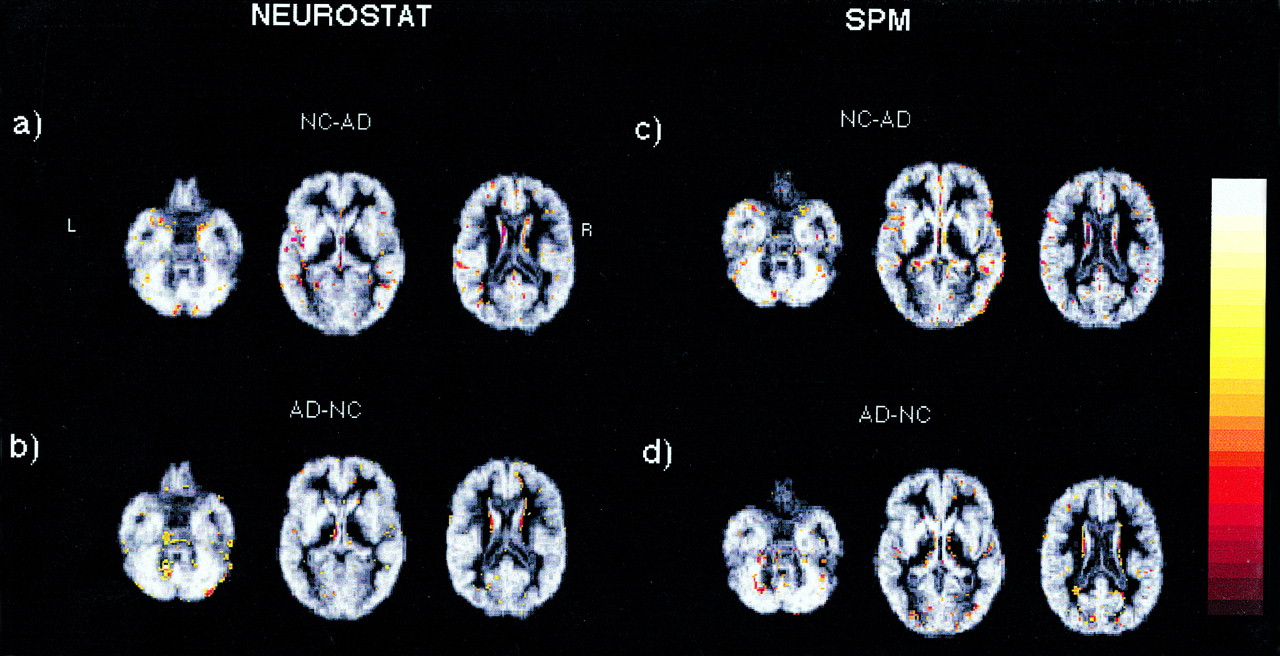
When comparing the relative glucose metabolism of healthy volunteers with that of AD patients, SPM and NEUROSTAT methods showed areas of metabolic reduction that were generally consistent with previous findings (Figs. 2–4). After global normalization, regional metabolic activities in the parietotemporal and posterior cingulate cortices in AD patients were decreased compared with those in healthy volunteers (Figs. 2A and B). In addition, both methods revealed relatively decreased metabolic activities in the left frontal cortex (Fig. 2B) and the trunk of the corpus callosum in AD (Figs. 2A and B). The areas of decrease were estimated to be more extensive by SPM (9,817 voxels with global normalization; 20,711 voxels with cerebellar normalization) than by NEUROSTAT (7,373 voxels with global normalization; 18,277 voxels with cerebellar normalization) using a common template (Figs. 2A and B and 3). In contrast, the most significant peak t value was estimated greater by NEUROSTAT (t = 6.33 with global normalization; t = 8.68 with cerebellar normalization) than by SPM (t = 5.30 with global normalization; t = 7.82 with cerebellar normalization) (Table 1). SPM analysis with an SPM template resulted in similar general regional patterns of metabolic changes (Fig. 4), but the extent and peak height were not identical, presumably because of the difference in template shape. However, even with a common template for anatomic standardization, differences in the peak coordinates of significant reductions remained between the two standardizing methods after global normalization (Table 1). The distance between the highest peaks estimated by each method was 30.9 mm in the standard atlas space. After normalization to the cerebellum, the peak coordinates became nearly identical with either method (Table 1), with a distance of 2.0 mm. Visual inspection of the group comparison maps identified subtraction artifacts near the surface of the cortex and the border of the ventricles in the results processed by SPM. These artifacts were on the left sensorimotor cortical surface, where glucose metabolism is known to be preserved (processed with a common NEUROSTAT template) (Fig. 2B, arrows) and at the edge of the ventricles bilaterally (processed with an original SPM template) (Fig. 4A, arrows). The artifacts along the edge of the bilateral ventricle systems were also evident after normalization to the cerebellum (Fig. 4C, arrows).

Comparison of patients with AD and healthy volunteers shown in orthogonal brain projections. Highlighted areas indicate regions with significant decreases (NC-AD) or increases (AD-NC) in relative glucose metabolism normalized to global mean at threshold of P < 0.02. Figure shows results standardized by NEUROSTAT using NEUROSTAT template (A and C) and results standardized by SPM using NEUROSTAT template as common template (B and D). Obvious artifact (B, arrows) was shown in left frontal surface on orthogonal image standardized by SPM. NC = healthy volunteer.

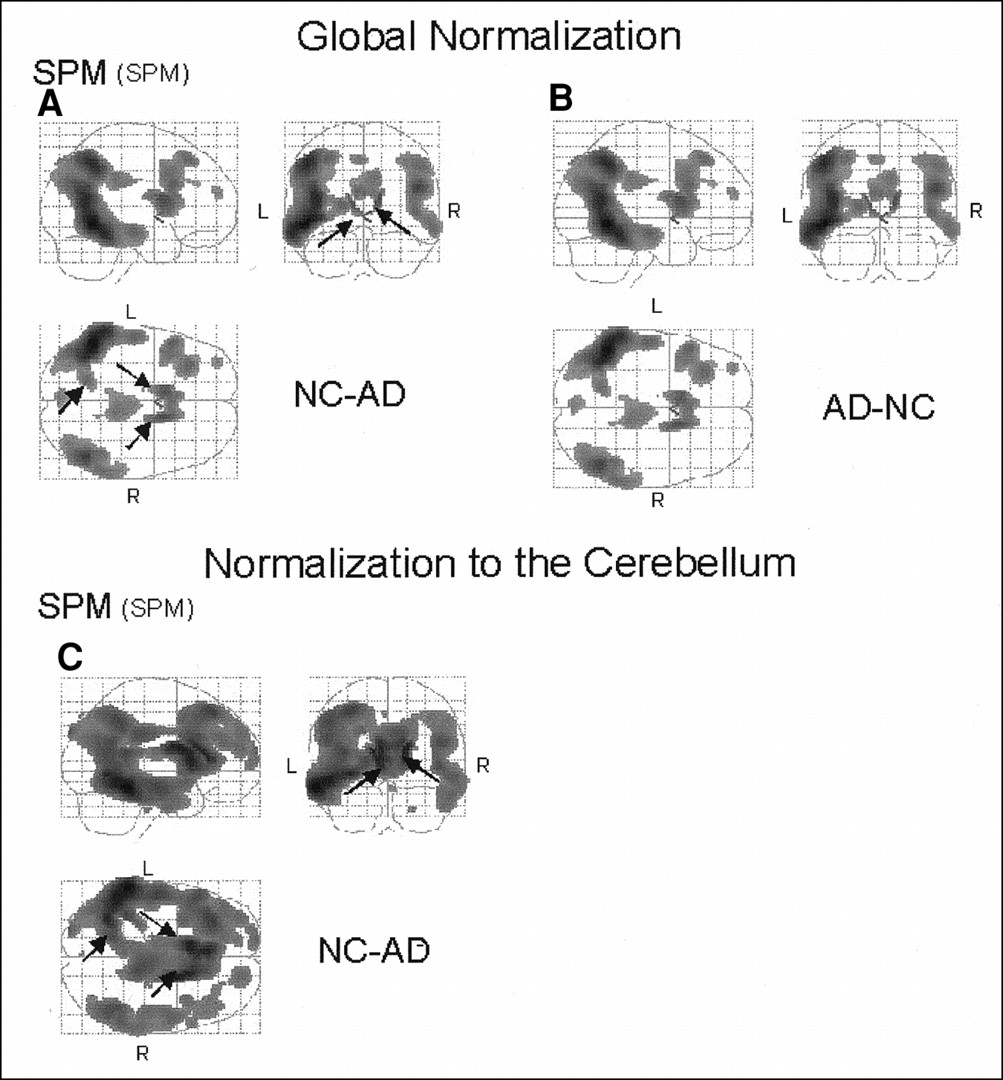
Comparison of patients with AD and healthy volunteers shown in orthogonal brain projections. Highlighted areas indicate regions with significant decreases (NC-AD) in relative glucose metabolism normalized to cerebellar metabolism at threshold of P < 0.002. Figure shows results standardized by NEUROSTAT using NEUROSTAT template (A) and results standardized by SPM using NEUROSTAT template as common template (B). NC = healthy volunteer.

Comparison of patients with AD and healthy volunteers shown in orthogonal brain projections. Highlighted areas indicate regions with significant decreases (NC-AD) or increases (AD-NC) in relative glucose metabolism normalized to global mean at threshold of P < 0.02 (A and B) and normalized to cerebellar metabolism at threshold of P < 0.002 (C). All images were standardized by SPM using SPM original template. Arrows show artifacts caused by dilation of ventricles. NC = healthy volunteer.
Peak Location of Significant Decrease in AD Group Compared with NC
With global normalization, relative metabolic activities in areas that are known to be preserved in AD, namely the primary visual cortex, thalamus, and basal ganglia, were estimated to be greater in AD patients than in healthy volunteers. In addition, the base of the frontal lobe, the superior portion of the vermis and cerebellar hemisphere, and the region inside the sensorimotor cortices were also estimated to be greater in AD (Figs. 2C and D). This relative increase in normalized metabolism seen with AD was caused by the decrease in the association cortices. In this regard, the more extensive areas of relative increase in AD estimated by NEUROSTAT (12,146 voxels), compared with SPM (6,562 voxels), were consistent with the less extensive relative decrease seen by NEUROSTAT.
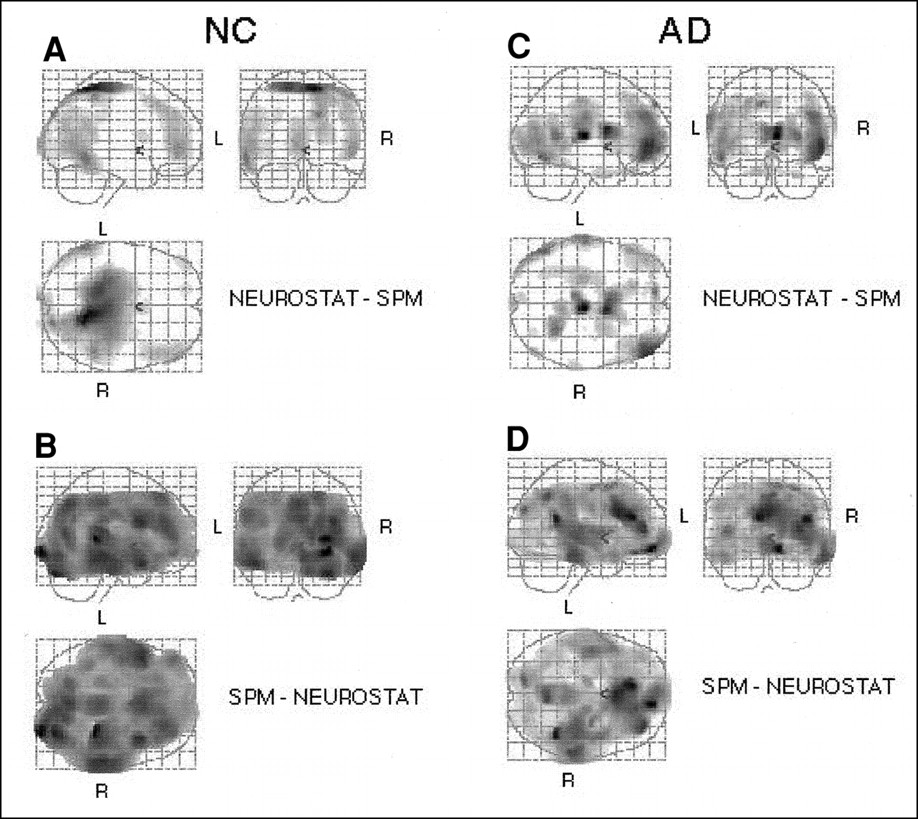
The direct comparison of the NEUROSTAT and SPM anatomic standardization algorithms using a common template resulted in apparent discrepancies at the edges of transformed image sets (Fig. 5). Moreover, the differences were asymmetric. Image sets of healthy volunteers transformed by SPM showed the left posterior and right anterior portions of the brain to be larger, compared with those transformed by NEUROSTAT (Figs. 5A and B). The comparison in AD patients showed additional highly significant differences at ventricular surfaces (Figs. 5C and D). Increasing the iteration parameter from 12 to 16 for the SPM analysis did not improve the consistency between the two methods.

Direct comparison of images standardized by NEUROSTAT and SPM in healthy volunteers and patients with AD. For healthy volunteers, highlights show significantly higher values for images standardized by NEUROSTAT than for images standardized by SPM (A) and for images standardized by SPM than for images standardized by NEUROSTAT (B). For patients with AD, highlights show significantly higher values for images standardized by NEUROSTAT than for images standardized by SPM (C) and for images standardized by SPM than for images standardized by NEUROSTAT (D). NC = healthy volunteer.
Simulation Data
Parameters for anatomic standardization were estimated using simulated PET image sets, and original segmented gray matter MR image sets were transformed to the standard stereotactic system and then averaged across subjects. The total pixel values of the averaged, segmented gray matter MR images (original gray matter pixel = 400) were 30.0 × 10⁶ by SPM and 29.8 × 10⁶ by NEUROSTAT in the healthy group and 27.7 × 10⁶ by SPM and 28.3 × 10⁶ by NEUROSTAT in the AD group (Figs. 6). In AD, the longitudinal cerebral fissure was widened, and the ventricle systems were dilated on transformed image sets, indicating insufficient anatomic standardization of atrophied brains by either method (Figs. 6B and D). Image subtraction between standardized image sets of healthy volunteers minus those of AD patients processed by SPM showed noticeable gray matter mismatches in the right frontal and temporal lobes (Fig. 7C). Mismatches at the ventricular surfaces, shown as rimlike subtraction artifacts (Fig. 7), were noted by both methods. The total pixel values of the subtraction image set between the averaged healthy and AD MR images, calculated as a global index of gray matter mismatch, were 2.37 × 10⁶ (positive = 1.53 × 10⁶, negative = 0.83 × 10⁶) by SPM and 1.98 × 10⁶ (positive = 1.06 × 10⁶, negative = 0.92 × 10⁶) by NEUROSTAT. These values equaled a 20% greater mismatch in whole-brain gray matter by the SPM transformation algorithm.

Mean simulated MR images standardized by NEUROSTAT in healthy volunteers (A) and in patients with AD (B) and standardized by SPM in healthy volunteers (C) and in patients with AD (D). NC = healthy volunteer.

Positive- and negative-value pixels of subtracted images from mean healthy volunteer group images minus mean AD group images standardized by NEUROSTAT (A and B) and by SPM (C and D) are superimposed onto corresponding MR images in Figures 6A–D. NC = healthy volunteer.
DISCUSSION
We evaluated the effects of stereotactic anatomic standardization by SPM and NEUROSTAT in the application of statistical comparisons between healthy volunteers and AD patients. Although the general pattern of metabolic reductions shown by the two methods was similar, differences were seen in the localization, extent, and significance of estimated metabolic reductions. The simulation study revealed residual mismatches of gray matter structures between healthy volunteers and AD patients that could produce pseudo metabolic reductions. SPM was more prone to such mismatches as evidenced by the validation using simulated PET image sets. Evaluation of anatomic standardization techniques has often been confounded by lack of a gold standard. The use of realistically simulated PET image sets based on MR image sets of actual healthy volunteers and AD patients served as a gold standard validation to which interpretation of clinical data could be referenced.
Comparison between healthy and AD groups showed a parietotemporal metabolic reduction with AD that has been reported extensively. Metabolic decreases in the anterior trunk of the corpus callosum were detected by both SPM and NEUROSTAT when glucose metabolism was not known to be decreased substantially. This pseudo metabolic reduction produced in structures near the dilated ventricles was caused by mismatches at the edges of the ventricles as shown by the simulation results and was identified readily on the resultant statistical maps (Figs. 4A and C, arrows). Artifacts resulting from inaccuracy in stereotactic transformation occur conspicuously in atrophic brains but also in normal brains. The most common artifact occurs in the slightly widened interhemispheric space and produces pseudo metabolic reduction in the medial frontal or parietal cortex, as was indicated in a group comparison between AD patients and healthy volunteers (19). Simple subtraction analysis is particularly prone to these artifacts. Extraction of three-dimensional stereotactic surface projection data after anatomic standardization was developed specifically to reduce such artifacts by searching cortical peak activities (3,19). A widened interhemispheric fissure after anatomic standardization was also confirmed by our simulation data. Areas of decreased metabolism, such as the temporoparietal association cortices in AD, are also associated with atrophy (20). Therefore, when subtraction analysis is performed using anatomic standardization methods, areas of metabolic reductions shown on the resultant maps contain heterogeneous sources of information including true metabolic reductions, inaccurate gray matter matching by anatomic standardization, and volume loss caused by atrophy. This fact raises a caution in the biologic interpretation of statistical brain mapping of diseased brains. However, for the clinical purpose of disease detection, a strict distinction among these factors may not be necessary because all are disease-associated processes. Partial-volume effects may in fact increase the sensitivity in separating diseased brains from normal brains.
The extent of metabolic reductions in AD estimated by SPM was greater than that estimated by NEUROSTAT. However, this does not indicate simply greater sensitivity. As shown with simulation data and discussed above, greater mismatches in anatomic standardization can result in erroneously large estimates of metabolic reductions caused by atrophy. The results also indicated that the estimated extent of metabolic reductions depended on both the method of anatomic standardization and the method of pixel normalization. For the AD brain, global normalization tends to underestimate the magnitude and extent of metabolic reductions because of widespread metabolic reductions throughout the brain. Normalization to relatively spared regions such as the cerebellum more accurately depicts areas of regionally accentuated metabolic reductions. The locations of peak metabolic reduction in AD were also influenced by anatomic standardization and pixel normalization methods. Global normalization produced inconsistent localization of peak metabolic reduction, partially because of extensive hypometabolism affecting global activity. Caution should be exercised when comparing peak metabolic reductions in neurodegenerative diseases across different institutions using different analytic methods.
The direct comparison between the two standardization methods using a paired t test gave a unique result. Even using the same template, the resultant images were different (Fig. 5). This difference was particularly conspicuous at the margin of the cortex. NEUROSTAT showed higher values at the outer cortical edges of the left temporal and right frontal areas in both healthy and AD groups, whereas SPM showed such values at the right temporal area. These differences were caused by differences in the intrinsic performance of the algorithm used by each method, including image-matching functions, pixel interpolation methods, and a problem with axial rotation. The NEUROSTAT algorithm uses a priori knowledge of brain anatomy and deforms a brain shape along the direction of cortical projection fibers. This process may have a particular advantage in the standardization of atrophied brains, in which many of these fibers are lost and corresponding cortices are displaced. In contrast, SPM deformation relies on pure mathematic functions, and greater amounts of structural displacement, such as severe atrophy associated with neurodegeneration, cannot be corrected fully. The cortical landmarks and medial hemispheric identification points of NEUROSTAT for nonlinear stretching seem to produce a stronger and more accurate anatomic transformation. The ventricular surfaces where cortical fiber projections cannot be defined precisely showed noticeable artifacts with NEUROSTAT as well as SPM.
The use of realistically simulated PET image sets from actual patients’ MR image sets provides a unique gold standard for the evaluation of anatomic standardization. Sugiura et al. (21) evaluated standardization of Human Brain Atlas and SPM95. Using PET transformation parameters estimated from linear scaling, they compared the brain size and contour and the course of some central sulci of transformed MR images. However, this study did not distinguish the accuracy of PET–MRI registration (up to a few millimeters) from that of image deformation, and only contours were evaluated, not the whole gray matter, which is the interest of most image analyses. Such validation also cannot assess the effects of cortical atrophy. By simulating realistic PET images from actual MR images, we could specifically assess the accuracy of regional gray matter matching within the whole brain on a voxel-by-voxel basis. Inspection of individual transformed MR image sets did not show gross deformation artifacts in particular subjects, biasing the averaged result. When MR images of healthy volunteers were subtracted from MR images of AD patients, total mismatches of gray matter were fewer by NEUROSTAT than by SPM. However, both NEUROSTAT and SPM methods produce artifacts along the ventricular edges (Fig. 7), as also seen in clinical data. Although the number of voxels that are aligned consistently across subjects far exceeds that of mismatched voxels, such mismatches introduce a false functional reduction in atrophied brains. A need for further improvement of both algorithms is indicated.
CONCLUSION
Although the general patterns of metabolic decrease with AD patients compared with healthy volunteers were similar using either NEUROSTAT or SPM, substantial differences were found between the two methods in the magnitude, peak localization, and statistical significance of metabolic changes. SPM was more affected by the presence of atrophy, and both methods were prone to artifacts along the ventricular edges. These potential sources of error should be considered when interpreting the results from statistical mapping of atrophied brains, such as are seen in AD.
Acknowledgments
This study was supported in part by Nasjonalforeningen for folkehelsen of Norway and by grant DE-FG02-87-ER60561 from the U.S. Department of Energy.
Footnotes
Received Jul. 10, 2000; revision accepted Dec. 11, 2000.
For correspondence or reprints contact: Frode Willoch, MD, Nuklearmedizinische Klinik und Poliklinik, Klinikum rechts der Isar, Technische Universität München, Ismaninger Strasse 22, 81675 München, Germany.
REFERENCES
In this issue


Jump to section
Related Articles
Cited By...
- 18F-FDG PET Imaging in Neurodegenerative Dementing Disorders: Insights into Subtype Classification, Emerging Disease Categories, and Mixed Dementia with Copathologies
- Altered Bile Acid Profile in Mild Cognitive Impairment and Alzheimers Disease: Relationship to Neuroimaging and CSF Biomarkers
- Time Courses of Cortical Glucose Metabolism and Microglial Activity Across the Life Span of Wild-Type Mice: A PET Study
- 18F-Florbetapir PET in Patients with Frontotemporal Dementia and Alzheimer Disease
- Multicenter Standardized 18F-FDG PET Diagnosis of Mild Cognitive Impairment, Alzheimer's Disease, and Other Dementias
- Positron emission tomography imaging in dementia
- Validation of a Standardized Normalization Template for Statistical Parametric Mapping Analysis of 123I-FP-CIT Images
- Role of Neuroimaging in Alzheimer's Disease, with Emphasis on Brain Perfusion SPECT
- Cerebral Activation During Withholding Urine with Full Bladder in Healthy Men Using 99mTc-HMPAO SPECT
- Prediction of Individual Clinical Outcome in MCI by Means of Genetic Assessment and 18F-FDG PET
- Molecular, Structural, and Functional Characterization of Alzheimer's Disease: Evidence for a Relationship between Default Activity, Amyloid, and Memory
- Cerebral glucose metabolism in patients with AD and different APOE genotypes
- Superiority of 3-Dimensional Stereotactic Surface Projection Analysis over Visual Inspection in Discrimination of Patients with Very Early Alzheimer's Disease from Controls Using Brain Perfusion SPECT
- Novel insertional presenilin 1 mutation causing Alzheimer disease with spastic paraparesis
- Prediction of Hyperperfusion After Carotid Endarterectomy by Brain SPECT Analysis With Semiquantitative Statistical Mapping Method
- Analysis of Clinical Brain SPECT Data Based on Anatomic Standardization and Reference to Normal Data: An ROC-Based Comparison of Visual, Semiquantitative, and Voxel-Based Methods