


Abstract
In Alzheimer’s disease (AD), regional cerebral blood flow (rCBF) in the posterior cingulate gyri and precunei has been reported to decrease even at a very early stage. It may be helpful to use statistical image analysis to distinguish slight decreases in rCBF in this area. We compared a 3-dimensional stereotactic surface projection (3D-SSP) technique with visual inspection in the discrimination of patients with very early AD from age-matched controls using brain perfusion SPECT. Methods: SPECT was obtained in 38 patients with probable AD at a very early stage and after a mean interval of 15 mo and in 76 age-matched healthy volunteers. We randomly divided these subjects into 2 groups. The first group was used to identify the areas with significant decreases of rCBF in patients compared with healthy control subjects based on the voxel-based analysis using 3D-SSP. The second group was used to compare the discrimination ability between patients and control subjects by 3D-SSP with that by visual inspection. In the second group, a Z-score map for a SPECT image of a subject was obtained by comparison with mean and SD SPECT images of control subjects for each voxel after anatomic standardization and voxel normalization to reference regions. Receiver operating characteristic (ROC) curves for a Z-score discriminating patients with AD from control subjects were analyzed in areas with significant decreases of rCBF identified in the first group. For visual inspection, 6 physicians graded the rCBF decrease on SPECT images for ROC curves. They inspected the images twice at an interval of >2 wk, and intra- and interobserver reliabilities were determined. Results: Visual inspection showed fair-to-excellent intra- and interobserver reliabilities. The 3D-SSP demonstrated an accuracy of 86.2% for discriminating patients with AD from control subjects when analyzing the posterior cingulate gyri and precunei with global mean normalization. In contrast, visual inspection did not show an accuracy of >74.0% for this discrimination. Conclusion: The ability of 3D-SSP to discriminate patients with very early AD from control subjects is superior to that of visual inspection. It is clinically useful and reliable to adopt the use of 3D-SSP as an adjunct to visual interpretation.
In a very early stage of Alzheimer’s disease (AD), even before a clinical diagnosis of probable AD is possible, decreases in regional cerebral blood flow (rCBF) and glucose metabolism in the posterior cingulate gyri and precunei have been reported using PET (1,2) or SPECT (3,4). Pathologic degeneration of neurons in this area had already been reported in subjects with early AD before these neuroimaging findings became apparent (5). However, it is virtually impossible to distinguish a slight decrease of flow or metabolic activity in this area in subjects with early AD by visual inspection, since metabolic activity in the posterior cingulate cortex is as high as in the primary visual cortex in healthy individuals at rest (2). The fact that recent medications such as cholinesterase inhibitors delay the progression of AD (6) has increased the importance of diagnosis of AD at an earlier stage. Although recent advances in computer-assisted analysis of PET or SPECT images using 3-dimensional stereotactic surface projection (3D-SSP) (1,2,7) or statistical parametric mapping (SPM) (4,8,9) have made it easier to detect these regional metabolic or perfusion changes, there have been few studies on the ability to discriminate early AD subjects from healthy volunteers using these stereotactic methods in the clinical setting. The purpose of our study was to compare a 3D-SSP analysis technique with visual inspection in the ability to discriminate very early AD subjects from healthy volunteers using brain perfusion SPECT.
MATERIALS AND METHODS
Subjects
We retrospectively chose 38 patients (16 men, 22 women) with a clinical diagnosis of probable AD according to the National Institute of Neurologic and Communicative Disorders and Stroke and the Alzheimer’s Disease and Related Disorders Association criteria (NINCDS–ADRDA) (10). The patients ranged in age from 48 to 81 y, with a mean age ± SD of 71.1 ± 8.4 y. At the initial visit, they underwent thorough neuropsychologic testing (11) and showed selective impairment of delayed recall with no apparent loss in general cognitive, behavioral, or functional status (Table 1). They corresponded to the criteria of mild cognitive impairment (MCI) proposed by Petersen et al. (12) or 0.5 in Clinical Dementia Rating (13). Each patient underwent baseline brain perfusion SPECT at the time of the initial visit and was clinically followed-up with a second SPECT study at intervals ranging from 11.2 to 25.4 mo (mean, 15.0 mo). At the time of the baseline SPECT study, the Mini-Mental State Examination (MMSE) score (14) was 26.1 ± 1.6 (mean ± SD). The score significantly (P < 0.05; repeated measurement ANOVA with Dunnet test) decreased to 22.0 ± 3.7 at the time of the follow-up SPECT study. At the third neuropsychologic assessment without a SPECT study, except for forward and backward recall of digit span, all of the other assessments described in Table 1 were significantly (P < 0.05) decreased from the baseline study.
Mean Performance Levels in Neuropsychologic Assessment
Seventy-six healthy volunteers (37 men, 39 women; age range, 67–87 y; mean age, 71.0 ± 7.1) were also studied. They had no neurologic or psychiatric disorders, including alcoholism, substance abuse, atypical headache, head trauma with loss of consciousness, or asymptomatic cerebral infarction detected by T2-weighted MRI. They did not significantly differ in age, sex, or education from the AD patients (Table 1). Spouses of the patients comprised the control subjects. They were not only spouses of the present patients but also spouses of other patients with advanced AD. These control subjects were known not to have manifested cognitive changes during the follow-up period of >2 y, since these spouses were attendant for the AD patients. We were also cognizant of their mental health. The Ethics Committee of the National Center of Neurology and Psychiatry approved this study, and all subjects gave informed consent to participate.
We randomly divided these subjects into 2 groups. The first group was used to identify the brain area with significant decreases of rCBF in patients compared with that of healthy control subjects. The second group was used then to compare the discrimination ability between patients and control subjects by 3D-SSP with that of visual inspection in regions identified in the first group.
SPECT image data in the present study have previously been reported in 12 of the 38 patients and 25 of the 76 healthy volunteers (4).
SPECT
Before the SPECT scan was performed, all subjects had an intravenous line established. They were injected while lying down in the supine position with eyes closed in a dimly lit, quiet room. Each subject received an intravenous injection of 600 MBq 99mTc-ethylcysteinate dimer (99mTc-ECD). Ten minutes after the injection of 99mTc-ECD, brain SPECT was performed using triple-head rotating γ-cameras (Multispect3; Siemens Medical Systems, Inc.) equipped with high-resolution fanbeam collimators. For each camera, projection data were obtained in a 128 × 128 format for 24 angles at 50 s per angle. A Shepp and Logan Hanning filter was used for SPECT image reconstruction at 0.7 cycle/cm. Attenuation correction was performed using Chang’s method.
Determination of Regions with Significant Decline of rCBF in AD
We randomly selected 19 patients and 38 healthy volunteers as the first group to establish regions with significant decline of rCBF in patients using group analysis by 3D-SSP. Each SPECT image was anatomically standardized to match a standard atlas brain (15) while preserving regional perfusion quantity. Maximum cortical activity was extracted to adjacent predefined surface pixels on a pixel-by-pixel basis using a 3D-SSP technique (16). The extracted cortical perfusion for patients was compared with that of healthy volunteers using a 2-sample Student t test on a pixel-by-pixel basis for approximately 16,000 predefined surface pixels covering the entire cortex. Calculated t values were converted to Z values using a probability integral transformation for comparison. A statistical significance threshold for P = 0.05 was calculated on the 3D-SSP Z map using a unified formula that controls multiple pixel comparison and a shape of the stochastic process on the 3D-SSP format (17).
Automated Analysis Using 3D-SSP
In the second half group, each SPECT image of the patients on both the baseline and the follow-up studies was compared with the mean and SD of SPECT images of the 38 healthy volunteers using voxel-by-voxel Z-score analysis after pixel normalization to values of 5 reference regions: global mean, pontine, cerebellar, sensorimotor, and thalamus; Z score = ([control mean] − [individual value])/(control SD) as previously reported by Minoshima et al. (16).
Each SPECT image of 1 of the 38 healthy volunteers was also compared with the averaged SPECT image of the remaining 37 healthy volunteers in the same manner as in the patients. Using the averaged value of positive Z scores in regions with significant decline of rCBF identified in the first group as the threshold, receiver operating characteristic (ROC) curves were determined using the ROCKIT 0.9β program developed by Metz et al. (http://xray.bsd.uchicago.edu/krl) (18). The program calculates the area under the ROC curves (Az), accuracy, sensitivity, and specificity. Accuracy was determined as the value at the point where the sensitivity is the same as the specificity on the ROC curve. The program also tests differences in Az between 3D-SSP and visual inspection. The Games–Howell test was used as the multiple comparison method of Az for specific areas and reference regions. Then, using the PlotROC program (http://xray.bsd.uchicago.edu/krl), interpolated values were also statistically calculated for drawing ROC curves.
Analysis with Visual Inspection
The observers comprised 6 medical doctors with experience in nuclear medicine for at least a year: 4 diagnostic radiologists with careers extending to 20, 16, 6, and 3 y, and 2 physicians working in nuclear medicine for 4 y and 1 y. Before the observers worked independently, a 10-min explanation was provided with regions identified in the first group, which were shown to teach where rCBF typically decreases in AD patients in the early stage. After this teaching session, transaxial, coronal, and sagittal sections of the original SPECT images in the second group were randomly presented to the observers. All of the observers were informed that these SPECT images originated from early AD patients and healthy volunteers. Images of healthy volunteers were intermingled with images of patients. The observers scaled the rCBF decrease into 5 levels in all of the specific areas. Five categories (definite decrease, possible decrease, equivocal decrease, possibly no decrease, and definitely no decrease) were used to describe these 5 levels of brain perfusion decrease. Finally, the observers also judged whether the presented SPECT images were those of the AD patients with 5 categories of certainty: definitely, possibly, equivocally, possibly no, and definitely no. To take the intraobserver variance into account, the observers judged the images twice in the same manner at intervals of >2 wk.
For the intra- and interobserver reliability trials, Spearman ρ-scores and 2-way random-effect intraclass correlation coefficients (ICCs) were calculated using SPSS statistical software (SPSS Inc.). These scores and coefficients for all images of AD patients and healthy volunteers were calculated separately in each specific area. ICC values of <0.4 were deemed as representing poor reliability, 0.4–0.75 as fair to good reliability, and >0.75 as excellent reliability.
RESULTS
Determination of Regions with Significant Decline of rCBF in AD
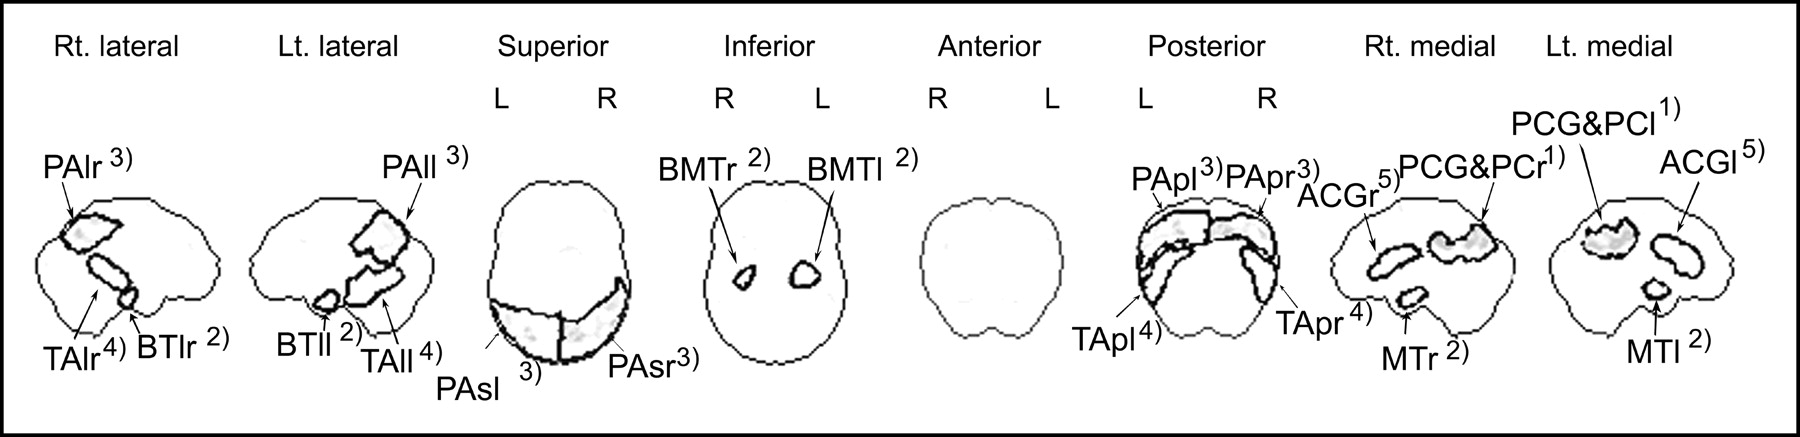
In the first group, the group comparison at the baseline study showed a significant (P < 0.05) rCBF reduction in 2 specific areas—namely, the posterior cingulate gyri and precunei and parietal association cortex. The follow-up SPECT study revealed 3 additional specific areas with rCBF reduction: lower and medial temporal areas, temporal association cortex, and anterior cingulate gyri (Fig. 1). Regions of interest (ROIs) were drawn over 5 specific areas (Fig. 2) using OSIRIS (University Hospital of Geneva, Geneva, Switzerland) with the consent of 2 operators: (1) 2 ROIs in bilateral medial views for the posterior cingulate gyri and precunei; (2) 6 ROIs in bilateral lateral, medial, and inferior views for lower and medial temporal areas; (3) 6 ROIs in bilateral lateral, superior, and posterior views for parietal association cortex; (4) 4 ROIs in bilateral lateral and posterior views for temporal association cortex; and (5) 2 ROIs in bilateral medial views for anterior cingulate gyri. ROI sizes ranged from 54 to 543 pixels. These ROIs were confirmed to be at a quite similar location wherever the reference area for pixel normalization was chosen.

Decrease of rCBF adjusted to global mean cerebral blood flow, shown by group analysis of 3D-SSP in patients with early AD at baseline study (top row) and follow-up study (bottom row) compared with healthy volunteers (P < 0.05, with multiple comparisons). Rt. = right; Lt. = left.

ROIs drawn over areas with significant decrease of rCBF in early AD. ROIs were classified into 5 specific areas as follows (numbers with open parentheses denote numbers of pixels included in ROIs): (1) posterior cingulate gyri and precunei: PCG&PC (r = 321 pixels, l = 280 pixels); (2) lower and medial temporal areas: MT (medial temporal areas) (r = 82 pixels, l = 79 pixels), BMT (basal medial temporal area) (r = 60 pixels, l = 112 pixels), and BTl (lateral basal temporal area) (r = 54 pixels, l = 74 pixels); (3) parietal association cortex: PAl (lateral parietal association cortex) (r = 279 pixels, l = 174 pixels), PAp (posterior parietal association cortex) (r = 320 pixels, l = 439 pixels), and Pas (superior parietal association cortex) (r = 543 pixels, l = 496 pixels); (4) temporal association cortex: TAl (lateral temporal association cortex) (r = 172 pixels, l = 367 pixels), TAp (posterior temporal association cortex) (r = 223 pixels, l = 241 pixels); (5) anterior cingulate gyri: ACG (r = 188 pixels, l = 256 pixels).
Comparative Analysis of ROC Curves Between 3D-SSP and Visual Inspection
Table 2 shows Az by 3D-SSP with SEs for 5 specific areas with different reference regions. We averaged positive Z-score values across the pixels within each ROI and then chose the highest value among these averaged Z scores in ROIs belonging to each specific area. There were no significant differences in Az among the reference regions used for pixel normalization after pooling specific areas at both the baseline and follow-up studies. At the baseline study, although there were no significant differences in Az among the specific areas after pooling reference regions, posterior cingulate gyri and precunei showed greater Az than any other specific area with any reference region. At the follow-up study, posterior cingulate gyri and precunei still showed greater Az than other specific areas except for lower and medial temporal areas. From these results, Az for discrimination of AD patients and control subjects by 3D-SSP was defined as the same value as Az for posterior cingulate gyri and precunei with global mean normalization.
Areas Under ROC Curves (Az) for Specific Areas with Different Reference Regions Obtained from 3D-SSP Analysis
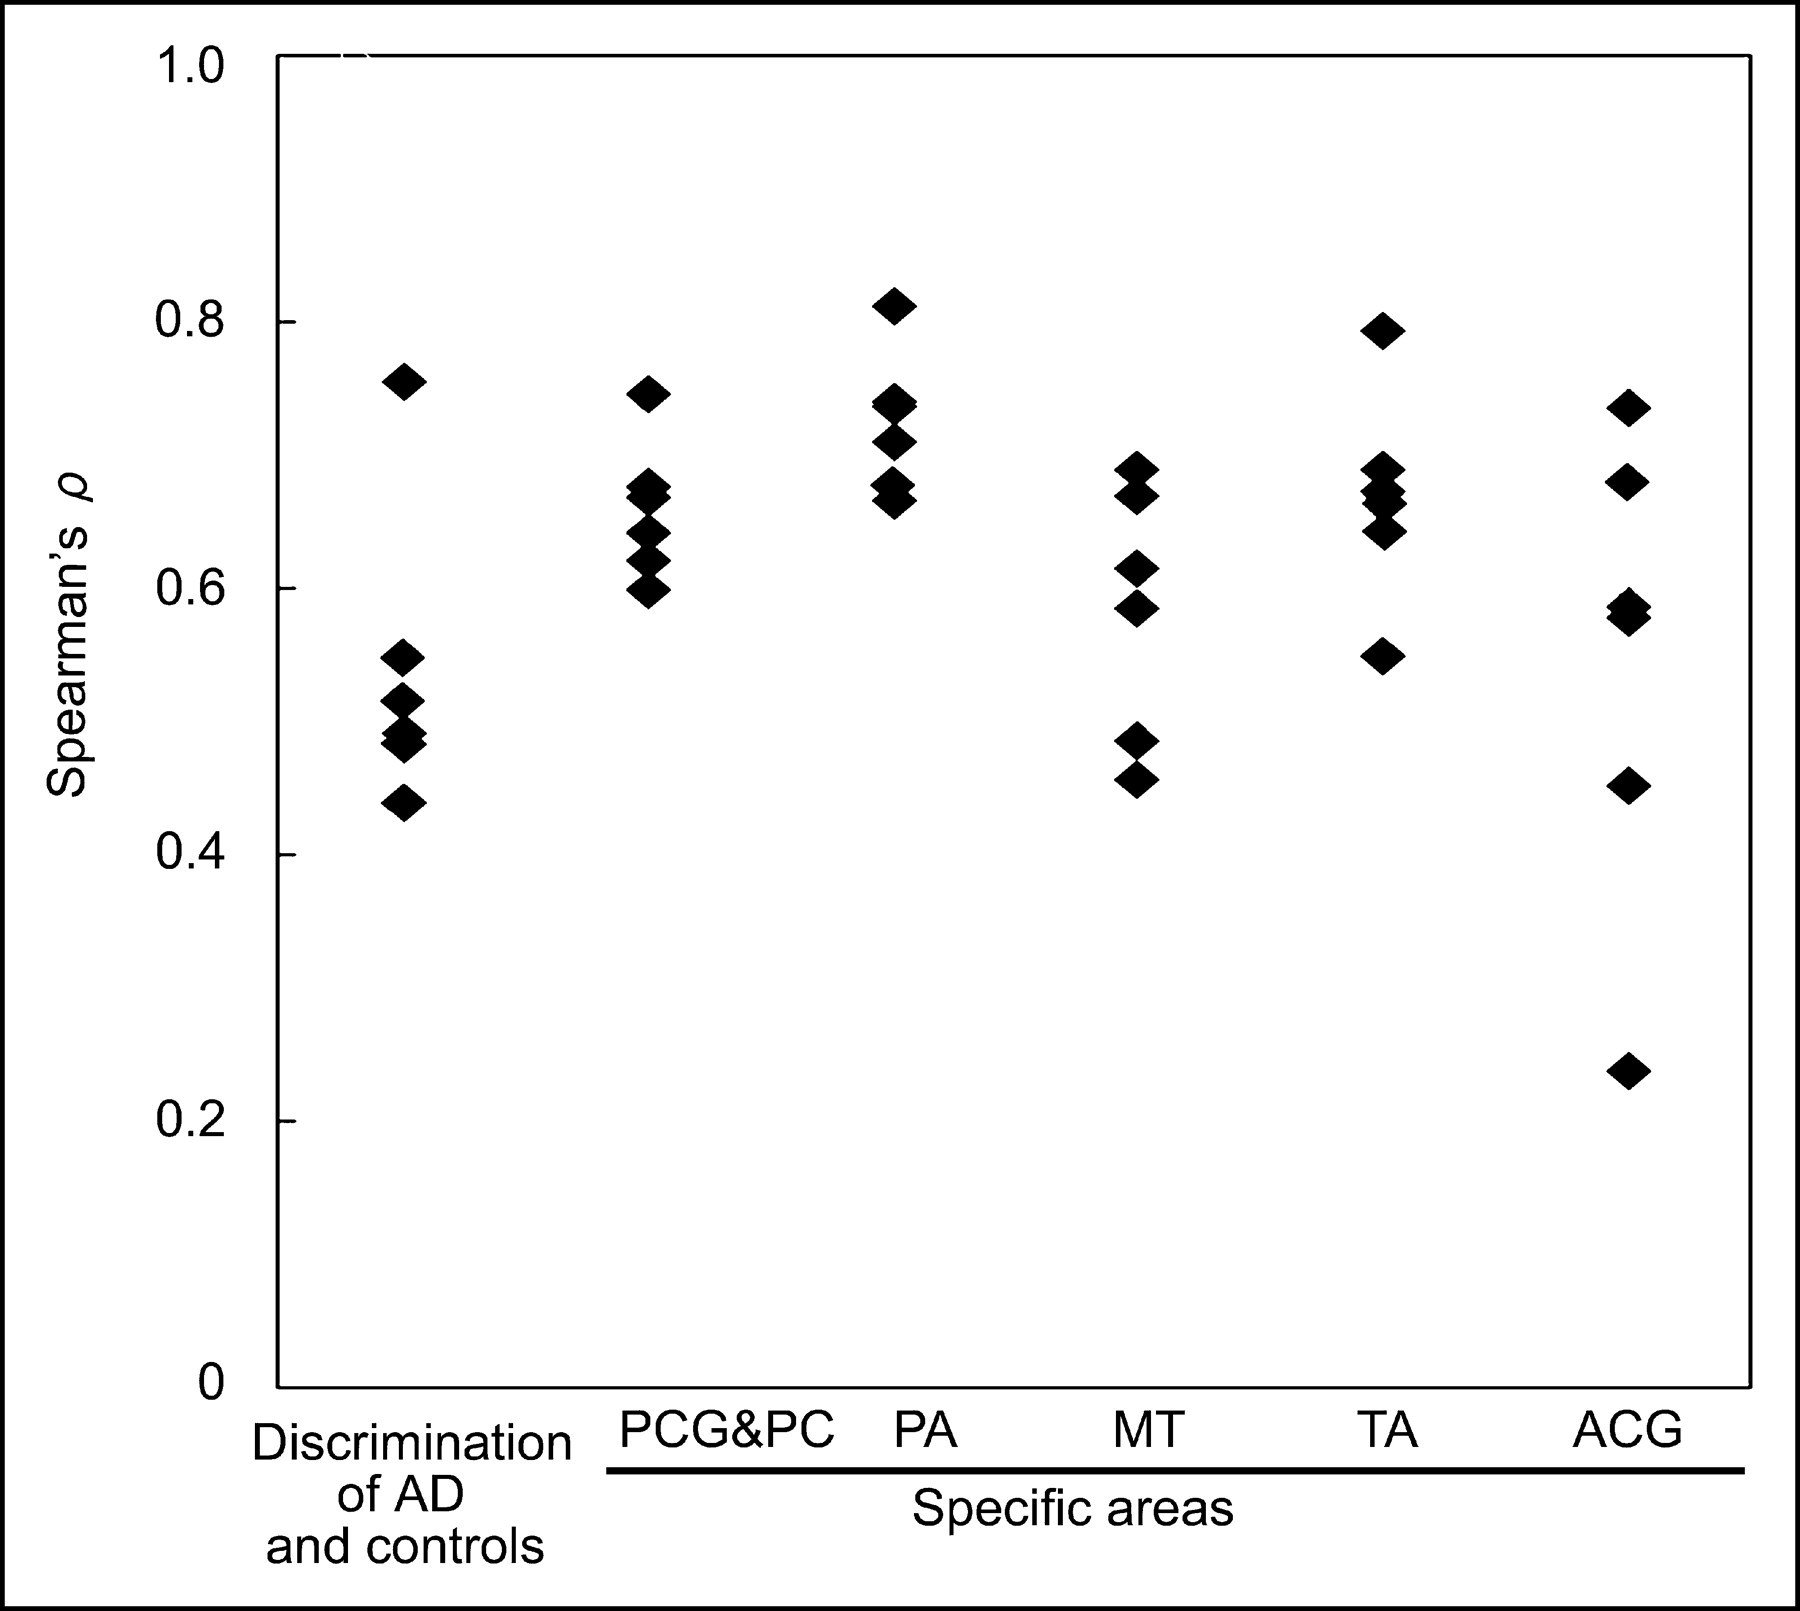
In visual inspection, significant ρ-scores between the first and second trials (P < 0.01) indicate good intraobserver reliabilities (Fig. 3). Excellent interobserver reliabilities ranging from 0.762 to 0.890 were observed in every specific area and in discrimination of AD patients and control subjects (Table 3).

Intraobserver reliability between 1st and 2nd trials. ♦, Spearman ρ for individual observer. PCG&PC = posterior cingulate gyri and precunei; PA = parietal association cortex; MT = lower and medial temporal areas; TA = temporal association cortex; ACG = anterior cingulate gyri.
Interobserver Reliability of Observers
The ROC curves for discrimination of AD patients and control subjects were compared between 3D-SSP and visual inspection (Fig. 4). Az values for 3D-SSP in the posterior cingulate gyri were greater than those for visual inspection.
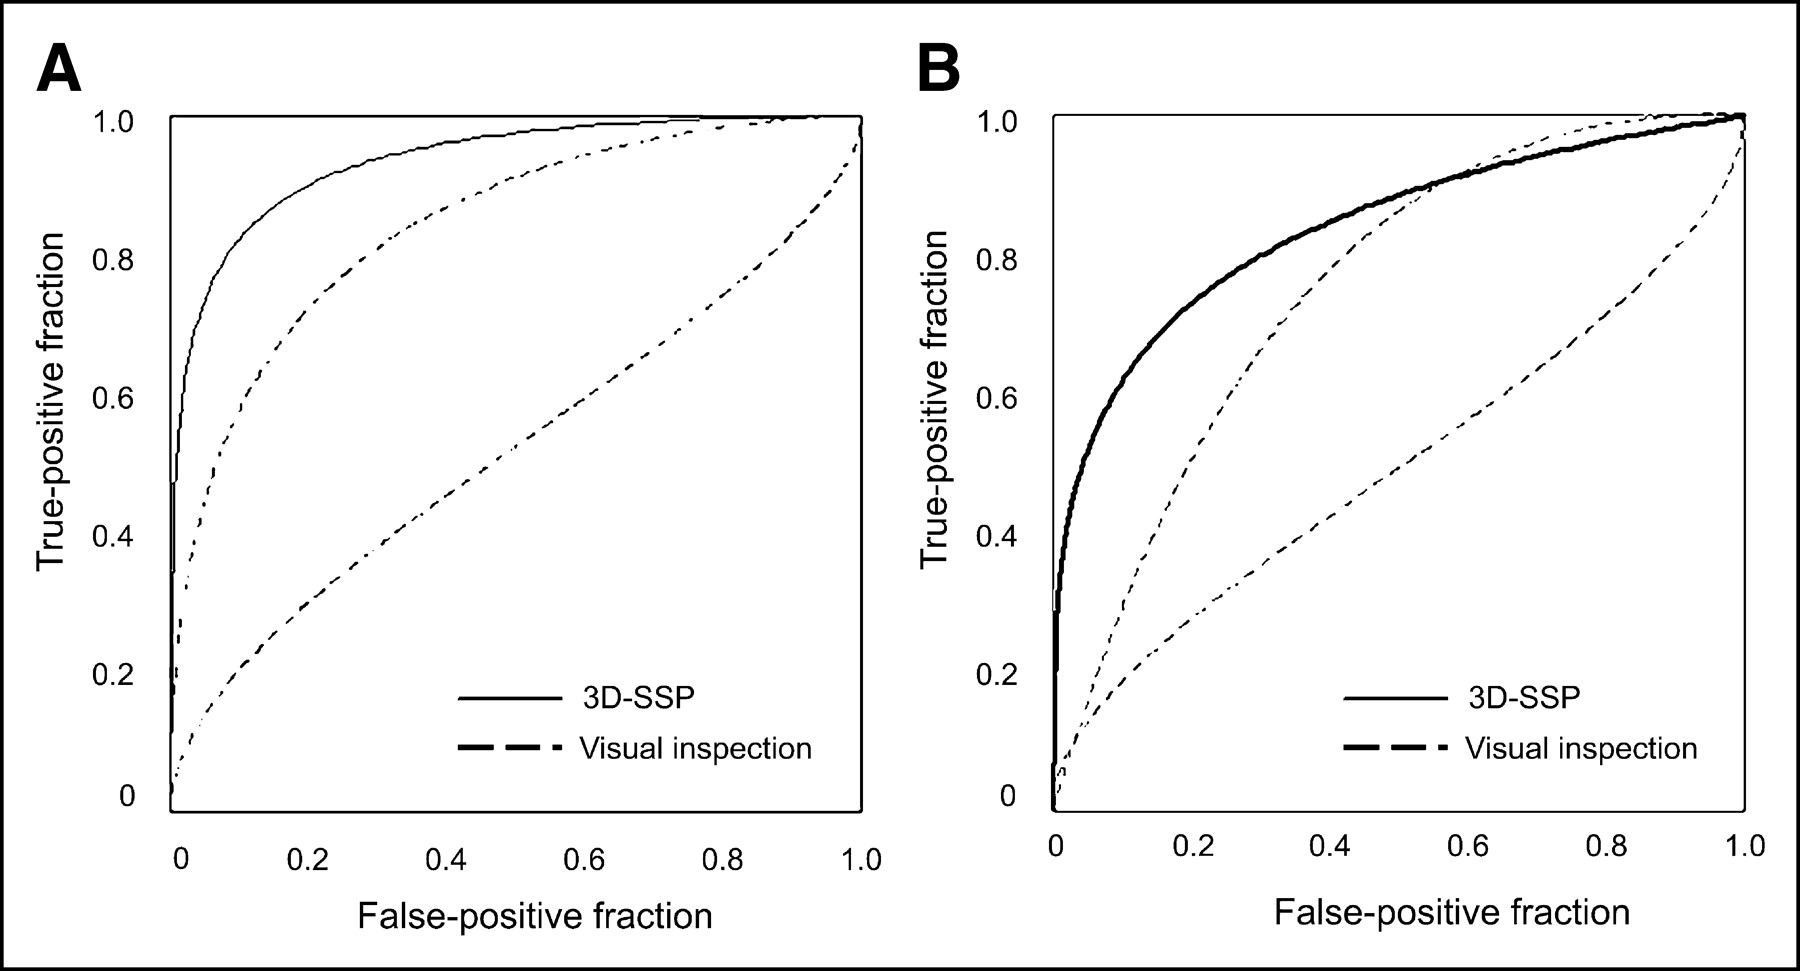
ROC curves obtained from 3D-SSP with global mean normalization when thresholding at highest value among averaged positive Z scores for ROIs belonging to posterior cingulate gyri and precunei and ROC curves for discrimination of AD patients and control subjects obtained from most excellent and poorest observers for either first or second reading. (A) Baseline study. (B) Follow-up study.
In Figure 5, Az values of the first trial of visual inspection were compared with Az values of 3D-SSP with global mean normalization. At the baseline study, 3D-SSP results in the posterior cingulate gyri and precunei showed significantly higher Az (P < 0.05) than results by visual inspection for the discrimination of AD patients and control subjects in all observers. At the follow-up study, all observers showed lower Az values for the discrimination than 3D-SSP. In all specific areas, Az values of all observers were lower than those of 3D-SSP at both the baseline and the follow-up studies.
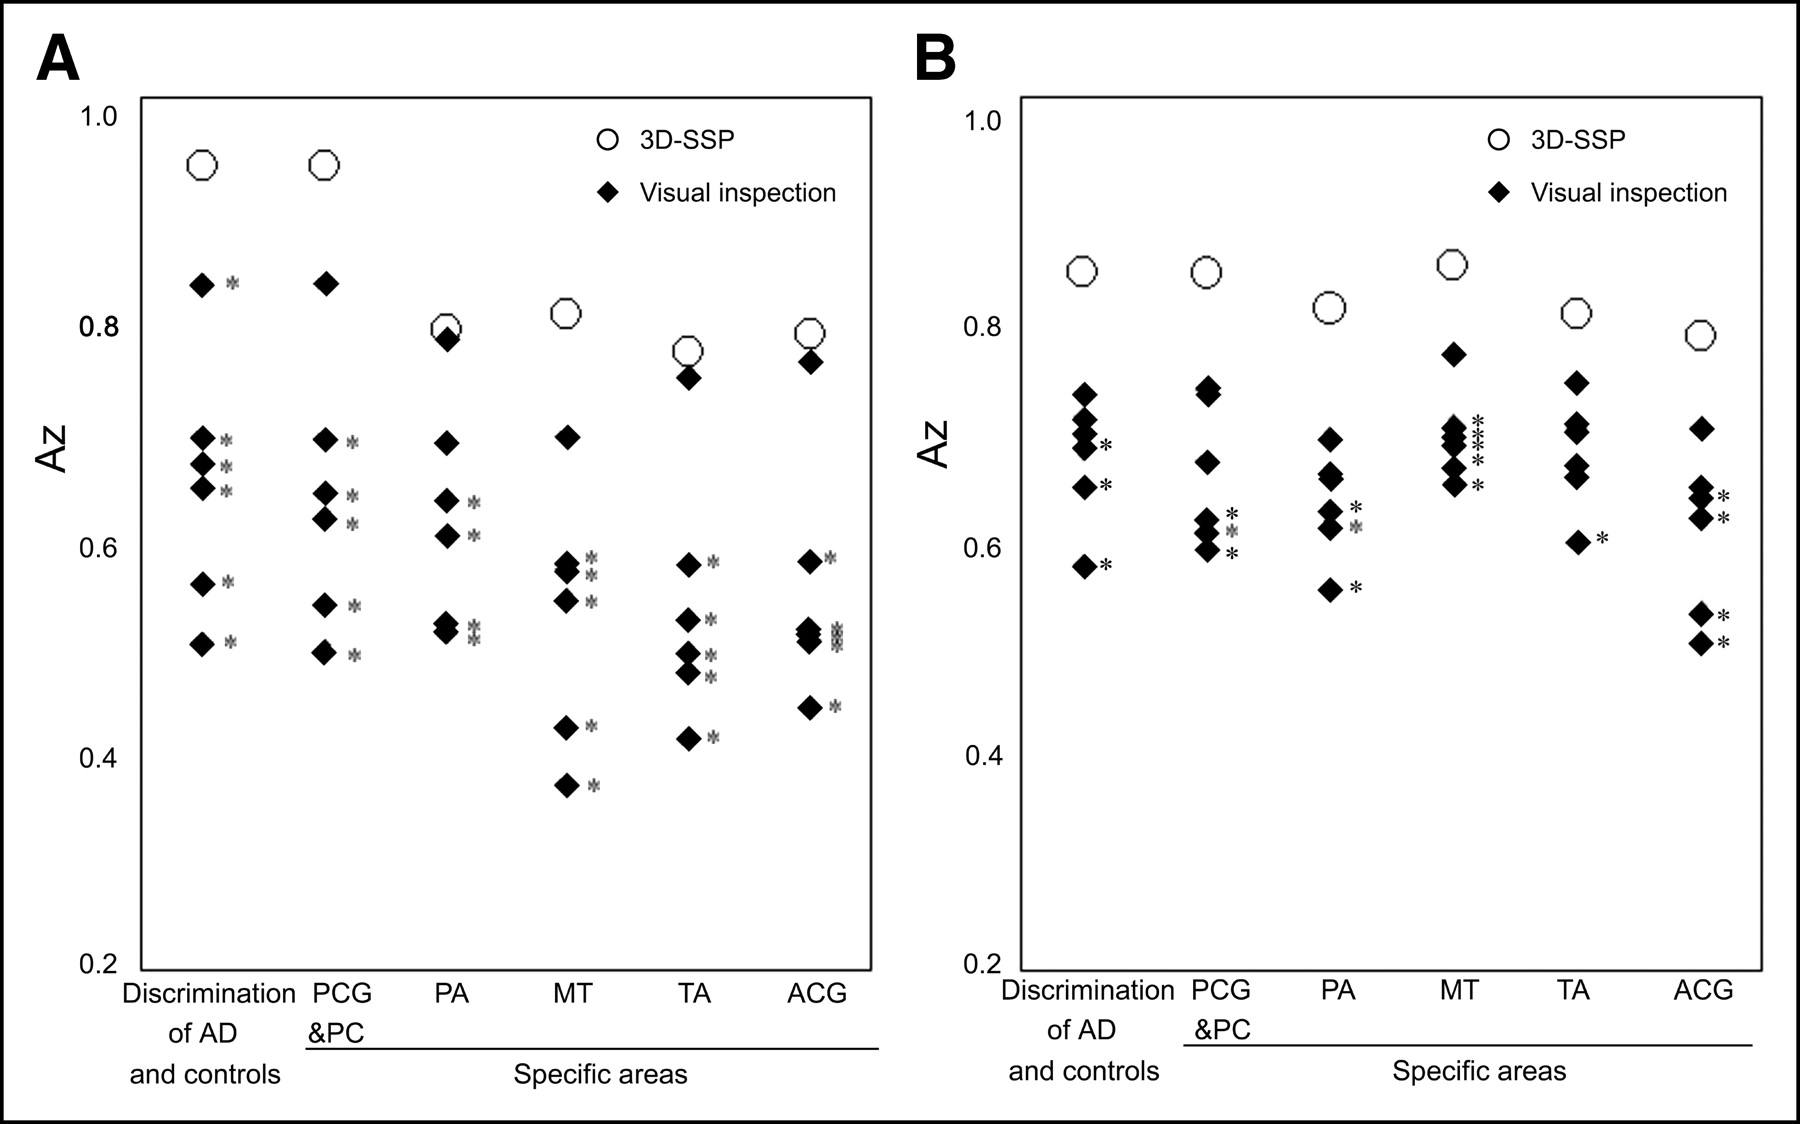
Comparison of Az between observers’ first visual inspection and 3D-SSP with global mean normalization. ♦, Az for individual observer; ○, Az for 3D-SSP. (A) Baseline study. (B) Follow-up study. PCG&PC = posterior cingulate gyri and precunei; PA = parietal association cortex; MT = lower and medial temporal areas; TA = temporal association cortex; ACG = anterior cingulate gyri. *Az of visual inspection is lower than Az by 3D-SSP analysis (P < 0.05). Statistical significance between Az values was calculated using ROCKIT program (18).
Table 4 shows the accuracy when sensitivity is equal to specificity. In 3D-SSP, the maximum accuracy of 86.2% was obtained in the posterior cingulate gyri and precunei with reference to the global mean. This accuracy was higher than the maximum accuracy of 74.0% in visual inspection for the discrimination of AD patients and control subjects at the baseline study. At the follow-up study, an accuracy of 74.0% was observed in the posterior cingulate gyri and precunei with reference to the global mean in 3D-SSP, which is still higher than the maximum accuracy of 65.9% in visual inspection.
Accuracies of Observers’ Visual Inspection and 3D-SSP Analysis
DISCUSSION
Burdette et al. (7) corroborated improvement of diagnostic performance using 3D-SSP in an 18FDG PET study on probable AD patients. In the present study, we confirmed this improvement in AD patients limited to the very early stage using 99mTc-ECD SPECT, which is more widely performed than PET worldwide. 3D-SSP has been reported to be less affected by the presence of atrophy than SPM (19). This method yielded a higher accuracy, even in parietal association cortical areas, than visual inspection, in which metabolic reduction is reported to be the best discriminator of patients with probable AD from healthy volunteers (16).
The flow or metabolic reduction in the posterior cingulate gyri and precunei has been established to characterize early-to-moderate AD even after correction of partial-volume effects using segmented MR images (20). The present study using 3D-SSP demonstrated that rCBF reduction in this specific area is the most reliable finding for diagnosing very early AD, with a high accuracy of 86.2%. 3D-SSP showed a significantly higher performance than the experienced observers at the baseline study. This specific area is known to be important in memory (21). A PET study revealed activation of the retrosplenial area of the cingulate cortex during the episodic memory-encoding tasks (22). Clinical evidence of the existence of a brain tumor (23) or arteriovenous malformation (24) in the retrosplenial cingulate cortex supports the importance of this area in memory function.
Most previous pathologic and morphologic studies suggested that structures within the medial temporal structures—amygdala, hippocampal formation, entorhinal cortex, and parahippocampal and fusiform gyri—are the first to be affected in AD with histologic changes, including amyloid deposits and neurofibrillary changes (5,25–27). The reduced rCBF in the medial temporal structures demonstrated by PET (27) or by a recent high-resolution SPECT system is consistent with these pathologic findings (28,29). In the present study, 3D-SSP revealed rCBF reduction in the lower and medial temporal areas more accurately in the follow-up study than in the baseline study. This finding is consistent with our longitudinal results using SPM, in which a significant reduction of hippocampal blood flow did not appear until the mean score of MMSE decreased from 26.2 to 22.3 (4). Even in the follow-up study, visual inspection showed significantly lower performance in this specific area than 3D-SSP. This may be because of inherent low accumulation of 99mTc-ECD in the medial temporal lobes (30).
In the present study, rCBF decrease was observed in the anterior cingulate gyri, as well as the posterior cingulate gyri, more prominently in the follow-up study. After involvement of the medial temporal structures, neuropathologic findings such as amyloid deposits and neurofibrillary changes have been observed to spread to the basal forebrain and anterior cingulate gyri, even in the clinically incipient stage of AD, becoming more conspicuous as the disease progresses (31). Decreased rCBF in the anterior cingulate gyrus has been reported in subjects with questionable AD at baseline SPECT who converted to AD on follow-up (3). Attention must be paid to the possibility of pseudo rCBF reduction produced in structures near the dilated ventricles by mismatches at the edges of the ventricles (19). However, for the clinical purpose of diagnosing AD, partial-volume effects may increase the sensitivity of detection of rCBF reduction. Current evidence suggests that after an initial amnesic stage in AD, attention is the first nonmemory domain to be affected before deficits in language and visuospatial function (32). In AD it appears that divided attention is particularly vulnerable, while sustained attention is relatively well preserved in the early stages (32,33). It has been reported that divided attention activates the anterior cingulate gyri, though sustained attention does not (34,35).
Concerning the reference regions for pixel normalization in 3D-SSP, Minoshima et al. reported that the pons is a reliable reference for data normalization on quantitative 18F-FDG PET measurement (36). In our study, Az did not show significant differences among reference regions. In the case of SPECT, the pons may be at the margin of spatial resolution for adequate and stable counts. Although rCBF in the cerebellum has been reported to decrease in advanced AD patients (37), the choice of cerebellum for pixel normalization would be acceptable in mild or very early AD. Subsequently, Minoshima et al. used the thalamus as a reference region (16) based on their prior observation that the thalamus or primary sensorimotor cortex is more suitable than the global mean or cerebellum. They also reported that the thalamus has a distinct shape and is located just above the intercommissural line, the standard line defining the stereotactic coordinate system, thereby ensuring reliable and accurate localization. Bartenstein et al. (38) used thalamic normalization even though they showed that global normalization resulted in the least mean cortical coefficients of variation in 99mTc-ECD SPECT. They considered global normalization to be inappropriate for a disease such as AD with widespread metabolic or flow reduction and concluded that the thalamus is the most robust reference region for SPECT images. However, the thalamus is pathologically known to be involved from an early stage (25). Moreover, Johnson et al. (3) revealed a rCBF decrease in the anterior thalamus in subjects with questionable AD at baseline SPECT who converted to AD on follow-up. We considered that global normalization is sufficient for routine clinical discrimination of early AD patients and control subjects. The present results confirmed the highest accuracy using global normalization at the baseline study.
Finally, we must refer to limitations of this kind of study even when conducted in the best situation (a specialized clinic for memory disorders). It has been reported that the clinical diagnosis of probable AD is 80%–90% accurate when compared with final pathologic verification (39), although prolonged follow-up with serial evaluation was performed to diagnose AD clinically in the present study.
CONCLUSION
A 3D-SSP technique using a normal database of brain perfusion SPECT images can detect a slight rCBF decrease in the posterior cingulate gyri and precunei with higher ability to discriminate very early AD patients from healthy control subjects than visual inspection. This technique afforded the maximum discrimination of 86.2% in accuracy at the very early stage corresponding to MCI. On the other hand, the maximum accuracy of visual interpretation was >10% lower as compared with 3D-SSP. The present results suggest that it is clinically useful and reliable to adopt the use of artificial computer intelligence as an adjunct to visual image interpretation for dementia evaluation.
Acknowledgments
This study was supported by Comprehensive Research on Aging and Health, grant H13-choju-004 from the Ministry of Health, Labor and Welfare. The authors are very thankful to Prof. Satoshi Minoshima (University of Washington) and Dr. Toru Matsumoto (National Institute of Radiologic Sciences) for valuable suggestions regarding the theory of 3D-SSP and ROC curve analysis, respectively; Dr. Toru Kinoshita (Department of Biostatistics, School of Health Sciences and Nursing, University of Tokyo) for statistics; John Gelblum for proofreading this manuscript; and the technical staff in our hospital for data acquisition.
Footnotes
Received Aug. 9, 2003; revision accepted Jan. 28, 2004.
For correspondence or reprints contact: Hiroshi Matsuda, MD, Department of Radiology, National Center Hospital for Mental, Nervous, and Muscular Disorders, National Center of Neurology and Psychiatry 4-1-1, Ogawahigashi, Kodaira, Tokyo, 187-8551, Japan.
E-mail: matsudah{at}saitama-med.ac.jp


