


Abstract
Although 18F-FDG PET is an established technique to assess brain glucose use, a shorter imaging time is preferable for patient convenience and increased throughput. The aim of this study was to validate a brain 18F-FDG PET protocol more rapid than the conventional protocol. Methods: For comparison of normalized metabolic activities, brain 18F-FDG PET was performed on 60 healthy subjects and 25 patients with probable Alzheimer’s disease (AD), and an additional 20 healthy subjects served as a control group to assess diagnostic performance between the conventional and rapid scanning protocols. Conventional scans were acquired for a total of 20 min (a 10-min emission and a 10-min transmission). Immediately after conventional scanning, rapid scanning was performed for a total of 4 min (a 3-min emission and a 1-min transmission). PET images were anatomically standardized using NEUROSTAT, with pixel values normalized to the individual global value. Two database sets, from the 2 protocols, were compared by regional values and pixel-by-pixel analysis. A receiver-operating-characteristic analysis was performed for comparison of diagnostic accuracy between the 2 protocols. A kinetic simulation study was also performed to examine the possible difference due to the time lag between the protocols. Results: Although small differences in normalized activity were found in several regions in the healthy subjects between the 2 protocols, no significant difference was found in any region in the patient group. The coefficients of variation of the normalized activity were 20%–30% larger in the rapidly scanned images, but the mean z images and their coefficient-of-variation images did not differ. The kinetic simulation study suggested that the differences were caused by the time lag between the 2 protocols. No significant differences were found in area under the receiver-operating-characteristic curves, and the diagnostic accuracies for the detection of AD were virtually equal between the 2 protocols. Conclusion: The rapid scanning protocol used in the present study could provide results nearly equivalent to data from the conventional protocol. Thus, it is feasible to use this rapid protocol to detect AD, without losing diagnostic accuracy.
Brain PET using 18F-FDG is an established noninvasive diagnostic imaging technique, applied to distinguish between neurodegenerative disorders according to changes in regional brain glucose use. In the past 10 y, methods for automated image analysis, such as NEUROSTAT and Statistical Parametric Mapping (SPM), have been developed (1–4). These methods provide advantages in objectivity, reproducibility, and speed of image analysis because of automated anatomic standardization and statistical processing. Many studies (5–8) have demonstrated the reliability of these methods in the interpretation of functional brain imaging and the enhancement of diagnostic performance in brain PET and SPECT. However, exact diagnosis may not be possible without a high-quality reference database. In the present study, we proposed a rapid scanning protocol (a 3-min emission and a 1-min transmission) for brain 18F-FDG PET that can be performed as a part of whole-body scanning, and we compared this rapid protocol with the conventional scanning protocol (a 10-min emission and a 10-min transmission) in healthy and patient subjects. This rapid scanning protocol would enable high-throughput 18F-FDG PET, which would be useful for building a large brain 18F-FDG PET database, as well as being convenient for patients.
MATERIALS AND METHODS
Subjects
We recruited 60 healthy subjects (30 men and 30 women; mean age ± SD, 64.2 ± 8.3 y) for comparison of 2 database sets derived from 2 scanning protocols (rapid and conventional). Additionally, 25 patients (14 men and 11 women; age range, 53–80 y; mean age, 67.9 ± 8.5 y) with probable Alzheimer’s disease (AD) and 20 healthy subjects (10 men and 10 women who served as a control group; mean age, 64.1 ± 7.9 y) were recruited to assess the diagnostic performance of the rapid and conventional scanning protocols. The study protocol was approved by the institutional human study committee, and all subjects signed an informed consent form based on the guidelines of this committee before participation in the study. All subjects underwent physical and neuropsychological examinations and replied to the questionnaire for clinical information. Cognitive ability was assessed using the Mini-Mental Status Examination (MMSE). Axial MR images (T1, T2-weighted, fluid-attenuated inversion recovery, and MR angiography) were acquired using a 1.5-T MRI scanner equipped with a head coil (Signa Horizon; GE Healthcare). The criteria to define “healthy” were no history of major neuropsychological systemic disorders, normal findings on physical and neurologic examinations (MMSE score ≥ 28), and normal findings on brain MRI. The diagnosis of probable AD was made according to the criteria of the National Institute of Neurologic and Communicative Disorders and Stroke and the Alzheimer’s Disease and Related Disorders Association (9); of the 25 probable AD patients, 23 patients were classified as 1 and the other 2 patients as 2 according to the Clinical Dementia Rating. The mean MMSE score was 22.5 ± 2.4. There were no significant differences in the distribution of age, sex, and extent of education between the healthy subjects and the patients.
PET Imaging
The imaging procedure is outlined in Figure 1. Both conventional and rapid PET images were obtained using a full-ring PET scanner (Advance; GE Healthcare) in 2-dimensional (2D) acquisition mode with septa in. The characteristics of this scanner have been described previously (10). The system has an in-plane spatial resolution of 3.8 mm in full width at half maximum at the center of the field of view and an axial resolution of 4 mm. The scanner consists of 12,096 bismuth germanate crystals in 18 rings, having dimensions of 4.0 mm transaxial × 8.1 mm axial × 30 mm radial grouped in detector units of 6 × 6 crystals each. In each detector unit, 2 dual-cathode photomultiplier tubes view the crystals. The scanner gives 35 2D image planes through an axial field of view of 15.2 cm. The coincidence timing window is 12.5 ns. A 300-keV lower energy cutoff and 650-keV upper energy cutoff were used for the energy discriminator. Subjects fasted for at least 4 h before the injection of 18F-FDG. A blank scan was acquired for 30 min daily, which, together with the transmission scan, was necessary to obtain the appropriate correction coefficients for photon attenuation. All subjects were under resting conditions with eyes closed, lying comfortably in a quiet room. The conventional scan was started 40 min after the intravenous injection of 18F-FDG (370 MBq) and continued for a total of 20 min (a 10-min emission and a 10-min transmission). Immediately after the conventional scan, the rapid scan was acquired for a total of 4 min (a 3-min emission and a 1-min transmission). Transmission scanning was performed using 68Ga/68Ge pin sources (400 MBq × 2). PET images from both protocols were reconstructed using ordered-subsets expectation maximization, with an 8-mm gaussian smoothing filter, 27-mm field of view, and 2 dimensions over 2 iterations with 28 subsets. PET images from conventional scanning were reconstructed with measured attenuation correction (MAC), whereas images from rapid scanning were reconstructed with the segmented attenuation correction (SAC) algorithm. The blank, geometric, decay, dead-time, and scatter corrections were applied for the reconstruction. Transaxial images (voxel size, 2.1 × 2.1 × 4.25 mm; matrix size, 128 × 128 × 35) were acquired. The acquisition and reconstruction parameters for both protocols are summarized in Table 1.

Schematic representation of rapid and conventional scanning protocols.
Different Parameters Between the 2 Protocols
Data Analysis
Automated 18F-FDG PET Image Analysis.
PET images were converted to the NEUROSTAT format using commercially available software (Dr. View; Asahi Kasei Information Systems). The images were then anatomically standardized and cortical surface projection images generated using NEUROSTAT (1–3,5). Two database sets were generated from data from the 2 protocols, with pixel values normalized to the individual global value using NEUROSTAT. Data from the probable AD patients and 20 healthy subjects were analyzed using these 2 database sets. In addition, coefficient-of-variation (CV) images were created using NEUROSTAT for each protocol to compare the differences in CV. The 2 database sets and z map sets were stored, as mean and SD images for healthy subjects and patients, for each protocol. The normalized metabolic activities were measured by placing regions of interest, which were automatically drawn by the program, on cortical surface projection images of 60 healthy subjects, and the mean z values were measured on z images of 25 patients using NEUROSTAT. The differences between the 2 protocols were examined using repeated measures of ANOVA. The differences were considered significant when P was <0.05. A pixel-by-pixel comparison was also performed by NEUROSTAT to assess regional changes that were not included in the region-of-interest analysis, where z images (2-sample t tests converted to z using a probability integral transformation) for difference between 2 database sets and 2 z image sets were generated.
Determination of Diagnostic Accuracy.
To compare the diagnostic performance of the rapid scanning protocol with that of the conventional protocol, we determined the diagnostic accuracy of each protocol in discriminating probable AD patients from healthy subjects. Previous studies (5, 11,12) have shown that glucose metabolism or perfusion in AD patients declines in the posterior cingulate gyri and precunei and lateral parietal association cortex. Therefore, the mean z values in these areas were measured in 25 patients and 20 control subjects on conventional and rapid images, respectively. Using the clinical diagnosis as a criterion, receiver-operating-characteristic (ROC) analysis was performed for images obtained with each protocol using the ROCKIT 0.9.1 β program developed by Metz et al. (13, 14). Accuracy was determined as the value at the point where the sensitivity was the same as the specificity on the ROC curves. The differences in area under the ROC curves were tested by the area test, and the sensitivity, specificity, and accuracy between the conventional and rapid protocols were compared using the χ2 or McNemar test.
Kinetic Simulation Study
A 2-tissue-compartment (C1 and C2) model was used as illustrated in Figure 2. In this model, the rates of change of C1 and C2 at a given time point (t) can be expressed as dC1(t)/dt = f(t) K1 − k2 C1(t) − k3 C1(t) + k4 C2(t), where f(t) denotes an input function in plasma, and dC2(t)/dt = k3 C1(t) − k4 C2(t).
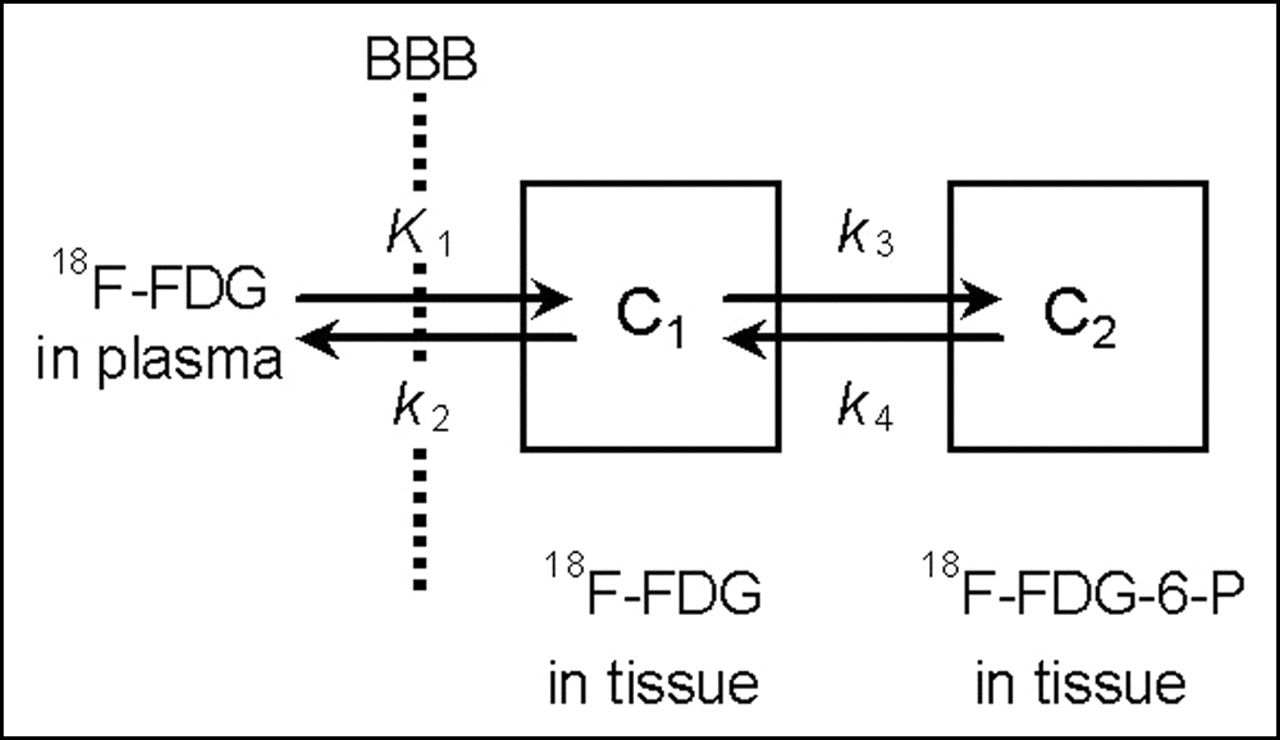
Kinetic model used in simulation study. BBB = blood–brain barrier; 18F-FDG-6-P = 18F-FDG-6-phosphate.
Using the values of kinetic rate constants (K1, k2, k3, and k4) reported by Piert et al. (15), radioactivities of C1 and C2 at various time points for the frontal cortex, parietal cortex, temporal cortex, occipital cortex, thalamus, pons, and cerebellum were calculated as the response to a typical input function. Then, the time–activity curves of total tissue radioactivity were obtained as the sum of C1 and C2, at each time for each region. The values from PET measurement in each protocol were calculated as the time average of the time–activity curve in each region within the scanning time of each protocol. Then, the values were normalized according to the mean value of the cortical regions.
RESULTS
Comparison of Normalized Metabolic Activity and Mean z Value Between the 2 Protocols
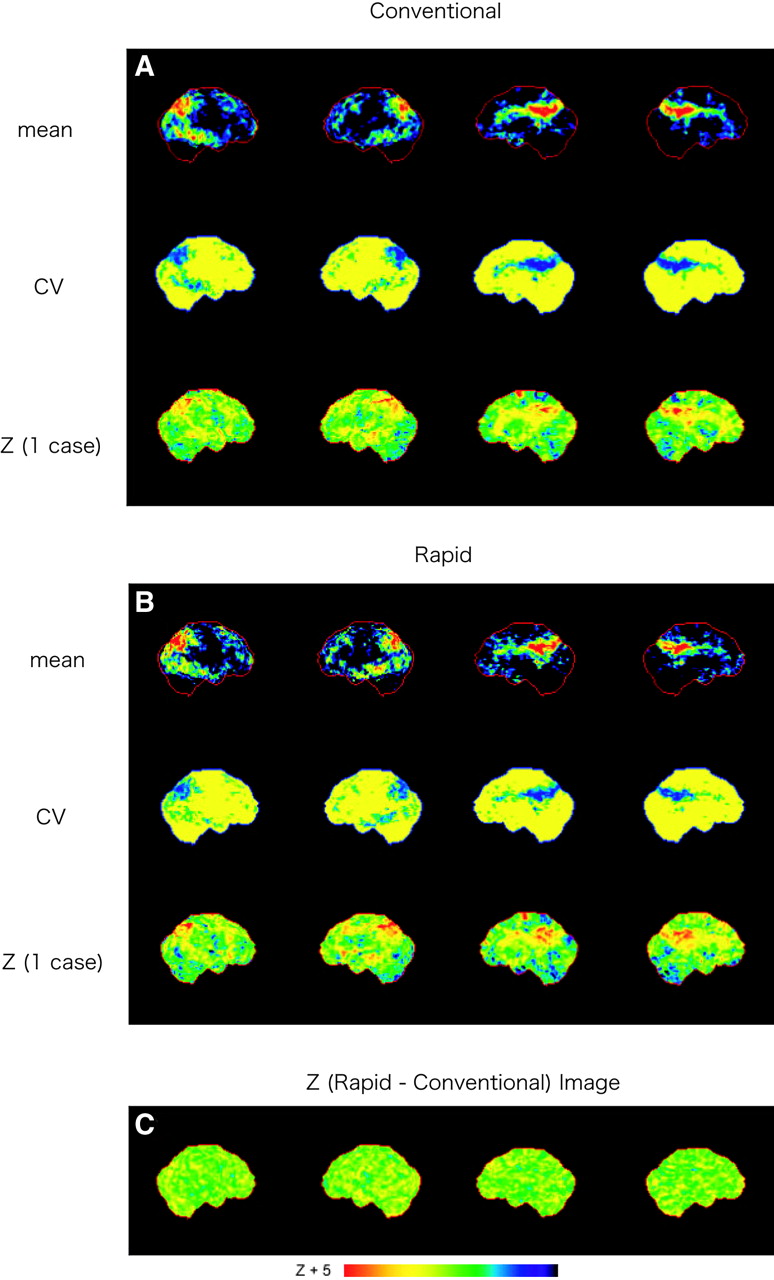
The normalized metabolic activities in 60 healthy subjects and the mean z values in 25 patients for each region are compared between the 2 imaging protocols in Figure 3 and Table 2. Although the regional mean activities and mean z values were similar between the protocols, as illustrated in Figure 3, there were small but significant differences in the mean activity in the right parietal association cortex, the left occipital association cortex, and both the right and the left posterior cingulate gyri (P < 0.05) in the healthy group (Table 2). Additionally, there was a trend toward lower activity, using rapid imaging, in the right and left cerebellar hemispheres (left, P = 0.05; Table 2). No significant difference was found in any region in the patient group. Regional SDs of the normalized values and mean z values from the rapid protocol were slightly larger than those obtained from the conventional protocol (Fig. 3 and Table 2). Mean and CV images from the 2 protocols were obtained from the 60 healthy subjects and 25 patients. The mean normalized metabolic activity images showed good agreement; however, the CV image from rapid scanning showed about 20%–30% larger values in all regions in the healthy group (Fig. 4) because of the poorer image quality obtained from the rapid scanning protocol. On the other hand, the mean z images and their CV images obtained from conventional scanning were much the same as those obtained from the rapid protocol in the patient group (Fig. 5). The CV value was small in all regions on both CV images.
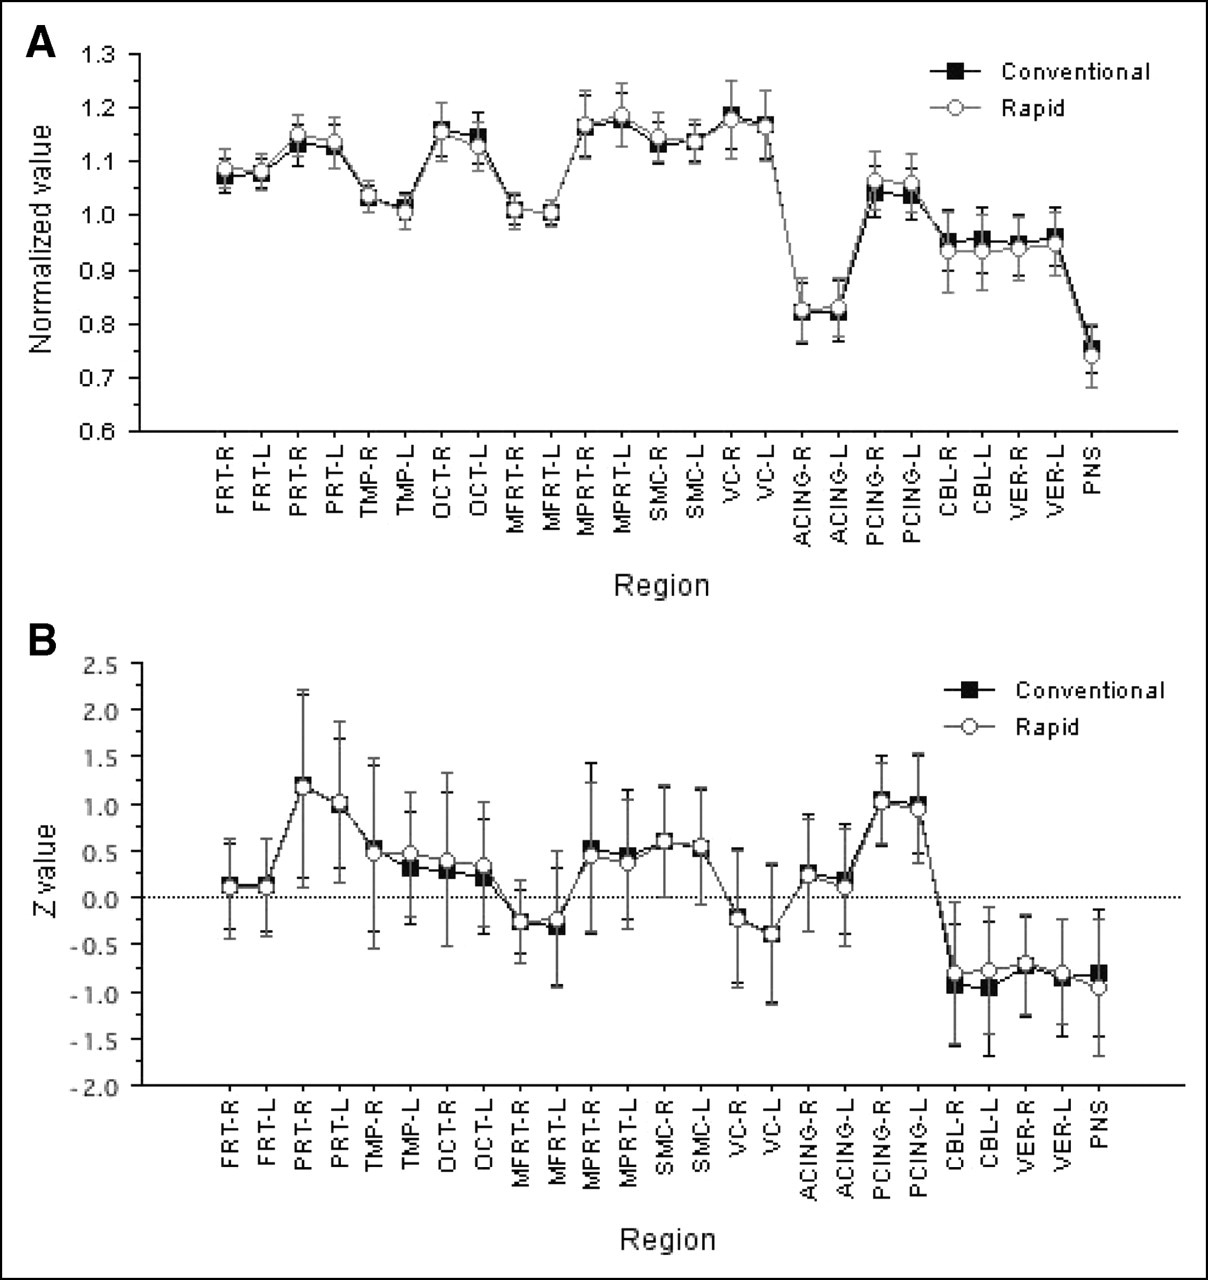
(A) Comparison of normalized values between the 2 scanning protocols in healthy group. (B) Comparison of z values between the 2 scanning protocols in patient group. Error bars show SD of normalized values or z values in each scanning protocol. ACING = anterior cingulate gyrus; CBL = cerebellar hemisphere; FRT = frontal cortex; MFRT = medial frontal association cortex; MPRT = medial parietal association cortex; OCT = occipital cortex; PCING = posterior cingulate gyrus; PNS = pons; PRT = parietal cortex; SMC = primary sensorimotor cortex; TMP = temporal cortex; VC = primary visual cortex; VER = cerebellar vermis.
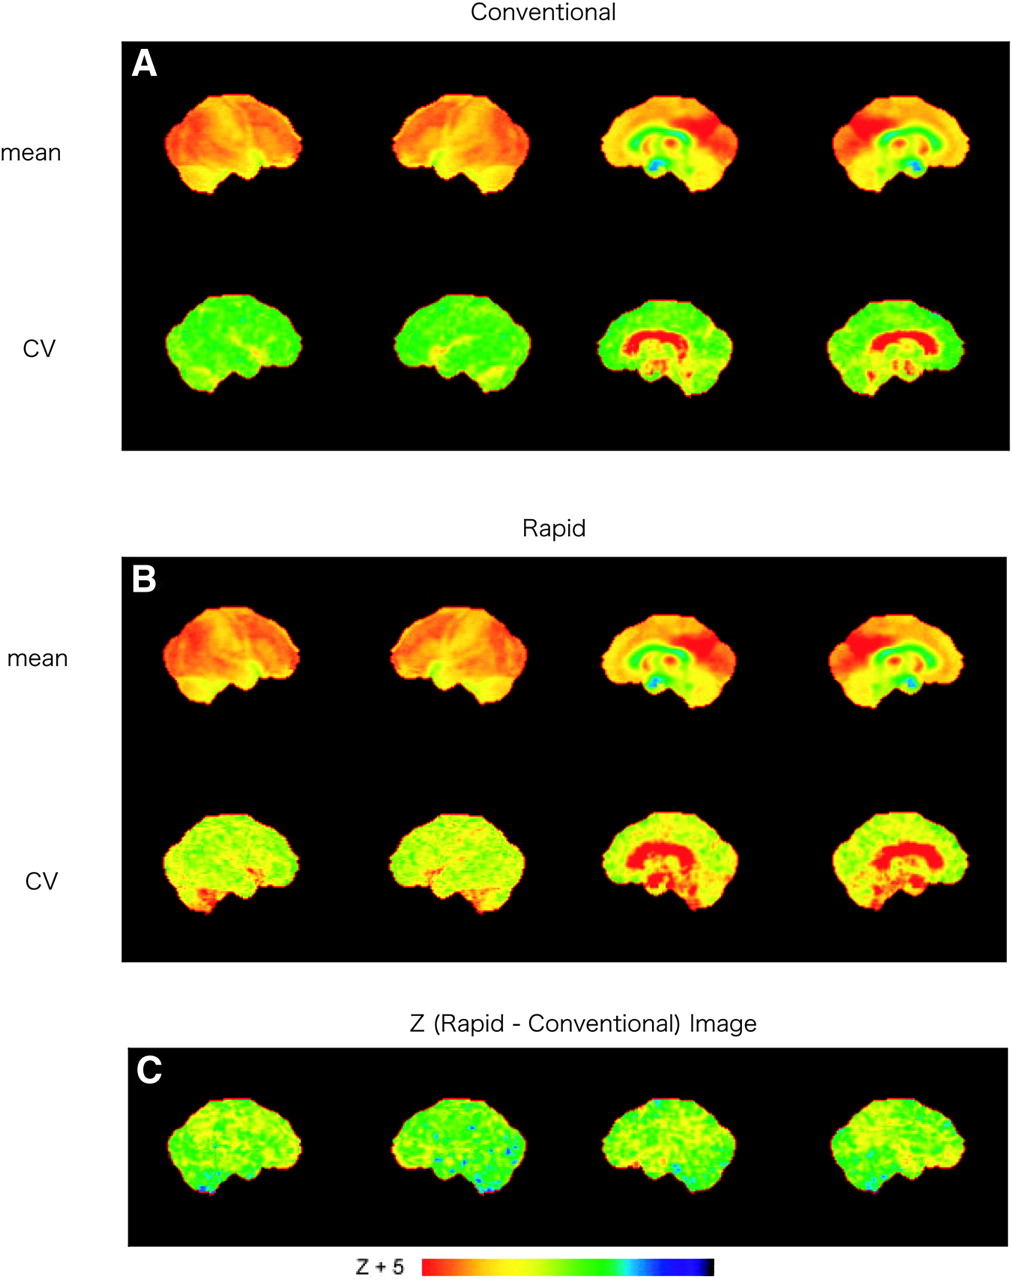
(A and B) Mean normalized activity and CV images obtained from conventional (A) and rapid (B) scanning protocols in healthy group. (C) z (rapid − conventional) images showing differences between the 2 protocols.

(A and B) Mean z image and CV images obtained from conventional (A) and rapid (B) scanning protocols in patient group. z (1 case) are z images of 1 patient with probable AD. (C) z (rapid − conventional) image showing differences between the 2 protocols.
Comparison of Relative Glucose Activities in Healthy Subjects and Mean z Values in Patients Between the 2 Protocols
Comparison of Diagnostic Accuracy Between the 2 Protocols
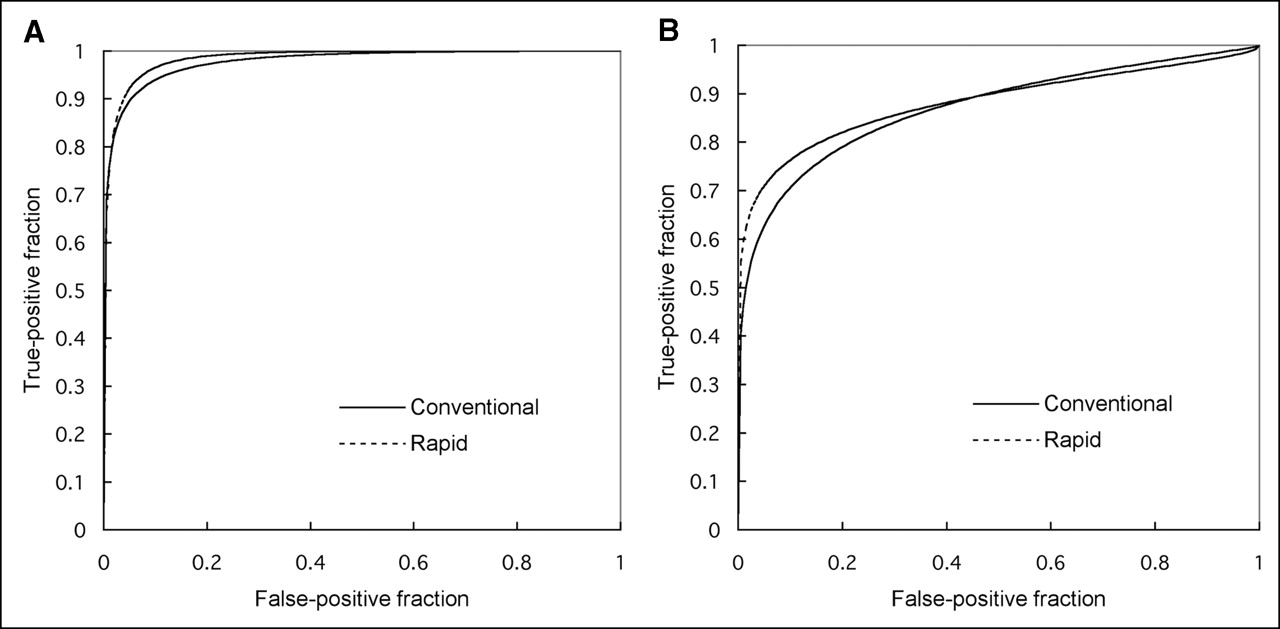
The ROC curves for discrimination of probable AD patients from control subjects were compared between the conventional and rapid protocols (Fig. 6). There were no significant differences in the area under the ROC curve between the 2 protocols for both posterior cingulate gyri and precunei (0.978 for conventional vs. 0.985 for rapid; not statistically significant [NS]) and lateral parietal association cortex (0.870 for conventional vs. 0.882 for rapid; NS). When sensitivity was set equal to specificity, the diagnostic accuracy in posterior cingulate gyri and precunei was 92.1% for the conventional scanning protocol and 93.5% for the rapid scanning protocol (NS). The accuracy in the lateral parietal association cortex was slightly lower for both the conventional (79.2%) and the rapid (81.3%) scanning protocols (NS). Thus, the diagnostic performance of the rapid scanning protocol was virtually equal to that of the conventional scanning protocol as evidenced by nearly superimposable ROC curves.

ROC curves obtained from conventional- and rapid-protocol images with large z values, indicative of true-positive cases in area of posterior cingulate gyri and precunei (A) and lateral parietal association cortex (B).
Kinetic Simulation Study
The simulated time–activity curves in each region as well as the normalized values corresponding to the 2 protocols are shown in Figure 7. The normalized value in the cerebellum was lower in the rapid scanning protocol, whereas the values in the cortical regions tended to be higher.

Simulated time–activity curves in each region (left) and calculated values corresponding to the 2 protocols, normalized by mean value of cortical regions (right). CAD = caudate; CBL = cerebellum; FRT = frontal cortex; OCT = occipital cortex; PRT = parietal cortex; THL = thalamus; TMP = temporal cortex.
DISCUSSION
The present study proposed a rapid scanning protocol (a 3-min emission and a 1-min transmission) for brain 18F-FDG PET as a more convenient and higher-throughput alternative to the conventional scanning protocol, which usually requires 20–30 min for acquisition of emission and transmission data. The major findings of this study were, first, that although there were minor differences in the normalized glucose activities in several regions between the 2 scanning protocols, the activity distribution of the rapid protocol was generally quite similar to that of the conventional one and, second, that the diagnostic accuracy of the rapid scanning protocol for discriminating probable AD patients from control subjects was comparable to that of the conventional protocol.
From a technical point of view, there are factors that could potentially have affected the results. First, in addition to the shorter acquisition time for both emission scans and transmission scans, the rapid scanning protocol used SAC whereas the conventional protocol used MAC. Second, a time lag existed between the 2 protocols, in that conventional scanning was performed before the rapid protocol. The quality of reconstructed PET images is known to depend on the attenuation correction (16, 17). MAC is the most common method for reconstructing PET images, performed using attenuation factors derived from transmission data obtained with a radiation source outside the subject. However, a long scanning time, usually 10–20 min at 1 bed position, is required for adequate statistics in transmission data using MAC. An increase in artifacts because of object shift is also a possibility. On the other hand, SAC (17–19) enables a shorter transmission scan. The feasibility of this approach has been well demonstrated (19–24), and now it is widely implemented for attenuation correction in whole-body PET mainly for oncology. The automatic detection of regions is the characteristic feature of this approach and may improve boundary delineation and reduce noise in areas of homogeneous high-activity background. Tissues can be distinguished on a short transmission image, depending on the difference of attenuation coefficients. A transmission image is typically divided into 3 segments (i.e., air, soft tissue, and bone) based on the intensity histogram, and these segmented criteria are then applied back to the image itself. Using this approach, only a 2- to 3-min transmission scan can be used to perform an accurate attenuation correction, without increasing noise, in reconstructed PET images. Visvikis et al. (24) demonstrated that the result of using SAC combined with ordered-subsets expectation maximization, with only a 2-min transmission and a 5-min emission, might reliably be used to reduce the overall data acquisition time without compromising the quantitative accuracy of 18F-FDG PET. The results of the present study, in which both SAC and ordered-subsets expectation maximization were used for reconstruction in the rapid scanning protocol, demonstrated that the normalized glucose activity images obtained from the 2 protocols agreed well, which is essentially in line with the prior whole-body studies (19–24). However, the images from rapid scanning had approximately 20%–30% larger CVs in the normalized activity, compared with those from conventional scanning. Scanning time for the rapid protocol was shorter than in previous reports (19–24), in which by the shortest times for transmission and emission were 2 and 5 min, respectively. Therefore, it is possible that a longer acquisition (e.g., a 2-min transmission and a 5-min emission) may have further improved the image quality obtained from rapid scanning when performing the quantitative assessment for brain activity, although compared with the body, the brain has a high 18F-FDG uptake and small contour. From the clinical standpoint, however, the more relevant question is how the rapid protocol works in terms of diagnostic performance.
On the other hand, the differences in the cerebellum and cortical regions observed in this study may have been due to a physiologic alteration caused by the time lag between the 2 protocols, as suggested in the kinetic simulation study. Acquisition of the conventional-scanning data began 40 min after the injection of 18F-FDG, whereas acquisition of the rapid-scanning data began later (60 min after injection). The kinetic simulation study suggested relatively lower values in the cerebellum and relatively higher values in the cortical regions. The results from the pixel-by-pixel comparison (Fig. 7) agreed with the results from the kinetic simulation study, except in the occipital cortex. The kinetic rate constants used in the simulation study were obtained when the subject’s eyes were open, whereas kinetic rate constants in the present study were obtained when the subject’s eyes were closed. The difference in whether subject’s eyes were open or closed was considered the cause of the difference in the occipital cortex. Furthermore, the fact that the results were different in the right parietal cortex, bilateral frontal cortex, posterior cingulated gyri, and bilateral cerebellar hemisphere (Fig. 4) may have caused discrepancies between the data acquired from different scan timings. These discrepancies need to be elucidated in further studies. One might think that it would have been more appropriate to vary single parameters such as the reconstruction protocol, scan duration, or point of data acquisition. For example, one might obtain a scan with a set of short frames and then compare single frames to a summed frame to know the pure effect of different acquisition times. However, we sought to simulate a realistic clinical situation in which the rapid scan can be obtained as a part of routine whole-body PET acquisition, which is usually aiming at cancer detection (25). For this purpose, a longer duration between the injection of 18F-FDG and the start of PET imaging is preferable to achieve a high lesion-to-background contrast (26). To accomplish this, we acquired the rapid scan later after 18F-FDG injection and used SAC for image reconstruction. Despite the technical differences between the 2 protocols, the result of the z map obtained by the rapid scanning protocol was similar to that obtained by the conventional protocol. The CV on z images was also equivalent between the 2 protocols (Fig. 5). Finally, the rapid scanning protocol provided diagnostic performance virtually equivalent to that of the conventional protocol in discriminating probable AD patients from the control subjects, as evidenced by the results of ROC analysis. In this regard, our results support the use of this protocol combined with NEUROSTAT as an effective alternative to conventional brain 18F-FDG PET without a loss of diagnostic accuracy.
In this study, both the conventional and the rapid PET images were obtained in 2D acquisition mode. Although the use of 3-dimensional (3D) acquisition could have increased the counting rate and sensitivity, the scatter, random, and dead time would also have been increased, possibly deteriorating image quality. A recent study (27) using a bismuth germanate–based PET system, as was used in the present study, demonstrated that 3D imaging may not necessarily lead to better image quality than does 2D imaging at a comparable acquisition time. For this reason, we did not test 3D acquisition in this study. Direct comparison of the diagnostic performance of 2D and 3D acquisitions for brain imaging needs to be addressed in further studies.
CONCLUSION
The rapid scanning protocol used in this study provided results nearly equivalent to those of the conventional protocol. Although the CVs were larger in the rapid scanning protocol, this factor did not influence the diagnostic accuracy for detecting AD using NEUROSTAT analysis. The rapid scanning protocol may be performed as part of whole-body scanning, making it convenient for patients and useful for building a large brain 18F-FDG PET database.
Acknowledgments
This study was supported in part by a grant for the Development of Advanced Technology for Measurement and Evaluation of Brain Functions, from the Ishikawa Prefecture Collaboration of Regional Entities for the Advancement of Technological Excellence, Japan Science and Technology Corp., Japan, and by a grant for the Knowledge Cluster Initiative (High-Tech Sensing and Knowledge Handling Technology [Brain Technology]), from the Japanese Ministry of Education, Culture, Sports, Science, and Technology, Japan. The authors thank the members of the Ambulatory Department of Neurology and Neurobiology of Aging, Kanazawa University Graduate School of Medical Science, Kanazawa, Japan. The authors also thank Shigeru Sanada, of the Department of Radiologic Technology, School of Health Sciences, Kanazawa University, and Shigeo Hayashi and Masamichi Matsudaira, of the Medical and Pharmacologic Research Center Foundation, for their technical support.
Footnotes
Received Mar. 28, 2005; revision accepted Jul. 11, 2005.
For correspondence or reprints contact: Ichiro Matsunari, MD, PhD, Medical and Pharmacological Research Foundation, Wo 32, Inoyama, Hakui, Ishikawa, 925-0613 Japan.
E-mail: matsunari{at}mprcf.or.jp
REFERENCES
In this issue


Jump to section
Related Articles
Cited By...
- SNMMI Procedure Standard/EANM Practice Guideline for Brain [18F]FDG PET Imaging, Version 2.0
- Limits for Reduction of Acquisition Time and Administered Activity in 18F-FDG PET Studies of Alzheimer Dementia and Frontotemporal Dementia
- Reply: Advantage of Late Scanning in Brain 18F-FDG PET.
- Advantage of Late Scanning in Brain 18F-FDG PET