


Abstract
Structural MRI and functional imaging by SPECT as well as 18F-FDG PET are widely used in the diagnosis of Alzheimer's disease (AD). Metabolic and perfusion reductions in the parietotemporal association cortex are recognized as a diagnostic pattern for AD. Outstanding progress in the diagnostic accuracy of these modalities has been achieved with statistical analysis on a voxel-by-voxel basis after anatomic standardization of individual scans to a standardized brain volume template instead of visual inspection or a volume-of-interest technique. In a very early stage of AD, this statistical approach revealed losses of gray matter in the entorhinal and hippocampal areas and hypometabolism or hypoperfusion in the posterior cingulate cortex and precuneus. This statistical approach also offers a prediction of the conversion from mild cognitive impairment (MCI) to AD. The presence of hypometabolism or hypoperfusion in parietal association areas and entorhinal atrophy at the MCI stage have been reported to predict a rapid conversion to AD. A recent advance in voxel-based statistical analysis has markedly enhanced the value of brain perfusion SPECT in diagnosing early AD at the stage of MCI.
With increasing life expectancy in much of the world, the number of older people at risk of developing dementia is growing rapidly, and Alzheimer's disease (AD) remains the most common cause of dementia in all age groups. AD is a progressive neurodegenerative disorder associated with a disruption of neuronal function and a gradual deterioration in cognition, function, and behavior. AD is pathologically characterized by the presence of amyloid deposition and neurofibrillary tangles, together with the loss of cortical neurons and synapses (1). The most profound and earliest cognitive deficits seem to be impairment of episodic memory—the ability to recall events that are specific to a time and place. Medications such as cholinesterase inhibitors are able to delay the progression of AD (2). Moreover, patients who have AD and in whom the start of cholinesterase inhibitor therapy is delayed demonstrate fewer benefits than do patients starting therapy early in the course of AD (3). This fact has shifted the focus of present studies on AD toward earlier diagnosis and longitudinal investigations to assess the value of therapeutic interventions.
Biomarkers are likely to be very important in these studies on AD. A clinical diagnosis of AD is inaccurate even among experienced investigators in about 10%–15% of cases, and biomarkers might improve the accuracy of diagnosis (4). The histopathologically confirmed sensitivity and specificity of 18F-FDG PET for detecting the presence of AD were 94% and 73%, respectively, as determined by testing performed once and at an early stage of the disease (5). In contrast, clinical evaluation without 18F-FDG PET had histopathologically confirmed sensitivity and specificity of 83%–85% and 50%–55%, respectively, as determined by an entire series of evaluations repeated over a period of years (5). For the development of putative disease-modifying drugs for AD, biomarkers might also serve as a surrogate endpoint of disease severity. When used in this way, biomarkers might be able to reduce sample sizes of clinical trials, and a change in a biomarker could be considered supporting evidence of disease modification.
PET, SPECT, and MRI have been used as imaging biomarkers. Recent advances in instruments have facilitated investigations of functional and structural alterations in fine structures of not only cortical but also subcortical areas with a high spatial resolution. In Japan, 18F-FDG PET for the detection of dementia has not yet been accepted for reimbursement in the health insurance system, and more widely available brain perfusion SPECT and MRI mainly have been used for the imaging diagnosis of AD. Silverman (6) described the superiority of PET over SPECT in diagnosing early AD because of its higher sensitivity and higher spatial resolution, and 18F-FDG PET indeed offers many advantages for detecting abnormalities in a brain affected by AD. SPECT offers the advantages of lower cost and ease of access, which could lead to a large increase in the number of cases being studied with this technique. Few studies have directly compared brain perfusion SPECT and 18F-FDG PET in AD. Messa et al. (7) performed SPECT and 18F-FDG PET in healthy control subjects and patients with mild to moderate AD. They reported that the 2 techniques had similar abilities for delineating reductions in perfusion and metabolism in the temporoparietal cortex and similar diagnostic accuracies. Herholz et al. (8) showed good correspondence between 18F-FDG PET and SPECT for detecting changes in the temporoparietal cortex in mild to moderate AD by using voxel-based statistical image analysis, although 18F-FDG PET demonstrated a more robust separation of patients with AD from healthy volunteers than did SPECT (8). Moreover, brain perfusion SPECT generally correlated with histopathologic changes in the distribution of neurofibrillary pathology in AD (9), although the results for the medial temporal lobe were discordant.
This review describes recent progress in the neuroimaging of AD, with an emphasis on brain perfusion SPECT.
VOXEL-BASED SPECT AND PET ANALYSES
The recent implementation of computer-assisted SPECT and PET analyses affords objective and more reliable assessments of functional abnormalities by means of stereotactic coordinates, relative to the visual interpretation of raw tomographic images. This stereotactic approach is a voxel-by-voxel analysis in the stereotactic space to avoid subjectivity and to adopt the principle of data-driven analysis. Although an alternative approach involving a volume-of-interest (VOI) technique has gained general acceptance, it is limited by the fact that the selection of a sample depends on the observer's a priori choice and hypothesis and leaves large areas of the brain unexplored.
Statistical Parametric Mapping (SPM)
SPM software (10) (Wellcome Department of Cognitive Neurology, University College–London) is the most widely used and evaluated image analysis software in brain imaging research. It has been widely applied for AD and at-risk groups in both cross-sectional and longitudinal analyses. It benefits from an open-source code that permits modification, including approaches that can use voxel-based regression and longitudinal growth-modeling approaches to test hypotheses on trajectories of cognitive decline. Current versions of SPM (e.g., SPM99, SPM2, and SPM5) permit anatomic standardization of SPECT or PET data either with or without MRI coregistration. For default analyses, I use the Montreal Neurologic Institute template to anatomically standardize SPECT and PET data. The image data are smoothed with a gaussian kernel that effectively reduces the number of resolution elements in the analysis. The possibility of type I error is an important consideration with the large number of statistical tests used in voxel-based analyses for a confirmatory research analysis, although correction for multiple comparisons is not necessarily used for the interpretation of clinical studies in a comparison of individual data with a control database. Statistical maps can be generated without any normalization of global intersubject differences in measures of interest or with normalization of the data for variations in measures of the whole brain or a relatively spared reference structure, such as the cerebellum or pons, by use of proportionate scaling or an analysis of covariance.
Three-Dimensional Stereotactic Surface Projection (3D-SSP)
The use of 3D-SSP (11) for SPECT or PET data analysis is an approach that can be performed without structural image data and that transforms SPECT and PET images to a standard stereotactic orientation. This type of analysis differs from typical SPM-based analyses in several ways, primarily by extracting data from the medial and lateral brain surfaces, helping to address the potentially confounding effects of inaccuracies in anatomic standardization, and reducing the combined effects of brain atrophy and partial-volume averaging on the images. Processing steps include the generation of sequential images that can be used for quality control of data analysis, as the first step of alignment and interpolation of images can reveal detector variations and positioning errors missed during the review of transaxial images. Subsequent steps in image analysis include centering the image volume, finding the midsagittal plane, and estimating the anterior commisura–posterior commisura line. Next, data for each brain are transformed into a standard stereotactic space, including first rigid-body translation and rotation with linear scaling and then nonlinear warping based on a thin-plate spline algorithm that makes use of iterative searches and cortical landmarks. The resulting 3-dimensional images are used to generate surface projections by sampling pixels along a vector perpendicular to a plane tangential to the cortical surface. The search starts at the cortical surface, and the depth of the search can be varied but typically is 10–15 mm. After location of the peak pixel along each vector, the value of this peak is transferred to a display format, resulting in 8 standard surface projection images: left and right lateral surface, left and right medial surface, superior surface, inferior surface, anterior surface, and posterior surface. These surface projection images are then compared with reference images for intersubject comparisons. A pixel-by-pixel comparison of these surface projection maps can then be used for intersubject comparisons with either t or z statistics. 3D-SSP has been used extensively in cross-sectional studies of dementia.
Tomographic z Score Mapping
In a software program that is widely used in Japan for the statistical analysis of brain perfusion SPECT data (Figs. 1 and 2) (12–14), voxel-by-voxel z score analysis after voxel normalization to global mean or cerebellar values [z score = (control mean – individual value)/control SD] is performed as described by Minoshima et al. (11). The resulting z score maps are displayed both by overlay on tomographic sections (not attainable with 3D-SSP) and by projection with an averaged z score for a 14-mm thickness to a surface rendering of the anatomically standardized MRI template. Anatomic standardization of SPECT images into a stereotactic space is performed with SPM2. It has been reported that 3D-SSP with 2-dimensional surface projection of cortical activities is less sensitive to artifacts derived from incomplete anatomic standardization of a brain with localized cortical atrophy than is SPM99 (15). However, on 3-dimensional location, 3D-SSP loses information that SPECT images inherently possess. This program also can incorporate SPM results into an automated analysis of z score values as a VOI. A specific VOI can be determined by group comparison of SPECT images for patients with a neuropsychiatric disease with those for healthy volunteers by use of SPM. In this program, a specific VOI for very early AD is incorporated to evaluate tracer uptake in the posterior cingulate gyrus, precuneus, and parietal association cortex (14).
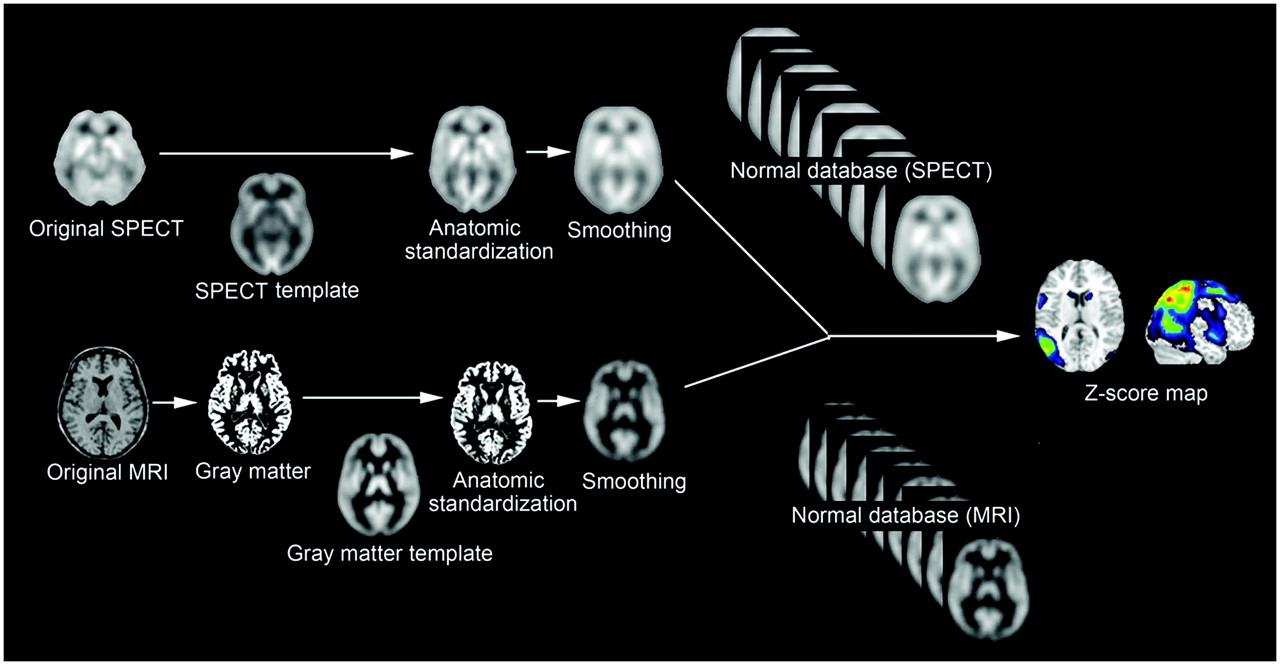
Procedures for statistical image analysis of brain perfusion SPECT and MRI data. Anatomically standardized and then smoothed SPECT or gray matter image of subject is compared with each normal database by z score analysis. Obtained z score maps are displayed by overlay on anatomically standardized MRI template.

Statistical image analysis for 78-y-old woman with amnestic MCI. (A) Brain perfusion SPECT data were analyzed with z score mapping system. Specific VOI for very early AD (bilateral posterior cingulate gyri and precunei and parietal association cortex) is demarcated by red lines on MRI template. Significantly decreased rCBF above z score of 2 was observed within this specific VOI (arrows). (B) Gray matter images extracted from MR images were analyzed with z score mapping system. Specific VOI for very early AD (bilateral medial temporal areas, including parahippocampal gyri and amygdaloid bodies) is demarcated by pink sections on MRI template. Significantly decreased gray matter concentration above z score of 2 was observed within this specific VOI (arrows).
Three indicators for characterizing decreases in regional cerebral blood flow (rCBF) in patients with very early AD have been determined (14). First, the severity of decreases in rCBF in a specific VOI showing a reduction in rCBF in very early AD is obtained from the averaged positive z scores in the VOI. Second, the extent of a region showing a significant reduction in rCBF in the VOI is the percentage of the coordinates with z values exceeding the threshold value of 2. Third, the ratio of the extent of a region showing a significant reduction in rCBF in the VOI to the extent of a region showing a significant reduction in rCBF in the whole brain is also the percentage of the coordinates with z values exceeding the threshold value of 2. This ratio indicates the specificity of the reduction in rCBF in the VOI relative to the whole brain.
Even if a center can construct a “normal” database with high quality and comprising a large number of healthy volunteers, other centers may not be able to use this normal database because of differences in equipment and physical correction algorithms. Because SPECT exhibits greater variations in image quality among different centers than does PET, a special technique may be necessary for sharing a normal database for SPECT. A trial with a Hoffman 3-dimensional brain phantom experiment was conducted to attempt to determine systematic differences between SPECT scanners (12). SPECT images for the same brain phantom were obtained with 2 different scanners. Dividing these 2 phantom images after anatomic standardization by SPM created a 3-dimensional conversion map. This conversion map was applied to convert an anatomically standardized SPECT image obtained with one scanner to that obtained with the other scanner. Although the SPM demonstrated clinically adequate validity for this conversion (12), further validation is required.
VOXEL-BASED MRI ANALYSIS
Volumetric MRI has become increasingly important in the study of AD, particularly as an aid to diagnosis and as a biomarker of disease progression. It is often difficult to evaluate mild atrophy of a region in AD by visual inspection of MR images. On the other hand, volumetric assessment on MRI in routine clinical practice is precluded by the time-consuming nature of VOI analysis, which is dependent on the expertise of the person analyzing the data and for which an automated volume measurement technique is lacking. The recently developed automated method of voxel-based morphometry (VBM) (16) objectively maps a loss of gray matter on a voxel-by-voxel basis after anatomic standardization analogous to that used in functional neuroimaging. The advantage of VBM over analyses based on VOI is that VBM produces unbiased results from exploration of the whole brain. This approach has been reported to show a higher accuracy for discriminating patients with AD from control subjects than has VOI-based analyses (17). A software program that uses VBM for the automated diagnosis of very early AD has been proposed (Figs. 1 and 2) (18).
For VBM, a 3-dimensional volumetric acquisition of a T1-weighted gradient-echo sequence produces a gapless series of thin sections with a thickness of approximately 1 mm. The original method for VBM included 3 processes: anatomic standardization, segmentation, and smoothing. Images were analyzed with SPM. Anatomic standardization with an affine and nonlinear transformation fits each brain to a standard template brain in 3-dimensional space, so as to correct for differences in brain size and shape and to facilitate intersubject averaging. Anatomically standardized MR images are then segmented into gray matter, white matter, cerebrospinal fluid, and other compartments with a modified version of the clustering algorithm, the maximum-likelihood “mixture model” algorithm. The segmentation procedure involves calculating a Bayesian probability for each voxel to determine whether it belongs to a tissue class on the basis of a priori MRI information with nonuniformity correction. Finally, the gray matter images are smoothed by convolving with an isotropic gaussian kernel to use the partial-volume effect to create a spectrum of gray matter intensities. The gray matter intensities are equivalent to the weighted average of gray matter voxels located in the volume fixed by the smoothing kernel. Regional intensities can therefore be taken as equivalent to gray matter concentrations (16).
PARTIAL-VOLUME CORRECTION (PVC)
The more limited spatial resolution of PET and SPECT scanners than of MRI scanners does not allow an exact measurement of the local radiotracer concentration in brain tissue because partial-volume effects cause an underestimation of activity in small structures of the brain. Because brain atrophy accentuates partial-volume effects on PET and SPECT measurements, actual glucose metabolism and rCBF could be underestimated in AD. Therefore, it has been uncertain whether the reductions in glucose metabolism and rCBF observed in AD patients reflect actual reductions or partial-volume effects.
Recent advances in image analysis have made PVC on PET and SPECT images possible with 3 dimensional volumetric T1-weighted MR images. There are 2 MRI-based approaches to PVC. The 2-compartment method (19) corrects PET or SPECT data for the diluting effects of cerebrospinal fluid spaces. The 3-compartment method (20–22) accounts for the effects of partial-volume averaging between gray matter and white matter. In a comparative study of these 2 methods, Meltzer et al. (23) reported greater accuracy for the absolute quantitative measures of the 3-compartment algorithm than for the 2-compartment algorithm. Two-compartment PVC has been reported to be inadequate for the complete recovery of PET or SPECT counts (23). However, the 3-compartment algorithm is more sensitive to errors, particularly image segmentation and image registration, and could give rise to approximately 17% error. In the 3-compartment method, PVC is performed by dividing a gray matter PET or SPECT image by a gray matter MR image that has been segmented from an original MR image and further convoluted with spatial resolution equivalent to that of PET or SPECT on a voxel-by-voxel basis. PET or SPECT data reflect both brain volume losses and functional changes. PVC provides a more accurate determination of the regional pattern of rCBF or glucose metabolism in AD by diminishing the artifactual effects of regional differences in tissue loss on the rCBF or glucose metabolism data.
NORMAL AGING AND SEX DIFFERENCES
The prevalence of AD is below 1% in people aged 60–64 y but shows an almost exponential increase with age, so that in people aged 85 y or older, the prevalence is between 24% and 33% in Western countries (24). Thus, aging is the most obvious risk factor for AD. Moreover, the female-to-male prevalence of AD is 70% and is likely related to the increased life expectancy of women.
In order to clarify whether AD represents a disease rather than exaggerated aging, the relationship between normal aging and neuroimaging findings should be investigated. Sex differences in neuroimaging findings should also be investigated for the construction of a normal database for statistical image analysis. Hanyu et al. (25) reported some sex differences in rCBF patterns in AD patients; men had a more severe decrease in rCBF in the parietal and posterior cingulate cortices, whereas women had a more severe decrease in rCBF in the medial temporal region and frontal lobe.
Numerous investigations on the relationship between advancing age and rCBF or glucose metabolism have been performed. Recent investigations introduced voxel-based analysis in the stereotactic space. In PET studies, the reductions most common with advancing age were observed in the dorsolateral and medial frontal areas and the perisylvian and insular cortices (26). Similar results were obtained in recent SPECT studies. Van Laere (27) reported an age-related decline in rCBF in the anterior cingulate gyrus, bilateral basal ganglia, and left prefrontal, left lateral frontal, left superior temporal, and insular cortices.
In contrast to the many investigations on the effects of aging, there have been few reports on the relationship between age and rCBF or glucose metabolism after PVC. This situation may be attributable to methodologic difficulties and the necessity for the acquisition of 3-dimensional MR images for PVC. Consistent negative correlations between age and rCBF were observed in the bilateral perisylvian and frontal areas before and after PVC in a SPECT study (22). These decreases were independent of differences in global cerebral blood flow between subjects and therefore represented a true age-related redistribution of rCBF. These data suggest a potential true decline in rCBF in these regions with advancing age. On the other hand, Yanase et al. (28) reported that PVC largely resolved negative correlations between age and glucose metabolism in the bilateral perisylvian and medial frontal areas before PVC. These data suggest that an apparent decline in glucose metabolism with advancing age is attributable to regional atrophy.
In contrast to negative correlations, positive correlations between age and rCBF showed marked differences before and after PVC in the SPECT study mentioned earlier (22). Instead of the positive correlation in the limbic areas before PVC, the sensorimotor and parietal areas showed positive correlations after PVC. This change could be explained by the relationship between age and gray matter volume. The perisylvian and sensorimotor areas showed significant atrophy with advancing age, but the limbic areas showed significant preservation of regional gray matter volume in older subjects. Less influence of PVC in the limbic areas in older subjects would lead to a relative increase in rCBF with advancing age. Good et al. (29) studied the effects of aging in 465 normal adult human brains by using the VBM. They observed the relative preservation of gray matter volume symmetrically in the amygdala, hippocampi, entorhinal cortices, and thalami.
Although several investigators have examined sex differences in healthy volunteers by using PET or SPECT, the findings of these studies have been inconsistent and controversial. Sex differences in rCBF in older healthy volunteers were observed with SPECT after PVC (30). Women had higher rCBF in the left inferior frontal gyrus, bilateral middle temporal gyri, and left superior temporal gyrus. Men had higher rCBF in the left superior frontal gyrus, right superior parietal lobule, right postcentral gyrus, right cerebellum, right middle frontal gyrus, right fusiform gyrus, and right precuneus. Sex differences in resting rCBF in the parietal lobes have been reported by other researchers using SPECT. Van Laere et al. (27) reported that women had higher rCBF in the right parietal lobe and bilateral parietal lobes than did men.
EARLY DIAGNOSIS OF AD BY NEUROIMAGING
The significance of memory complaints in subjects who do not yet match the criteria for AD but who are at high risk of developing a full-blown dementia syndrome in the next few years has recently attracted attention. This at-risk state is commonly referred to as mild cognitive impairment (MCI) (31). It has been recognized that the concept of MCI may be heterogeneous, although the most common subtype, that is, amnestic MCI, likely progresses to AD and fulfills the following criteria: memory concern, usually by the patient but preferably corroborated by an informant; objective memory impairment for age; essentially normal general cognitive function, as judged by a physician; ability to perform normal activities of daily living, as judged by a physician; and not demented.
Cerebral Association Cortex
Many researchers have demonstrated metabolic and blood flow reductions in the parietotemporal association cortex (32). This finding has been widely recognized as a diagnostic pattern for AD. The parietotemporal involvement is bilateral, although asymmetry in the degree of perfusion or metabolic reduction is recognized. Thus, it has been reported consistently that the posterior association cortex is the first cortical region to be affected in AD. The deficit spreads to the frontal lobes as the disease progresses, with persisting asymmetry. It has been reported that AD patients with early-onset disease have greater posterior association cortex involvement than patients with late-onset disease (33). On the other hand, the primary motor, sensory, and visual cortices are typically spared until the very severe stages of AD (32).
Posterior Cingulate Gyrus and Precuneus
In amnestic MCI, a decrease in rCBF as well as glucose metabolism in the posterior cingulate gyrus and precuneus has been observed with PET or SPECT (Fig. 2) (34,35). Statistical image analysis with 3D-SSP or SPM has allowed these observations. It is difficult to distinguish a slight decrease in rCBF or metabolism in these areas in patients with early AD by visual inspection because metabolic activity or rCBF in the posterior cingulate gyrus is as high as that in the primary visual cortex in healthy individuals at rest (34). A decrease in rCBF in the posterior cingulate gyrus and precuneus of patients with mild AD but without any loss of gray matter volume has been observed (36). Reductions in PET measures of glucose metabolism and brain perfusion SPECT measures in AD remain even after accounting for PVC; therefore, these reductions are more than just an artifact resulting from an increase in cerebral fluid space (13,37). The superiority of 3D-SSP analysis over visual inspection for discriminating patients with very early AD from control subjects by brain perfusion SPECT has been reported (38). In that report, z scores in the posterior cingulate gyrus and precuneus provided a higher accuracy (86%) for discriminating patients with AD from control subjects than did those in the medial temporal areas, parietal association cortices, or temporal association cortices.
The observation that a reduction in metabolism in these areas predicts a cognitive decline in presymptomatic people indicates that the pathophysiologic process begins well before even mild or questionable dementia is recognized clinically (39). PET measures of glucose hypometabolism reflect decreased synaptic activity attributable to either a loss or a dysfunction of synapses, and regional metabolic deficits observed on PET may reflect projections from dysfunctional neurons in other brain lesions. In nonhuman primates, lesions of the entorhinal cortex, which is the first region to be affected by AD (40), cause a significant and long-lasting metabolic decline in a small set of remote brain regions, especially the inferior parietal, posterior temporal, posterior cingulate, and occipital association cortices and the posterior hippocampal regions (41). Mosconi et al. (42) and Hirao et al. (43) reported functional connectivity between the entorhinal cortex and the posterior cingulate gyrus in AD patients by using 18F-FDG PET and brain perfusion SPECT, respectively. These results suggest that a reduction in rCBF or metabolism in the posterior cingulate gyrus and precuneus indicates that the earliest functional change in AD is a remote effect. Contrary to this hypothesis of a remote effect, some investigators have suggested the presence of pathologic changes in the posterior cingulate gyrus by using VBM to demonstrate localized atrophy in amnestic MCI (44).
According to a longitudinal SPECT study (35), decreases in the rCBF adjusted for relative flow distribution by normalization of global cerebral blood flow in the posterior cingulate gyrus and precuneus became ambiguous as the disease progressed. This finding may be attributable to a greater stability of relative rCBF in these areas than in other cortical areas in the disease process. This stability was also demonstrated by Tonini et al. (45). They reported significant clusters of relative rCBF decreases by using SPM—not in the posterior cingulate gyrus but in the medial part of the temporal lobe in both hemispheres, in the orbital part of the right frontal lobe, and in the inferior part of the right parietal lobe—in a short-term longitudinal evaluation (3 and 6 mo) of mild AD.
The region of the posterior cingulate gyrus and precuneus is known to be important in memory (46). The retrosplenial cingulate cortex receives input from the subiculum and projects to the anterior thalamus, thus providing an alternative route between the hippocampus and the thalamus. This thalamocortical portion of the Papez circuit (entorhinal cortex–hippocampus–mamillary body–anteromedial thalamus–posterior cingulate cortex–entorhinal cortex) (47) may be important in memory, with lesions of the retrosplenial cingulate cortex likely causing memory dysfunction by disrupting this pathway.
The PET study of Desgranges et al. also showed activation in the precuneus during an episodic memory retrieval task but not in a control or semantic memory task (46). Little is known concerning either the functions or the connectivity of the precuneus. Anatomic evidence indicates prefrontal, temporal, occipital, and thalamic connections to the precuneus.
Medial Temporal Areas
There has been controversy as to whether glucose metabolism or rCBF in the medial temporal areas is decreased or not at an early stage of AD. In a SPECT study (21) of patients with mild AD, a significant decrease in absolute rCBF in the amygdala and hippocampus became normal after PVC with a 3-compartment model. These areas have been reported to show marked atrophy from the early stage of AD on (48). Therefore, partial-volume effects would mostly affect these areas on SPECT images. Previous studies of brain perfusion SPECT have reported low rCBF in the hippocampus of patients with probable AD (49). However, most recent investigations with PET scanners with better spatial resolution have not reported such a decrease in the hippocampus (50). These observations suggest that the decrease in rCBF in the hippocampus may be attributable mainly to partial-volume effects on SPECT images. The rCBF per unit volume may be maintained in the medial temporal areas in patients with mild to moderate AD. This maintenance may result from a neuroplastic response in AD. PET measures of glucose metabolism in the entorhinal cortex were most accurate in differentiating subjects with MCI from subjects without MCI (51). The selective decrease in rCBF in the parahippocampal regions may be attributable not to incomplete PVC but rather to a hindrance of the disclosure of accurate pathophysiology by the limitation of the spatial resolution of SPECT (21).
In contrast to most metabolic neuroimaging studies demonstrating absent hippocampal dysfunction in early AD through voxel-based analysis, some investigators have reported evidence for reduced glucose metabolism in the hippocampus by using an MRI-based region-of-interest technique. Mosconi et al. (52) attributed absent hippocampal hypometabolism to inaccurate anatomic standardization in a voxel-based analysis. They observed a significant 14% decrease in absolute glucose metabolism and a significant 18% decrease in volume in the hippocampus of people with MCI relative to healthy control subjects. The use of 2-compartment PVC still resulted in a significant decrease in glucose metabolism in the hippocampus. It is possible that VBM could fail to detect functional abnormalities in relatively small structures, such as the hippocampus, because of failed spatial alignment. Further studies with high-resolution PET (53), with less influence of partial-volume effects, may be necessary for this controversy to be settled.
Numerous structural MRI studies have demonstrated that atrophy of the medial temporal lobe, including the hippocampus and the entorhinal cortex, is a sensitive marker of very early AD (Fig. 2). Of the medial temporal lobe structures, it has been argued that a decreased entorhinal cortex volume may be a particularly sensitive predictor of AD on the basis of tangle deposition in the entorhinal cortex during early AD, with subsequent spread to the hippocampus itself (54).
Neuropathologic studies have also provided detailed information about which specific brain regions are selectively affected in the earliest stage of AD. The initial neuronal lesions of neurofibrillary tangles and neuritic plaques appear to occur in the entorhinal cortex, a portion of the anterior parahippocampal gyrus that receives projections from widespread limbic and association areas and gives rise to the perforant pathway, the major cortical excitatory input to the hippocampus itself (40). Some layers of the entorhinal cortex undergo 40%–60% neuronal depopulation even in the earliest phase of AD (40), when memory impairments and patient complaints are subtle and the symptoms do not reach the threshold for the diagnosis of AD. Chetelat et al. (44) reported significant losses of gray matter predominantly affecting the hippocampal region and cingulate gyri in patients with amnestic MCI by using VBM. The results were in good agreement with the pathologic changes in the amnestic stage of AD. The VBM study of Hirata et al. (18) revealed losses of gray matter selectively in the bilateral medial temporal areas, including the entorhinal areas, in very early AD. In that report, receiver operating characteristic curves for z scores in the bilateral medial temporal areas, including the entorhinal cortex, showed a high accuracy (87.8%) for discriminating patients with very early AD at the MCI stage from normal control subjects. These findings suggest the possibility of using VBM for the early diagnosis of AD. However, care must be taken in this diagnosis. Ishii et al. (55) remarked on differences in VBM results between early-onset AD and late-onset AD. Both AD groups had significantly reduced gray matter in the bilateral medial temporal regions. In addition, the early-onset group had more severe losses of gray matter in the parietal cortex, posterior cingulate gyrus, and precuneus.
PREDICTION OF CONVERSION FROM MCI TO AD
When neuropsychological test performance has been used to define MCI, 12%–15% of patients have been shown to have converted to dementia per annum; this incidence is about 10 times higher than the incidence of dementia in the general population (56). People with MCI comprise a heterogeneous group of individuals who have a variety of clinical outcomes and who are at risk for developing AD. Prediction of the conversion from MCI to AD on the basis of initial neuroimaging studies is an important research topic. A recent longitudinal 18F-FDG PET study reported a high predictive value of reduced uptake in the parietal association areas and a lower predictive value of reduced uptake in the posterior cingulate gyrus (57). Mosconi et al. (58) also reported that, relative to nonconverters, converters (from MCI to AD) demonstrated reduced glucose metabolism in the inferior parietal cortex. These results strongly demonstrate the high predictive value of functional abnormalities in the parietal association areas. In contrast, a longitudinal study (59) suggested a high predictive value of functional abnormalities in the posterior cingulate gyrus. A combination of 18F-FDG PET findings and the presence of apolipoprotein E allele ε4 elevated this predictive value (60).
Using brain perfusion SPECT to compare 52 converters (from MCI to AD) and 24 nonconverters at a 3-y follow-up, Hirao et al. reported reductions in rCBF in the bilateral parietal areas and the precunei in converters relative to nonconverters (Fig. 3) (61). The logistic regression model revealed that a reduction in rCBF in the inferior parietal lobule, angular gyrus, and precuneus had high predictive value and discriminative ability for converters and nonconverters. The data suggest that initial SPECT studies of rCBF in individuals with MCI may be useful in predicting who will convert to AD in the near future. A similar report at a 2-y follow-up in a SPECT study demonstrated that converters showed reduced rCBF specifically in the parietal and temporal lobes, precuneus, and posterior cingulate cortex (62).
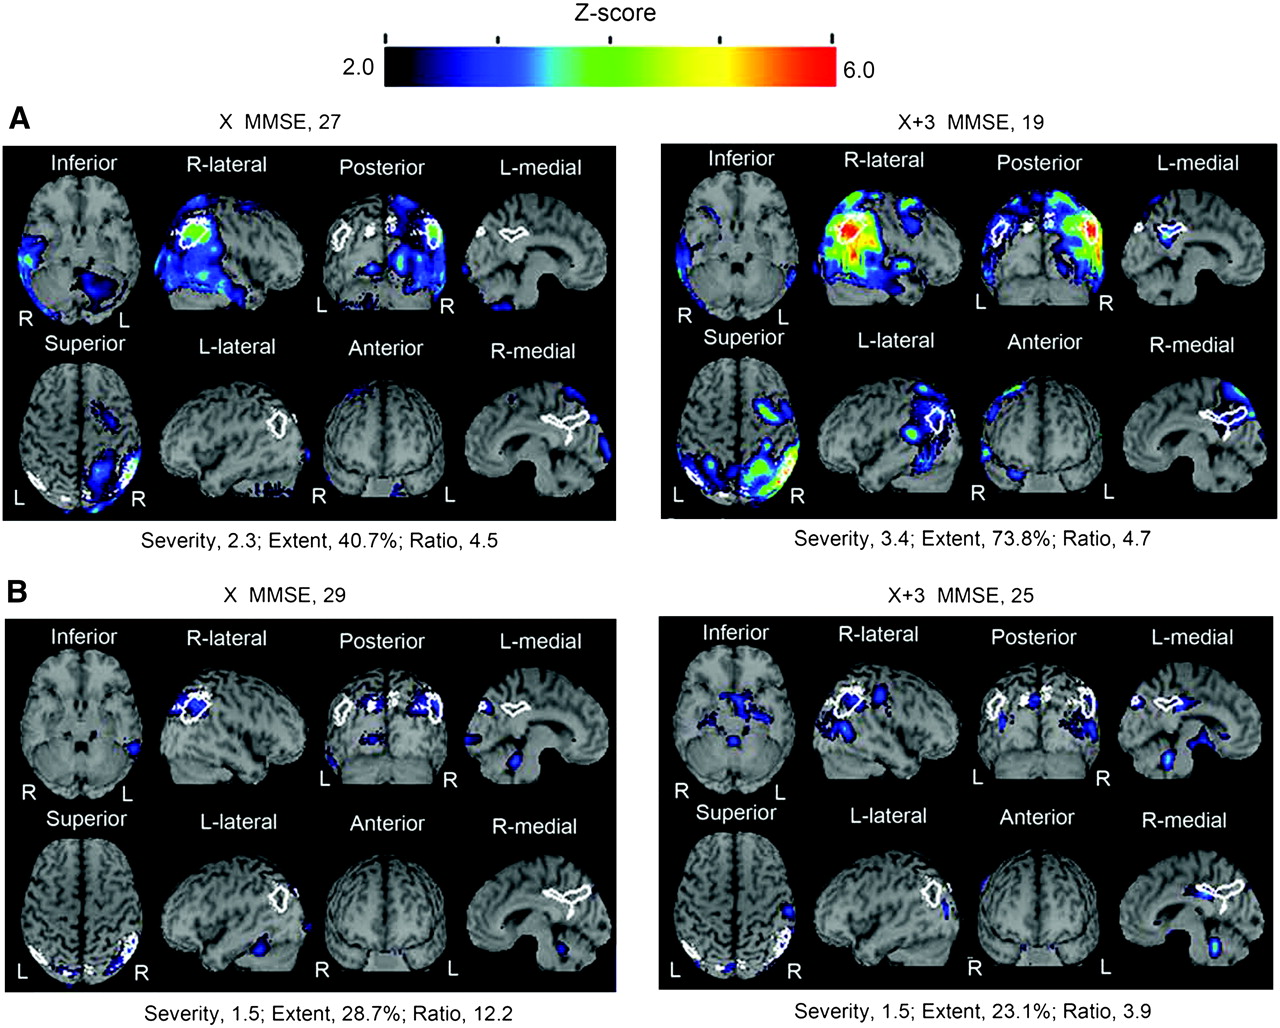
Comparison of z score mapping results for brain perfusion SPECT for converters (from amnestic MCI to AD) and nonconverters over 3 y. (A) For 56-y-old woman who converted from MCI to AD, high values characterizing decreases in rCBF (severity and extent) were seen even at baseline. These values were markedly elevated 3 y later. (B) For 68-y-old man who did not convert from MCI to AD, low values for severity and extent were seen at baseline. These values were not elevated 3 y later. X MMSE = mean score on Mini-Mental State Examination (MMSE) at the initial study; X+3 MMSE = score on MMSE at 3 y.
Killiany et al. (63) used MRI to measure the volumes of the entorhinal cortex and the hippocampus in 137 individuals and found that the volume of the entorhinal cortex distinguished the subjects who were destined to develop dementia with considerable accuracy, whereas the hippocampus measure did not. deToledo-Morrell et al. (64) reported that the right hemisphere entorhinal cortex volume was the best predictor of the conversion from MCI to AD, with a concordance rate of 93.5%. Chetelat et al. (65) reported significantly greater losses of gray matter in the hippocampal area, inferior and middle temporal gyri, posterior cingulate gyrus, and precuneus in converters (from MCI to AD) than in nonconverters. This accelerated atrophy may result from both neurofibrillary tangle accumulation and parallel pathologic processes, such as functional alterations in the posterior cingulate gyrus.
DIFFERENTIAL DIAGNOSIS OF AD AND OTHER TYPES OF DEMENTIA
Dementia with Lewy Bodies (DLB)
DLB is the second most common form of degenerative dementia, accounting for up to 20% of cases in older people in Europe and the United States. It has also been increasingly diagnosed in Japan in parallel with the development of neuroimaging techniques. It is characterized by the clinical triad of fluctuating cognitive impairment, spontaneous parkinsonism, and recurrent visual hallucinations. Consensus clinical criteria have been published (66) and have been shown to have high specificity but may still lack sensitivity. Pathologically, DLB may be classified as a Lewy body disorder or as α-synucleinopathy. Although both DLB and AD show reductions in presynaptic cholinergic transmission from the basal forebrain, in DLB there are also deficits in cholinergic transmission from brain stem nuclei. Postsynaptic cortical muscarinic receptors are more functionally intact in DLB, suggesting a potential responsiveness to cholinergic enhancement. An accurate diagnosis of DLB is clinically important, as the management of psychosis and behavioral disturbances is complicated by sensitivity to neuroleptic medications. There is accumulating evidence to suggest that DLB may be particularly amenable to cholinergic enhancers.
Neuroimaging findings indicated a relative preservation of medial temporal lobe structures and rCBF in DLB (67,68). Significant reductions in dopamine transporter levels were found in the caudate and putamen in subjects with DLB relative to subjects with AD (69). Several studies also indicated subtle differences in perfusion patterns on SPECT or 18F-FDG PET, with a greater degree of occipital hypoperfusion or hypometabolism in DLB than in AD (Fig. 4) (70,71). Minoshima et al. (70) reported a high sensitivity (90%) and a high specificity (80%) for the accuracy of discriminating AD from DLB on the basis of the finding of hypometabolism in the occipital cortex. Recently, an alternative method (cardiac uptake of 123I-metaiodobenzylguanidine) for differentiating AD from DLB was reported (72). Markedly decreased cardiac uptake was observed in DLB because of cardiac sympathetic denervation.
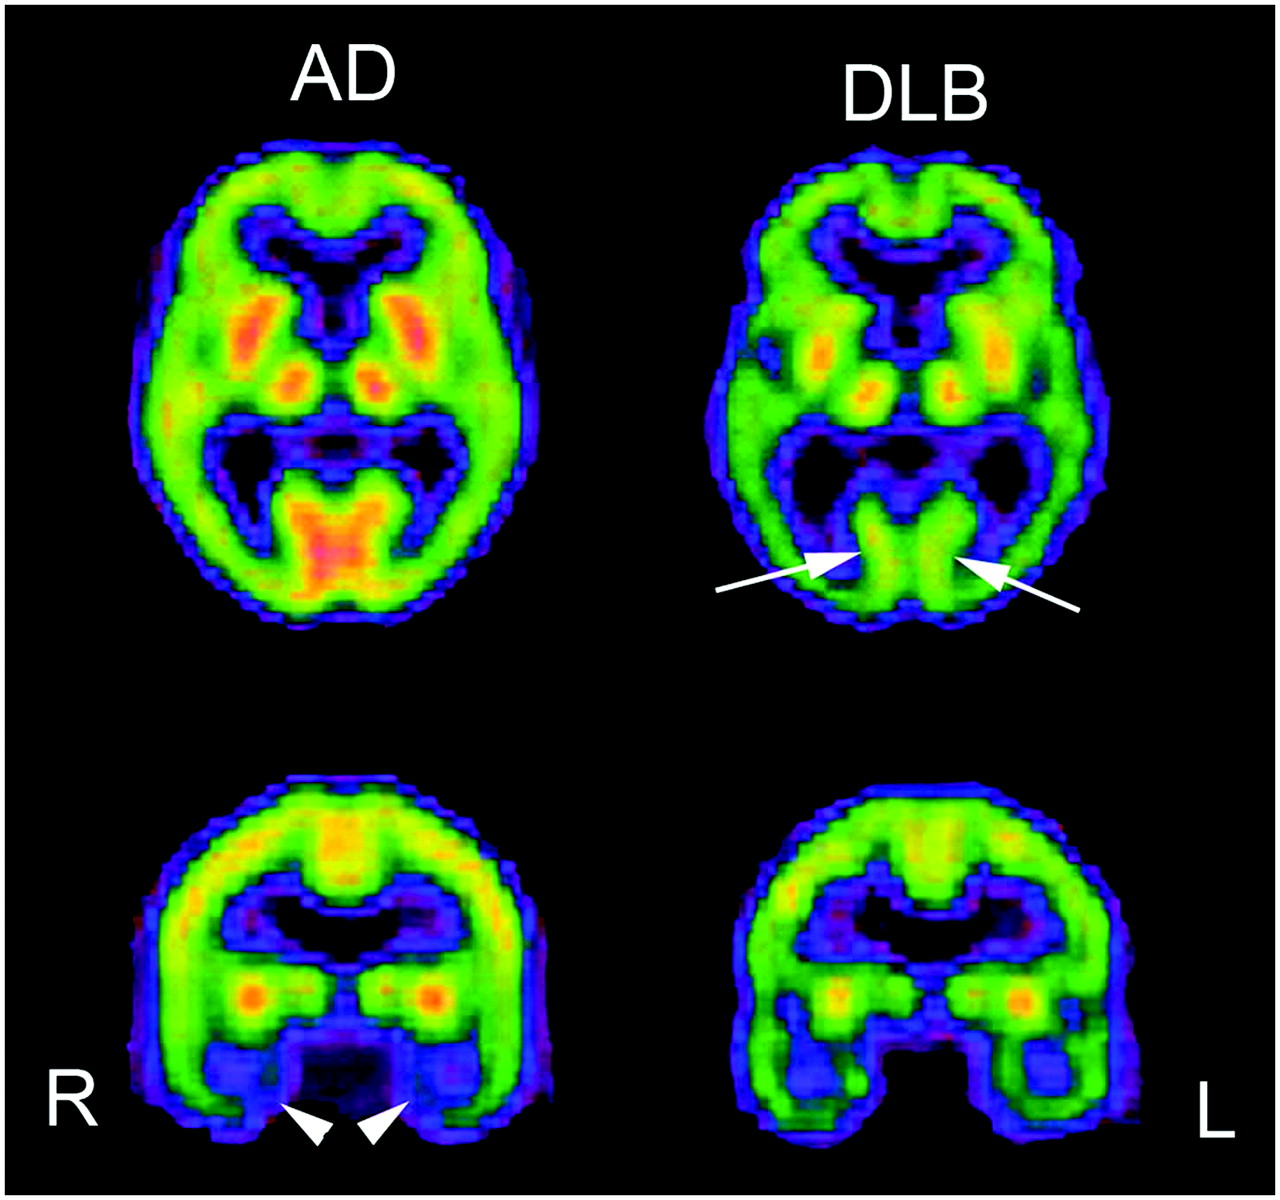
Comparison of brain perfusion SPECT images for moderate AD and moderate DLB. DLB showed lower perfusion in occipital cortex than AD (arrows). In contrast, AD showed lower perfusion in medial temporal areas (arrowheads).
Frontotemporal Dementia (FTD)
FTD is a heterogeneous clinicopathologic syndrome caused by progressive degeneration of the frontal lobes, anterior temporal lobes, or both. In contrast to other types of dementia, FTD involves the relative preservation of memory and visuospatial skills but early alterations in behavior and personality. In the absence of a biologic marker for this disorder, clinicians diagnose FTD on the basis of these criteria and use neuroimaging and other test results as corroborative features. PET and SPECT studies revealed the preferential involvement of the frontotemporal regions in FTD. Jeong et al. (73) demonstrated a decrease in glucose metabolism in extensive cortical regions, such as the frontal and anterior temporal areas, cingulate gyri, uncus, and insula, and subcortical areas, including the basal ganglia and medial thalamic regions; this metabolic feature may help to differentiate FTD from AD or other causes of dementia. Bonte et al. (74) emphasized the presence of a decrease in rCBF in the posterior cingulate gyrus (posterior cingulate sign) for differentiating AD from FTD. Sixteen of 20 AD patients showed the posterior cingulate sign. In contrast, only 1 of 20 FTD patients showed this sign.
EFFECTS OF CHOLINESTERASE INHIBITORS ON CEREBRAL BLOOD FLOW
In addition to the cortical changes that occur in AD, subcortical neuronal losses occur in the nucleus basalis of Meynert, resulting in decreases in the cortical levels of cholinergic markers (75). Pharmacologic, biochemical, and functional imaging observations have implicated a cholinergic defect underlying many behavioral abnormalities in AD. Donepezil hydrochloride is a piperidine-based acetylcholinesterase inhibitor that is clinically used for the symptomatic treatment of mild to moderate AD. Donepezil has been shown to significantly improve cognition and to maintain global function compared with placebo and also to be well tolerated. The results of 24-wk studies have indicated that the well-established benefits of donepezil for cognition may extend to an improvement in the ability to perform complex activities of daily living (76). Although donepezil has been approved in many countries for the treatment of mild to moderate AD, its effect on cerebral blood flow or metabolism has not been fully investigated yet.
Using 99mTc-hexamethylpropyleneamine oxime SPECT with SPM analysis, Mega et al. (77) found that the presence of lower lateral orbital frontal and dorsolateral frontal perfusion suggested a good response to donepezil and was significantly related to behaviors of irritability, disinhibition, and euphoria. Nobili et al. (78) compared the longitudinal SPECT findings over 15 mo, on average, between stabilized and nonstabilized subjects receiving donepezil treatment. No significant difference was found between the baseline and repeat SPECT data in the stabilized subjects. In contrast, in the nonstabilized subjects, a significant reduction in rCBF was found in the frontal, temporal, and parietal superficial cortices and in the occipital precuneus in the right hemisphere and in the frontal and mesial temporal cortices in the left hemisphere. On repeat SPECT, rCBF was found to be significantly lower in the left frontal region in the nonstabilized subjects than in the stabilized subjects. Ceravolo et al. (79) reported that SPM analysis revealed significant increases in rCBF in the right anterior cingulate, dorsolateral prefrontal, and bilateral temporoparietal areas after short-term (4-mo) acetylcholinesterase inhibitor therapy with respect to the baseline. These data suggest that cognitive or behavioral benefits after cholinesterase inhibitor therapy are related to clear increases in rCBF in crucial areas specifically involved in the attention and limbic networks. The longitudinal study of Nakano et al. (80) showed that, before and 1 y after the administration of donepezil, the adjusted rCBF was significantly preserved in the right and left anterior cingulate gyri, right middle temporal gyrus, right inferior parietal lobule, and prefrontal cortex in 15 donepezil-treated AD patients compared with 20 placebo-treated AD patients. Treatment with donepezil appeared to reduce the decline in rCBF, suggesting a preservation of functional brain activity (Fig. 5).
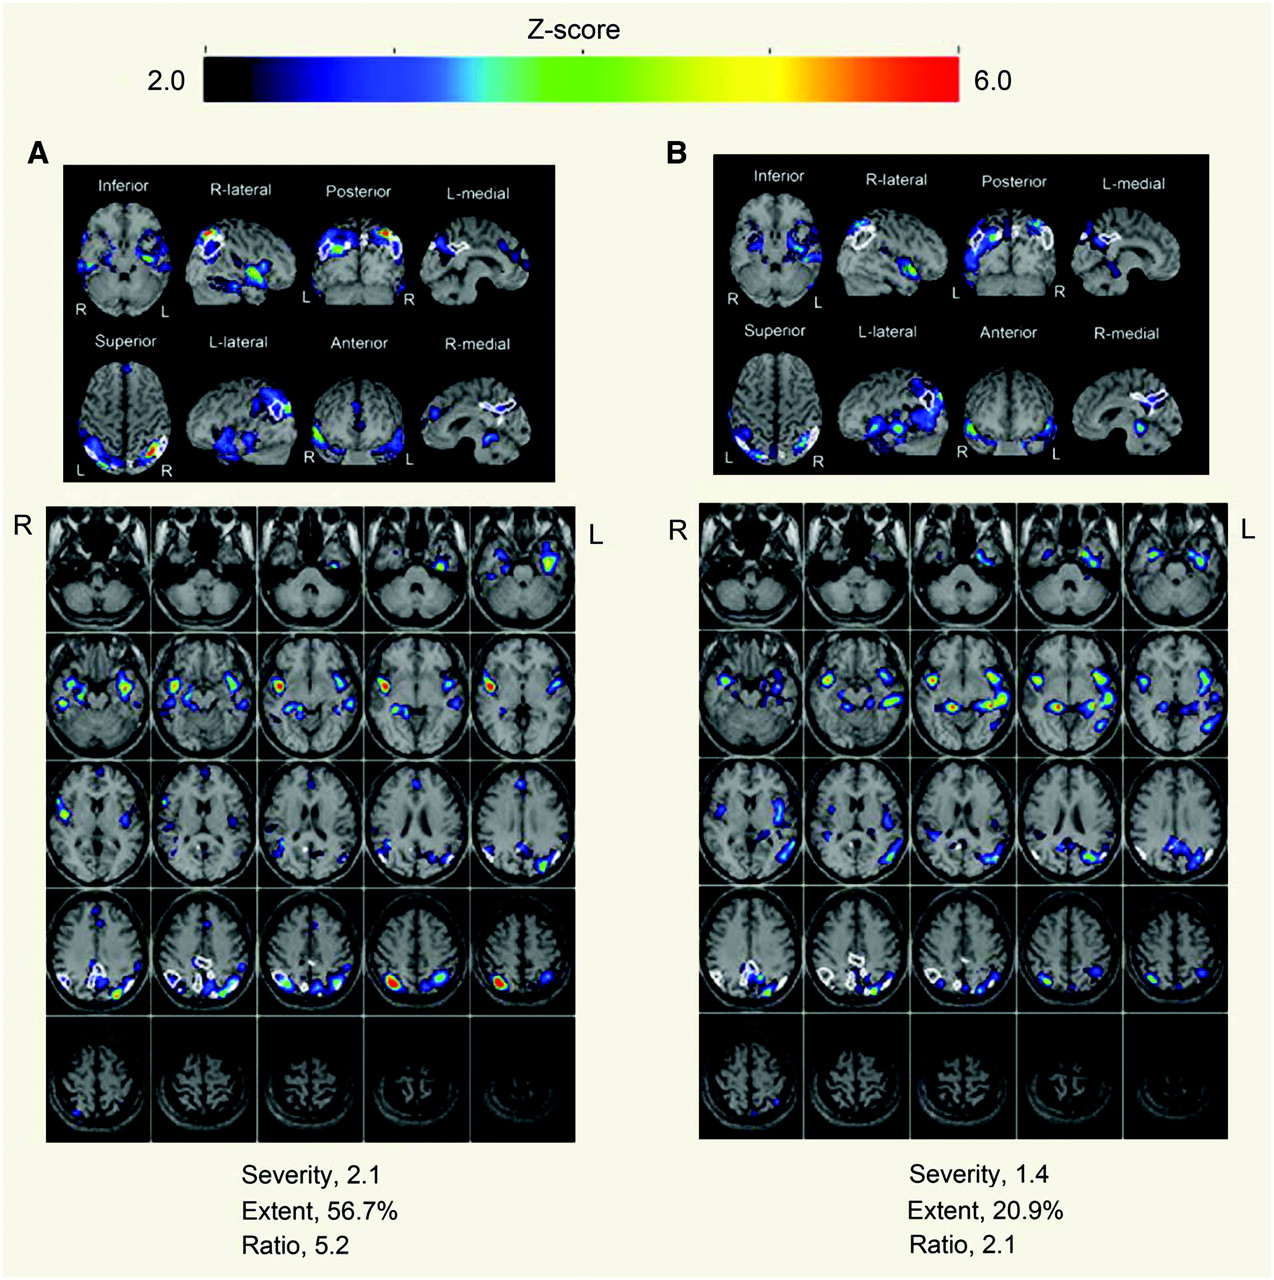
Evaluation with z score mapping system of therapeutic effects of donepezil on brain perfusion SPECT for 68-y-old woman. (A) Baseline study 1 mo before donepezil showed significant decrease in rCBF within specific VOI for early AD. Mini-Mental State Examination (MMSE) score was 5 (out of 30). (B) At 3 mo after start of donepezil administration, all rCBF indices decreased from values at initial study, indicating amelioration of rCBF within specific VOI. MMSE score increased to 14 (out of 30).
CONCLUSION
PET, SPECT, and MRI have played very important roles in diagnosing early AD at the MCI stage, staging AD, differentiating AD from other types of dementia, predicting the conversion from MCI to AD, and assessing therapeutic indications and their effects. A recent advance in voxel-based statistical analysis of PET, SPECT, and MRI data has markedly enhanced the value of neuroimaging in the analysis of dementia.
Footnotes
-
↵* NOTE: FOR CE CREDIT, YOU CAN ACCESS THIS ACTIVITY THROUGH THE SNM WEB SITE (http://www.snm.org/ce_online) THROUGH AUGUST 2008.
-
No potential conflict of interest relevant to this article was reported.
-
COPYRIGHT © 2007 by the Society of Nuclear Medicine, Inc.
References
- 1.↵
- 2.↵
- 3.↵
- 4.↵
- 5.↵
- 6.↵
- 7.↵
- 8.↵
- 9.↵
- 10.↵
- 11.↵
- 12.↵
- 13.↵
- 14.↵
- 15.↵
- 16.↵
- 17.↵
- 18.↵
- 19.↵
- 20.↵
- 21.↵
- 22.↵
- 23.↵
- 24.↵
- 25.↵
- 26.↵
- 27.↵
- 28.↵
- 29.↵
- 30.↵
- 31.↵
- 32.↵
- 33.↵
- 34.↵
- 35.↵
- 36.↵
- 37.↵
- 38.↵
- 39.↵
- 40.↵
- 41.↵
- 42.↵
- 43.↵
- 44.↵
- 45.↵
- 46.↵
- 47.↵
- 48.↵
- 49.↵
- 50.↵
- 51.↵
- 52.↵
- 53.↵
- 54.↵
- 55.↵
- 56.↵
- 57.↵
- 58.↵
- 59.↵
- 60.↵
- 61.↵
- 62.↵
- 63.↵
- 64.↵
- 65.↵
- 66.↵
- 67.↵
- 68.↵
- 69.↵
- 70.↵
- 71.↵
- 72.↵
- 73.↵
- 74.↵
- 75.↵
- 76.↵
- 77.↵
- 78.↵
- 79.↵
- 80.↵
- Received for publication December 24, 2006.
- Accepted for publication April 19, 2007.


Jump to section
- Article
- Abstract
- VOXEL-BASED SPECT AND PET ANALYSES
- VOXEL-BASED MRI ANALYSIS
- PARTIAL-VOLUME CORRECTION (PVC)
- NORMAL AGING AND SEX DIFFERENCES
- EARLY DIAGNOSIS OF AD BY NEUROIMAGING
- PREDICTION OF CONVERSION FROM MCI TO AD
- DIFFERENTIAL DIAGNOSIS OF AD AND OTHER TYPES OF DEMENTIA
- EFFECTS OF CHOLINESTERASE INHIBITORS ON CEREBRAL BLOOD FLOW
- CONCLUSION
- Footnotes
- References
- Figures & Data
- Info & Metrics
Related Articles
Cited By...
- Cholinergic Modulation of Neurovascular Coupling and Neuroimaging Signals
- Feasibility of 3-month melatonin supplementation for brain oxidative stress and sleep in mild cognitive impairment: protocol for a randomised, placebo-controlled study
- Comparison of Early-Phase 11C-Deuterium-L-Deprenyl and 11C-Pittsburgh Compound B PET for Assessing Brain Perfusion in Alzheimer Disease
- Imaging Approaches for Dementia
- Brain perfusion patterns in familial frontotemporal lobar degeneration
- Simultaneous Measurement of Arterial Transit Time, Arterial Blood Volume, and Cerebral Blood Flow Using Arterial Spin-Labeling in Patients with Alzheimer Disease
- Comparison of 18F-FDG PET and Optimized Voxel-Based Morphometry for Detection of Alzheimer's Disease: Aging Effect on Diagnostic Performance