


Abstract
The technique of anatomic standardization and comparison with normal templates is increasingly used in clinical brain SPECT practice and allows automated, operator-independent volume-of-interest (VOI) or voxel-based analysis of whole-brain data. In 2 distinct clinical populations with severe traumatic brain injury and cognitive impairment, this study compared 3 widely available approaches that use normal templates to evaluate SPECT brain perfusion deficits. Methods: In total, 74 subjects were studied. These included 14 patients with severe, traumatic brain injury (group 1; 10 males, 4 females; mean age ± SD, 27.6 ± 8.2 y) and 15 patients with cognitive impairment (group 2; 7 males, 8 females; mean age, 75.8 ± 8.6 y). These data were compared with those from, respectively, 25 and 20 age- and sex-adjusted healthy volunteers. All data were analyzed in 4 ways. Three semiquantitative statistical algorithms were used: statistical parametric mapping (SPM) using SPM99, brain registration and analysis of SPECT studies (BRASS) using a voxelwise region-growing technique, and a predefined VOI approach. These results were compared with visual analysis based on consensus reading by 3 experienced nuclear medicine physicians. Receiver operating characteristic (ROC) analysis was performed at various statistical cutoffs. Moreover, as a measure of regional agreement, relative regional agreement between methods was assessed. Results: In both study groups, BRASS voxel-based analysis was most accurate, as defined by the area under the ROC curve (0.97 for group 1 and 0.96 for group 2). VOI assessment was slightly more accurate than visual consensus analysis, whereas SPM showed, overall, a lower area under the ROC curve. SPM analysis was also significantly less sensitive at thresholds corresponding to low false-positive fractions. Regional analysis showed 83%–92% agreement between all methods. Conclusion: Under clinical conditions, classification of brain SPECT studies can greatly be aided by anatomic standardization techniques and reference to normal data. Under the investigated circumstances, SPM was found to have a lower sensitivity than VOI or voxelwise region-growing techniques, especially at low false-positive fractions.
- SPECT
- statistical parametric mapping
- traumatic brain injury
- cognitive impairment
- anatomic standardization
The technique of anatomic standardization and comparison of individual patient studies with normal templates is increasingly used in clinical practice for SPECT of the brain (1–3). Whereas current analysis methods in most nuclear medicine departments are based on mere visual assessment or on a semiquantitative approach based on operator-dependent and time-consuming manual region-of-interest techniques, the newer technique allows automated and operator-independent volume-of-interest (VOI) or voxel-based analysis of whole-brain data. Such automatic assessment of brain perfusion deficits is attractive because it lowers variability across institutions and enhances the consistency of image interpretation independent of reader experience.
Several software packages are available that allow automated whole-brain analysis of tomographic functional radionuclide brain scans based on anatomic standardization. Statistical parametric mapping (SPM) using SPM99 (Wellcome Department of Cognitive Neurology, London, U.K.) is well known, freely available, and strongly supported by many brain imaging researchers. It offers quantitative voxel-by-voxel analysis both in functional (4,5) and even in structural brain studies (voxel-based morphometry) (6).
Among the other techniques based on anatomic standardization, the technique known as brain registration and analysis of SPECT studies (BRASS; Nuclear Diagnostics, Hägersted, Sweden) is specifically oriented toward routine clinical applications. This software package allows voxelwise comparison of individual studies by means of statistical intensity differences, compared with a mean-and-SD image from a control group, based on region growing of maximally deviating voxels. With the same software, an operator-independent predefined VOI analysis can be performed covering the whole brain, as is currently routine clinical practice in our department (7).
Only a few validation studies on brain perfusion analysis techniques exist because of the intrinsic difficulties in defining the gold standard in a clinical population. The availability of normal reference data obtained in the Ghent Optimized Absolute High-Resolution ECD Adult Database (GO AHEAD) project (8) allowed us to compare individual studies with an extensive set of data from healthy volunteers at different statistical and decision thresholds in a classification design in which patient data and a random set of normal studies were compared with the rest of the normal studies.
Therefore, the aim of this study was to evaluate the diagnostic performance of brain SPECT data in 2 distinct clinical settings using receiver operating characteristic (ROC) analysis. The first, traumatic brain injury (TBI), is one of the most frequent neurologic disorders in the younger population, and SPECT perfusion imaging can reveal abnormalities not detected by CT or MRI that correlate with neuropsychological or behavioral deficits as either acute or long-term complications (9–12). The second, cognitive impairment, is a disorder affecting mostly elderly people. SPECT perfusion imaging has become an accepted technique for differentiation between the pseudodementia of depression and the cognitive impairment that accompanies neurodegeneration caused by conditions such as Alzheimer’s disease (AD), frontal lobe-type dementia, multiinfarct dementia, and others that are less widely prevalent (13–15). Besides the classification experiment, a relative regional comparison was performed at a particular specificity threshold to evaluate agreement and regional sensitivity between the methods.
MATERIALS AND METHODS
Subjects
This study involved 74 subjects who underwent brain SPECT scanning between 1998 and 2000 as part of ongoing research projects. All study protocols were approved by the ethical committee of the Ghent University Hospital.
As a first group, the SPECT scans of 14 patients (10 males, 4 females; age range, 17–39 y; mean age, 27.6 ± 8.2 y) with severe TBI were used. All patients were comatose, intubated, and hyperventilated and underwent intracranial pressure monitoring. Clinical data for the individual patients are summarized in Table 1. All patients had frontal MRI deficits and frontal executive and attentional or memory dysfunction. Structural MRI was performed on each patient during follow-up (average length of follow-up, 8.2 ± 5.8 mo). In all patients, clearly localized hemosiderin deposits were present and atrophy had developed. MRI was performed at an average of 1.5 ± 1.7 mo after brain SPECT. The average time between the brain trauma and the SPECT perfusion scan was 6.7 ± 5.5 mo (range, 1.9–22.1 mo). The clinical follow-up period was, on average, 2.5 ± 0.3 y.
Results for Patients with TBI
The second patient group, with moderate to severe cognitive impairment (group 2), consisted of 15 patients (7 males, 8 females; mean age, 75.8 ± 8.6 y). Clinically, these patients were classified as having AD (n = 12), frontal lobe-type dementia (n = 1), or multiinfarct dementia (n = 2). Demographic, MRI, and neuropsychological findings are summarized in Table 2. The average Mini-Mental State Examination score (16) was 18.6 ± 4.9 (range, 9–23). Structural MRI was performed on 13 patients, within 0 and 3 d of the SPECT investigations (mean, 1 d).
Results for Patients with Cognitive Impairment
In addition, 45 carefully screened healthy volunteers were included, 25 of whom were young (mean age, 26.7 ± 5.8 y) and 20 of whom were older (mean age, 70.0 ± 7.8 y). Neither reference group differed significantly in either age or sex distribution from its respective patient group. The reference subjects formed part of the GO AHEAD project. The screening, selection procedure, and perfusion characteristics were described previously in detail (8).
SPECT Technique
SPECT of cerebral perfusion was performed using 99mTc-ethyl cysteinate dimer (99mTc-ECD) (Neurolite; DuPont Pharmaceuticals Ltd., Brussels, Belgium). All subjects received 925 MBq (25 mCi) of the compound intravenously under standard resting conditions while supine on the scanning couch.
For group 1, imaging was performed on a dual-head gamma camera (Helix; Elscint/General Electric Medical Systems, Haifa, Israel) equipped with parallel-beam collimators. Acquisitions were performed for 20 min, using 60 angles through 360°, step-and-shoot mode, and a zoom of 1.5. For group 2, a triple-head gamma camera (GCA-9300A Toshiba; Dutoit Medical, Wommelgem, Belgium) equipped with fanbeam collimators was used. Acquisitions were performed for 20 min, using 90 angles through 360°.
Reference normal data were acquired on both cameras sequentially (17). For each study group, the corresponding dataset was used from the same camera. For both cameras, a 20-min acquisition was performed with the same parameters as above.
All acquisitions were done in a 128 × 128 matrix. No scatter correction was applied to any of the data. Before reconstruction, fanbeam projections were converted to 128 × 128 parallel data in 4° bins by the floating-point rebinning software as supplied by the manufacturer (parallel pixel size, 1.72 mm). The pixel size for the Elscint reconstructed images was 3.4 mm. Uniform Sorenson attenuation correction was used with a mean attenuation coefficient of 0.09 cm−1 (18). All data were reconstructed using filtered backprojection on the Hermes system (Nuclear Diagnostics). Butterworth filtering with an order of 8 and a cutoff of 0.12 cycle per pixel was applied to the Toshiba data. Because of the lower acquired counts in the patients of group 1, a slightly lower cutoff of 0.10 cycle per pixel was used to obtain similar noise characteristics.
Study Design
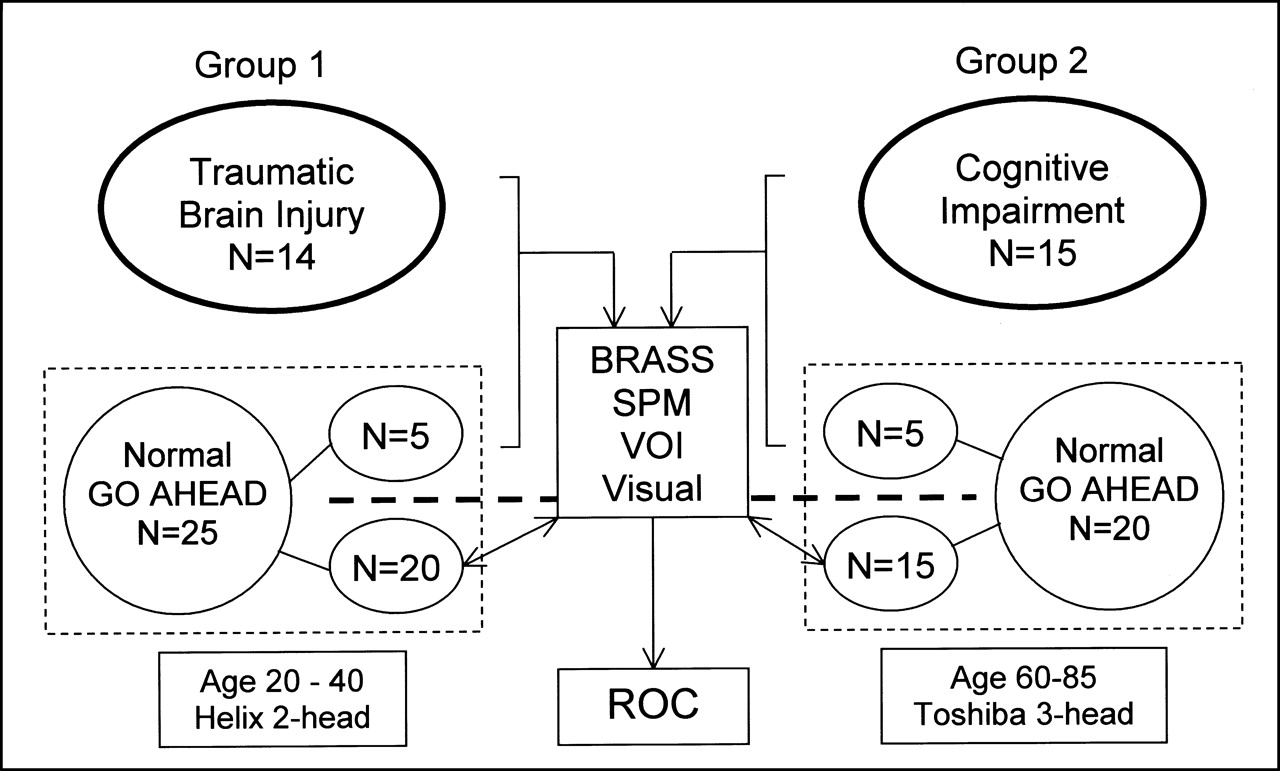
Figure 1 schematically shows the study design. From the reference group of young volunteers, 5 randomly selected scans were added to group 1 (3 males, 2 females; mean age, 26.6 ± 6.8 y) to investigate the sensitivity and specificity of the techniques in classifying abnormal versus normal findings (19). The other 20 studies were used for creation of the reference template in BRASS and for definition of the control population in SPM99. The procedure was repeated for the older age group, in which 5 randomly selected scans were added to group 2 (2 males, 3 females; mean age, 69.9 ± 6.5 y). Again, the other 15 studies were used for the reference template and control population. No statistically significant difference in age or sex distribution existed between the matched patients, added scans, and reference groups.

Schematic study design. Each of 2 groups of well-defined patients was mixed with 5 studies from age- and sex-matched healthy volunteers. These were compared with reference studies from, respectively, 20 and 15 healthy volunteers using visual scoring system and 3 automated methods based on anatomic standardization: predefined VOI analysis, voxelwise analysis based on region growing (BRASS), and SPM (SPM99).
Visual Analysis of Scintigraphic Data
All studies were randomly assigned a number, and all identification tags were removed in the header file (Interfile, version 3.3). Three observers, experienced nuclear medicine physicians involved in brain research, were unaware of image and patient information or of the results of the quantification algorithms. To reduce biases caused by differences in each individual’s head orientation in the SPECT scanner, anatomically standardized SPECT images were used. The images were standardized using automatic registration to an anatomically standardized template with voxel size and slice separation of 3.59 mm (64 × 64 × 64 matrix) (BRASS) (20–22). A count difference cost function with an iterative downhill-simplex search algorithm was used for registration and has been shown to be optimal for SPECT-SPECT coregistration (7).
The SPECT scans of the 39 test subjects were interpreted using a medical workstation screen display (in 3 orientations [transaxial, coronal, and sagittal], each containing 12 images; BRASS and Hermes). No feedback on performance was provided during the analysis. No restraints were placed on monitor viewing distance or reading time. Both study groups were simultaneously assessed by the observers on the same day. A 15-min break was given between the 2 series.
For all studies, 99mTc-ECD uptake activity in 19 predefined VOIs was scored visually. The VOI map used for this study was available to the observers at any time during the study and was the one used in previous studies, with grouping of the frontal and temporal subregions for reasons of simplicity.
All VOIs were scored by the following 4-point visual grading scale: 0 = definitely normal (no defect), 1 = mild defect, 2 = moderate defect, and 3 = severe defect. These 4-point ratings were used to avoid the problem of degeneracy, or incomplete use of the grading scale, as typically occurs for the middle class of 5 divisions. The global scan score was equal to the maximal score for any VOI in the scan. Disagreements in interpretation (<5% of all regions) were resolved by consensus. For the ROC curve construction, data were dichotomized to the presence or absence of perfusion deficits at or greater than the different rating thresholds.
Automatic Quantification of Perfusion Deficits
VOI-Based Analysis.
The anatomically standardized (stereotactic) images were used for automated VOI quantification. Anatomically standardized normal reference templates for each age group were created using the Modelgen software from Nuclear Diagnostics. This module intrinsically generates a mean and variance 3-dimensional composite brain template. The magnitude of activity differences over extended predefined regions was evaluated through automatic calculation of activity in the 19 predefined VOIs (21). For each individual scan, the VOI activity counts were calculated per voxel and normalized to the total number of counts of the complete VOI set. A VOI and, thus, global patient study were defined as abnormal when deviating more than n SDs from the normal reference values, for values of n ranging from 1.5 to 7.
BRASS Voxel-Based Analysis.
The same anatomically standardized images and templates were used as described for the VOI-based analysis. In the BRASS approach, the activity in the patient studies was compared voxel by voxel with the activity in the normal template after count value normalization by the ratio of the total counts over the whole VOI set. The voxels that did not belong to the global VOI region map were masked. The technique is based on a region-growing algorithm in which the extent of the quantitative perfusion defect is defined by summation of the number of profile points falling below the normal limit of counts inside the template-based region map (23). The minimal detectable perfusion deficit was fixed at 0.5 mL (10 voxels). For this technique, an individual study was also considered abnormal when voxels were detected in any region with more than n SDs under the normal values, for n = 2–8. ROC curves were formed by dichotomized classification of abnormal studies at these thresholds.
SPM Analysis.
SPM was done using SPM99. Like the BRASS approach, SPM is based on realignment, anatomic standardization, and voxel-based comparison with reference data, but SPM is also based on a general linear model for subsequent statistical analysis (5,24). The original reconstruction data were converted from Interfile, version 3.3, into ANALYZE format using in-house conversion software (MedCon; Erik Nolf, Ghent University, Ghent, Belgium). All SPM calculations were performed with Matlab, version 5.3 (The MathWorks, Inc., Natick, MA). The SPECT images were anatomically standardized using an affine transformation to the stereotactic Montreal Neurological Institute (MNI) template and bilinear interpolation. The resultant voxel size after normalization was set at 3 × 3 × 3 mm. Before statistical analysis, data were smoothed to account for gyral variations between individuals and to increase the signal-to-noise ratio. For the high-resolution data (Toshiba camera, group 2), an isotropic gaussian kernel of 12.0 mm was used. For group 1, a kernel of 10.2 mm was used, thereby resulting in the same overall smoothness (based on the measured average isotropic resolution of both gamma cameras (17)).
The confounding effect of global activity was removed by proportional scaling to a global value of 50 mL/min/100 g. A gray matter threshold of 0.40 was used. Differences were studied on a voxelwise basis in a categoric population-comparison design with 1 scan per subject (voxelwise t test). Contrasts were defined for every subject to examine areas of lower perfusion. Because intensity and localization of perfusion deficits are clinically the main question, the SPM z map was interrogated at different height thresholds between P = 0.7 and P = 10−8. The negative logarithm of this parameter was taken as the continuous variable in the calculation of the ROC curves. The extent threshold was set at 18 voxels, a threshold that, for all studies, corresponds to a volume of approximately 0.5 mL. Analyses were conducted both with and without correction for multiple comparisons. To evaluate the location of significant clusters, the MNI coordinates were transformed into Talairach-and-Tournoux (20) coordinates and matched to the corresponding VOI map by means of the Talairach Daemon software (Research Imaging Center, University of Texas Health Science Center, San Antonio, TX).
ROC Curves and Statistical Analysis
Statistical significance is reported as being at or above the 95% limit (P ≤ 0.05). Conventional statistics were calculated with SPSS software (version 10.0 for Windows [Microsoft, Redmond, WA]; SPSS Inc., Heverlee, Belgium). Data are expressed as mean ± SD. For the ROC analysis, a paired test was conducted using ROC analysis software (ROCKIT, version 0.9 [Charles E. Metz, University of Chicago, Chicago, IL] for Windows) (25,26). The area below the ROC curve (Az) and its SE were estimated as a measure of the likelihood of a correct test decision using a global decision variable. The estimate Az was computed parametrically using a binegative exponential model. In addition, a probability value was computed to indicate the likelihood of statistical significance for the observed difference in Az values between the analysis methods studied under the null hypothesis, assuming that all analysis methods were equivalent. Sensitivity and specificity were calculated using standard formulas. A t test was conducted at both FPF = 0.05 and FPF = 0.10 (i.e., specificities of 95% and 90%, respectively) to compare the sensitivity of the various analysis methods at low false-positive fractions (FPFs).
RESULTS
Dichotomized Classification Accuracy
Figure 2 shows an example of a voxelwise BRASS and SPM analysis of a patient with TBI and a patient with cognitive impairment caused by AD. Table 3 gives the raw classification data for the different procedures, whereas Figure 3 shows the fitted ROC curves for both study groups and the different analysis methods (Figs. 3A and3B), as well as the study results combined into a single ROC curve (Fig. 3C). For SPM, 2 different ROC curves were generated using uncorrected and corrected intensity thresholds. To cover the full range of lesion detection and classification possibilities, the range of corrected thresholds varied from 0.5 to 0.10, whereas for uncorrected height thresholds, values between 1.0 and 10−6 were considered. Table 4 shows the area under the curve for both study groups and for the combined study results. In this table, the difference statistic between the various analysis methods at low FPF rates is also shown at FPF = 0.05 and 0.10.

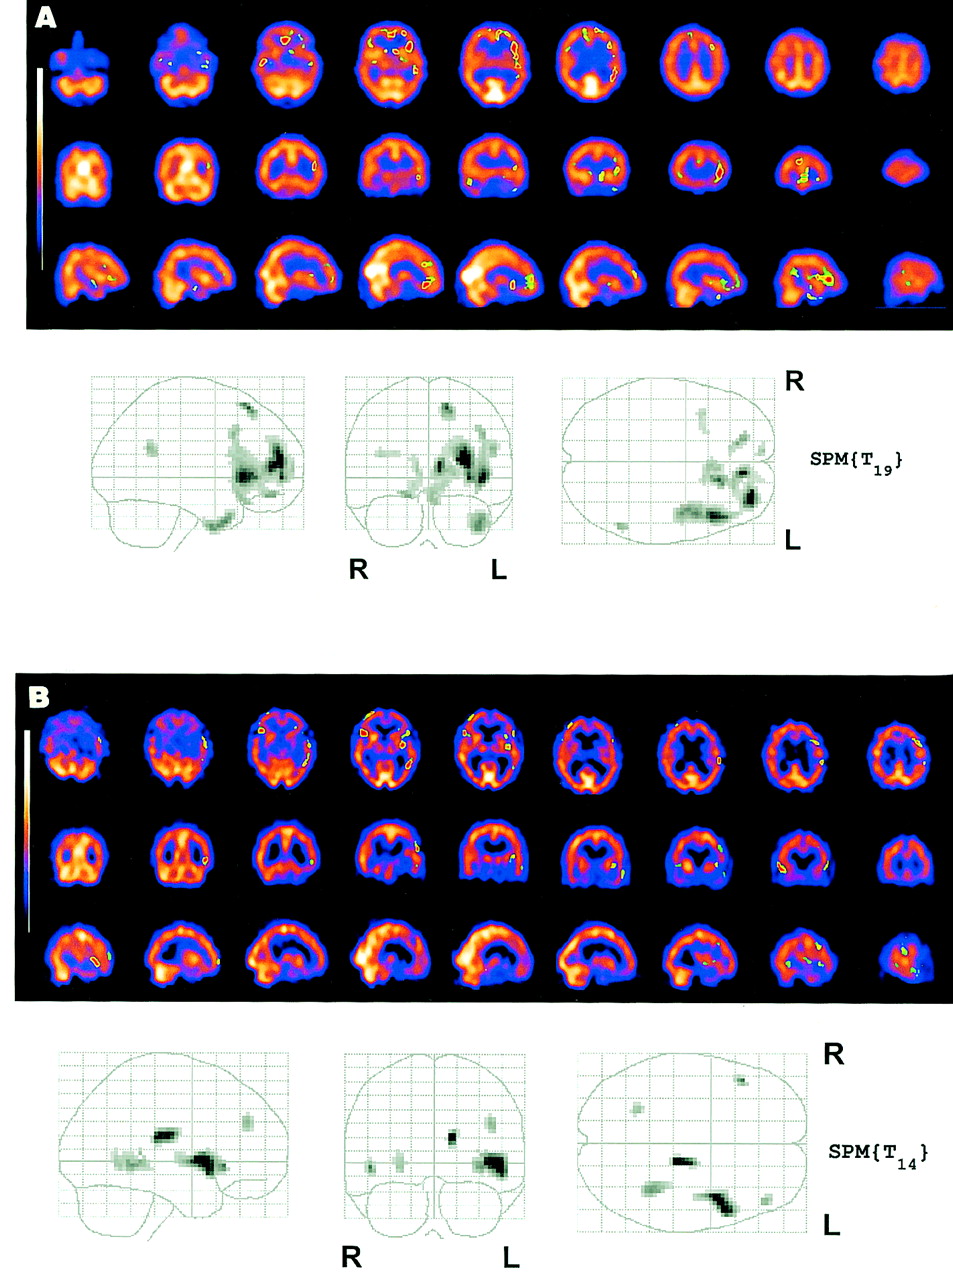
Example of BRASS and SPM analysis for TBI (A) and cognitive impairment from AD (B). Cutoff for BRASS was taken at 3 SDs (minimal detection volume, 0.5 mL); for SPM, uncorrected probability value of 0.0005 was used for height (extent threshold = 18). SPM{Tx} indicates SPM t maps with x degrees of freedom.

ROC curves for TBI group (A), cognitive impairment group (B), and total population (C). Curves represent visual scoring, predefined VOI analysis, voxel-based region growing (BRASS), and SPM (SPM99), both uncorrected (SPM_UC) and corrected for multiple comparisons (SPM_C).
Classification Sensitivity and Specificity for Cognitive Impairment and TBI at Specific Statistical and Judgment Thresholds
Area Under ROC Curve with Error and Statistical Tests of Differences
For the TBI group, both VOI and BRASS voxelwise analyses showed the highest Az values (0.99 and 0.97, respectively), and SPM also scored better than pure visual analysis (0.91 and 0.85, respectively). The differences in Az were not significant, probably because of the relatively small number of patients included in each analysis group. Differences in true-positive fraction (TPF) at an FPF of both 0.05 and 0.10 were significant between BRASS and VOI analyses (P = 0.05 for TPF) and for the VOI analysis versus SPM (P = 0.04 for TPF at FPF = 0.05).
Second, for the cognitive impairment group with visually less severe defects, the area under the curve varied from 0.80 for both SPM and VOI methods to 0.88 for visual assessment and 0.96 for BRASS voxelwise analysis. The difference between BRASS and VOI analyses was significant for both the area test (P = 0.05 for Az) and the TPF test (P = 0.03 at both FPF points). BRASS was also significantly better than SPM for the TPF test (P = 0.03 for TPF at 90% FPF), whereas the area test had a probability value of 0.07.
When both datasets were taken together (i.e., 29 patient studies and 10 studies from healthy volunteers), BRASS showed the highest Az value, 0.96, which was significantly better than the values from the VOI analysis (Az = 0.87, P = 0.03 for TPF; P for Az was just barely not significant: P = 0.06), visual analysis (Az = 0.86, P = 0.02 for TPF; P for Az was also 0.06), and SPM analysis (Az = 0.83, P = 0.01 for TPF, P = 0.03 for Az).
Regional Distribution of Perfusion Deficits
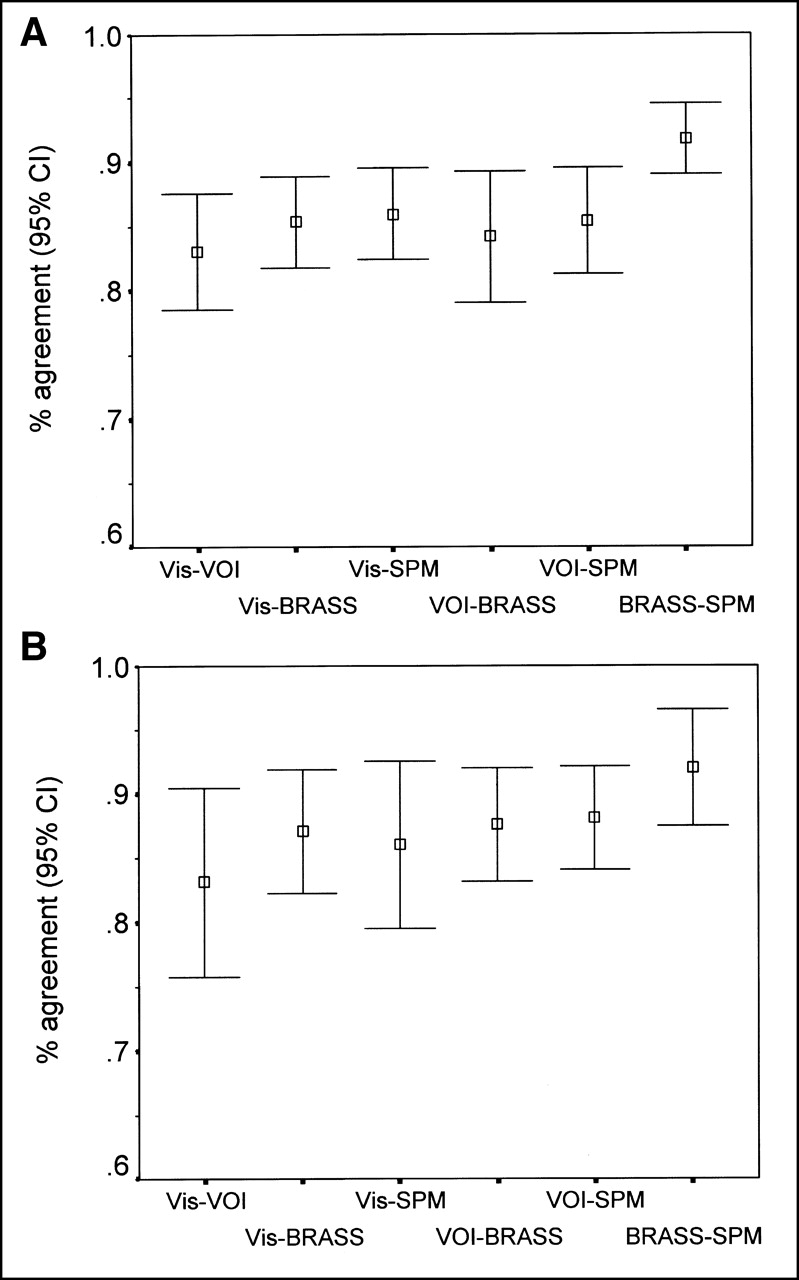
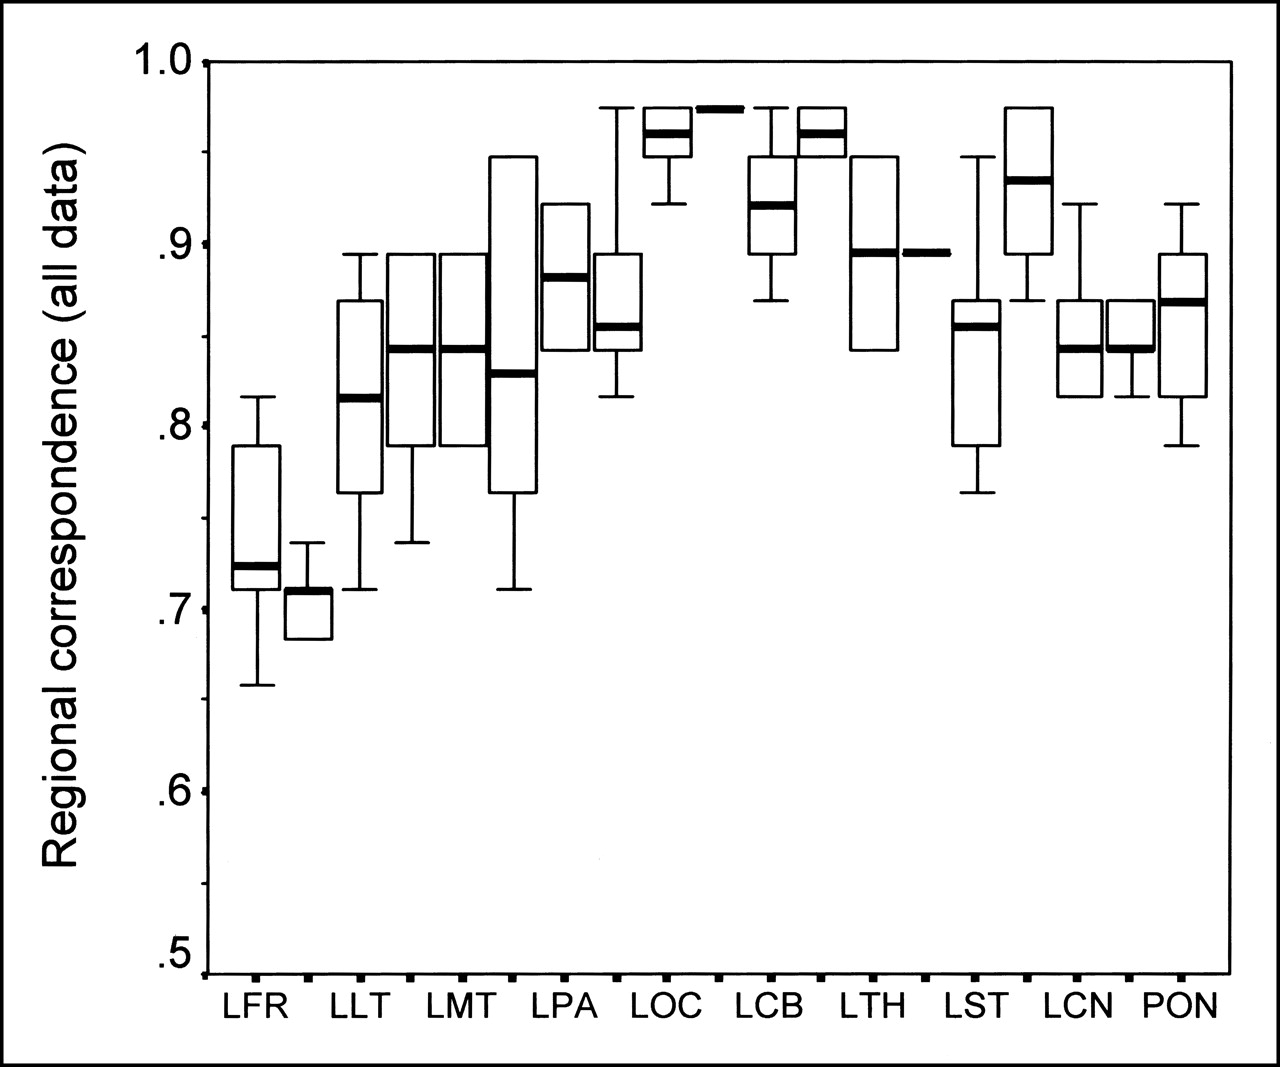
Figure 4 shows the percentage regional agreement for both study groups for perfusion defects. This comparison was based on a threshold value corresponding to at least 70% sensitivity in the obtained ROC curves; as for visual analysis, this threshold value was 1 (mild defect) for both groups. For the VOI analysis, the corresponding cutoff point was 3.0 SDs in both groups. For BRASS, this cutoff was 3.2 and 3.0 SDs for TBI and cognitive impairment, respectively. For SPM, uncorrected thresholds were used at P = 0.0001 and 0.0005, respectively. Regional agreement was said to exist when the findings were considered normal or abnormal by both methods. As can be seen from Figure 4, the highest correspondence was found between the voxel-based techniques. The average between-analysis agreement ranged from 83% to 92%. Figure 5 shows the results for both study groups and the healthy population subdivided into regional categories. The lowest correspondence was in the frontal regions, irrespective of the analysis technique, and ranged from 60% to 80%.

Agreement between regional analysis at cutoffs corresponding to 70% specificity and at least 70% sensitivity for visual (Vis) analysis, VOI analysis, BRASS, and SPM (uncorrected) in TBI group (A) and cognitive impairment group (B). CI = confidence interval.

Between-methods agreement as function of VOI, irrespective of analysis method. Only left-sided volumes are indicated on x-axis; tick mark to right corresponds to contralateral VOI. LCB = left cerebellum; LCN = left caudate head; LFR = left frontal; LLT = left lateral temporal; LMT = left mesial temporal; LOC = left occipital; LPA = left parietal; LST = left striatum; LTH = left thalamus; PON = pons (unpaired).
When the results from the BRASS analysis were considered a relative gold standard (based on its achieving the highest area under the ROC curves), a sensitivity and specificity of 0.56 and 0.92, respectively, were found for visual analysis. For SPM, these increased to 0.69 and 0.96, respectively, whereas sensitivity for the VOI analysis was only 0.31 for a specificity of 0.96, mainly because of the low sensitivity in the cognitive impairment group.
DISCUSSION
In this study, we evaluated 3 methods that are based on automated anatomic standardization and use templates derived from thoroughly screened healthy volunteers. We investigated the dichotomized classification accuracy by means of an ROC analysis. The area under the ROC curve, Az, represents the predicted diagnostic accuracy of the test and, unlike diagnostic sensitivity and specificity, is intrinsically independent of disease prevalence and decision-making threshold. A well-known problem with ROC experiments is the choice of clinical image set, because to have simply a mix of known normal and abnormal cases is not enough. A sufficient number of the observable differences must be subtle, that is, neither too difficult nor too easy, and as a typical guideline an Az value of 0.7–0.8 is the aim (26). Therefore, we decided to consider 2 distinct clinical groups with both severe and relatively mild expected perfusion changes.
From the analysis techniques studied, the BRASS software allowed the most accurate classification, whereas the difference between VOI, visual analysis, and SPM using SPM99 was not significant. Possibly, noise in the measurements caused by the relatively small number of included patients may have obfuscated small differences between the techniques studied. Reducing the noise sources, however, requires large numbers of cases, and including such large numbers is difficult because even more healthy volunteer studies would be necessary both for normal test cases and for the reference population. As an alternative to overcome this constraint, more healthy volunteer studies could be included as true-negative studies in the study population, but at the cost of templat-reference population variability because of the implied lower number of volunteers in the reference population. In another approach, which is similar to a jackknife technique, every normal study would be evaluated with respect to the other normal studies. However, these options were outside the scope of this study.
Because the shape of the ROC curves for different techniques and analysis methods can vary, even with the same Az parameter, the sensitivity at low FPFs (high specificity) was also investigated. The difference in sensitivity, especially of the voxelwise techniques, was striking. Moreover, the results also showed that, under these circumstances, the rather stringent conditions of SPM analysis corrected for multiple comparisons resulted in a low accuracy and especially in a poor sensitivity even at modest specificity values. The often-used P = 0.05 (corrected) threshold resulted in sensitivity and specificity combinations of 0.69 and 0.97, respectively, for the relatively clear-cut severe TBI data but of merely 0.04 and 1.0, respectively, for cognitive impairment studies with milder perfusion defects, that is, a very high specificity at the cost of sensitivity.
In this respect, several factors in the SPM analysis differ from region growing as it is applied in BRASS. First, SPM used a combined intensity-extent approach (27). This approach is more rigid toward the statistical analysis of deviant clusters, using not only the intensity of the defects (as is the case in a BRASS-type approach, in which a mere intensity threshold is set) but also their extent through a joint statistical model (27). Whereas control over false-positive activations or deactivations in SPM is given by a somewhat stringent Bonferroni-type multiple-comparison procedure, such a procedure is intrinsically not available in the BRASS program, and an empirically higher cutoff value (approximately z = 3, as found for these 2 groups studied) is needed to optimize classification accuracy and, hence, provide fewer false-positive classifications. The same is true for the VOI analysis, in which such an empiric, optimal z score threshold is of the same order as the theoretic z at a Bonferroni-corrected P = 0.05/n, with n = 19 (the number of VOIs included in the analysis), which would thus correspond to P = 0.0026 or z = 2.8.
Second, the data in SPM are smoothed rather severely because of the underlying general linear model assumptions (4). The isotropic Gaussian smoothing of 12 mm in full width at half maximum corresponds to a doubling of the intrinsic resolution of the raw SPECT image, and a purely empiric optimum smoothing kernel might exist for the analysis of individual SPECT data, as has been shown in a recent experimental validation study at our department with an experimental signal-known-exactly (SKE) phantom under realistic clinical circumstances (28). However, this study showed that smoothing of up to twice the full width at half maximum of the system provides such an optimum and that, compared with no smoothing at all, this optimum discriminates better (higher z scores or t statistics in SPM) (28). Therefore, the effect of smoothing for SPM and not for BRASS might be significant but not necessarily in favor of BRASS. Given the use of lower-resolution SPECT images for the TBI part of the study, extensive smoothing might not be required to meet the constraints of the SPM theory, and a closer correspondence in final image resolution might be achievable between the SPM and BRASS approaches. A similar deduction implies that the results of this study might not be strictly applicable to flow-metabolism PET studies, because these also are based on different resolution and noise properties.
Third, the intrinsic multiple-comparison correction may be too severe for single-subject SPECT studies without repetition of studies and thus a low number of degrees of freedom, in correspondence with the previously theoretically based expectation of low false-negative results obtained for studies with a relatively low number of degrees of freedom (29). The height (intensity) thresholds at which sensitivity reached an acceptable level > 50% corresponded to “insignificant” values of 0.1–0.5. On the other hand, the same clusters could be detected with lower, uncorrected height thresholds of 0.01–0.05, albeit with more chance of finding a false-positive cluster location.
Also between the results for the 2 patient groups under study, several differences could be observed. The cognitive impairment group had a generally lower Az value, compatible with the expected milder perfusion abnormalities in this group in comparison with the group with severe TBI. In the former group, the visual analysis scored better than did either the VOI or the SPM analysis, as reflected predominantly by the low sensitivity of the latter 2 at high specificity because of a larger number of false-negative cases at relatively nonstringent thresholds (Table 3). The artificial boundaries from the region map and the relatively large neocortical search volumes constitute known inherent disadvantages of VOI techniques. The artificial boundaries imply a preconception about the topography of the functional deficits, and the size of the VOI imposes a spatially smoothing effect (30). In these cases, more precise and smaller focal defects can be observed by the BRASS voxel-based region-growing technique, and observers more easily reported a brain region as abnormal even when only part of the underlying VOI was hypoperfused.
Although BRASS yielded the best ROC characteristics, the accuracy of these results is not certain because a gold standard for comparison is lacking. However, this difficulty is common to all studies of this type, and through simulations (such as described by Van Laere et al. (28)) or through follow-up of patients evaluated by the different methods, a more genuine accuracy and the ultimate utility of these approaches might be determined.
Apart from classifying studies into normal or abnormal categories, we attempted to study regional correspondence between techniques. Unlike the classification experiment, clinical brain studies cannot easily include any true SKE detection task, so the question of the gold standard will always remain because no a priori information or otherwise documented perfusion deficits can be obtained. Because unambiguous location scoring cannot be done with ROC, more sophisticated approaches such as localization ROC (31), in which not only detection but also localization of the defect is considered, or free-response ROC (32) may provide a more rigorous analysis but were outside the scope of this study. The most rigid approach would be realistic simulation studies (33–35) or, preferably, experimental settings (28).
Therefore, the data in this study should be interpreted with caution and regarded as a mere relative comparison of the investigated techniques. The regional study showed that the voxel-based methods agreed best, with a sensitivity and specificity for SPM versus BRASS of 92%. Because the classification showed that consensus of visual observers performs markedly better than do objective automated semiquantitative techniques, we preferred to use BRASS as a relative standard for comparisons, instead of using visual analysis (as is mostly done in cardiologic ROC studies in which only a single parameter, such as quantification, presence of infarcted zone, or intensity, is investigated). Here, however, the visual analysis provided the other techniques with a built-in negative bias, because these could detect practically all lesions detected by the visual analysis while not getting credit for detecting abnormalities missed by this relative gold standard.
This study compared only 2 software packages, but they are, to our knowledge, well known. However, other algorithms based on anatomic standardization, such as ANALYZE (36), Neurostat (37), and 3-dimensional stereotactic surface projection (3D-SSP) (38), are also available. Surface projections such as 3D-SSP software, which has been shown to improve diagnostic performance over direct visual interpretation (39), were not considered because they reveal only neocortical changes. In contrast, the investigated techniques are applicable to any neurodegenerative, cerebrovascular, or functional psychiatric abnormalities, in which subcortical circuits are often involved. From our results, we anticipate that the packages based on similar approaches may, through their use of anatomic standardization, allow a more operator-independent and accurate analysis of individual clinical SPECT scans.
Apart from these considerations, some other methodologic aspects need to be addressed. First, image coregistration may improve through the use of a priori anatomic information, such as from MRI studies. However, because the Hermes software currently does not allow nonlinear warping, and because digital structural data are available for only a few of the patients referred for brain SPECT, such an approach was not followed. Nevertheless, nonlinear warping to standardized space may enhance the performance and accuracy of automated brain analysis methods (1). Because, in both approaches, anatomic standardization was through linear (affine) parameters, the results are expected not to be influenced by spatial normalization accuracy.
Second, activity normalization of the images as performed by all 3 automated methods is limited by known shortcomings. Lesions can disrupt the coregistration, spatial normalization, and quantification of scans. For patients with relatively severe perfusion deficits (e.g., severe head trauma, cerebrovascular accidents, or end-stage AD), an alternative would be to use a masked activity normalization on visibly normal reference areas in both patient and control groups (i.e., lesion masking (40)). Such lesion masking may also improve detection sensitivity and needs further investigation in different clinical populations.
This study confirmed the feasibility of both SPM and BRASS voxel-based analyses in daily clinical routine. Nevertheless, although maintaining a desired high specificity, SPM using a combined extent-intensity approach for defining significant clusters had a low sensitivity for this type of SPECT study (even with 20 age-matched healthy volunteers). In principle, both methods can be used with minimal and standardized user interaction and, once the appropriate threshold is chosen, thus allow a completely objective individual-patient analysis. These automated software approaches that improve diagnostic performance without requiring new, costly computer hardware should therefore be advocated. For this purpose, transferable normal databases (17) that can be optimized for the existing SPECT equipment are, of course, also required. Under such circumstances, a simple and traceable manipulation of the data from conventionally acquired, typical brain scans can be performed with virtually no increase in scan time, additional cost, or long-standing observer experience. This issue may be of particular clinical importance in laboratories with less expertise in brain SPECT interpretation.
CONCLUSION
Our clinical evaluation of automated semiquantitative analysis of brain perfusion SPECT showed that a more accurate, objective analysis of whole-brain SPECT data is possible. Whereas voxelwise analysis using BRASS showed the highest classification accuracy, a VOI analysis may be preferred over a purely visual scaling. SPM should be investigated further before its routine clinical use can be advocated over other existing methods.
Acknowledgments
This study was supported by a Special Research Grant from Ghent University and the Flemish Government (BOZF 01104699). The authors also thank the International Atomic Energy Agency for its support, which assisted in making this study possible.
Footnotes
Received Jun. 4, 2001; revision accepted Dec. 18, 2001.
For correspondence or reprints contact: Koenraad J. Van Laere, MD, PhD, DrSc, Division of Nuclear Medicine, P7, Ghent University Hospital, De Pintelaan 185, 9000 Ghent, Belgium.
E-mail: koen.vanlaere{at}rug.ac.be
REFERENCES
In this issue


Jump to section
Related Articles
Cited By...
- Construction and Evaluation of Multitracer Small-Animal PET Probabilistic Atlases for Voxel-Based Functional Mapping of the Rat Brain
- Is Iterative Reconstruction an Alternative to Filtered Backprojection in Routine Processing of Dopamine Transporter SPECT Studies?
- Clinical Testing of an Optimized Software Solution for an Automated, Observer-Independent Evaluation of Dopamine Transporter SPECT Studies
- Neuroimaging tools to rate regional atrophy, subcortical cerebrovascular disease, and regional cerebral blood flow and metabolism: consensus paper of the EADC