


Abstract
The standardization of preclinical imaging is a key factor to ensure the reliability, reproducibility, validity, and translatability of preclinical data. Preclinical standardization has been slowly progressing in recent years and has mainly been performed within a single institution, whereas little has been done in regards to multicenter standardization between facilities. This study aimed to investigate the comparability among preclinical imaging facilities in terms of PET data acquisition and analysis. In the first step, basic PET scans were obtained in 4 different preclinical imaging facilities to compare their standard imaging protocol for 18F-FDG. In the second step, the influence of the personnel performing the experiments and the experimental equipment used in the experiment were compared. In the third step, the influence of the image analysis on the reproducibility and comparability of the acquired data was determined. Distinct differences in the uptake behavior of the 4 standard imaging protocols were determined for the investigated organs (brain, left ventricle, liver, and muscle) due to different animal handling procedures before and during the scans (e.g., fasting vs. nonfasting, glucose levels, temperature regulation vs. constant temperature warming). Significant differences in the uptake behavior in the brain were detected when the same imaging protocol was used but executed by different personnel and using different experimental animal handling equipment. An influence of the person analyzing the data was detected for most of the organs, when the volumes of interest were manually drawn by the investigators. Coregistration of the PET to an MR image and drawing the volume of interest based on anatomic information yielded reproducible results among investigators. It has been demonstrated that there is a huge demand for standardization among multiple institutions.
Small-animal in vivo imaging has revealed its striking potential as a research tool to noninvasively study the onset and progression of multiple diseases (1,2), to evaluate novel PET tracers (3,4), or to contribute to drug development (1,5,6). It further enables in vivo therapy monitoring and bridges the gap of straightforward translation to clinical applications (1,3,7,8). Dedicated hardware has been developed that facilitates small-animal scanners and their use, for example, PET, MRI or CT (1,9,10).
There is an ongoing discussion about the reliability, reproducibility, validity, and translatability of preclinical data (11–15). So far, the standardization of preclinical imaging has mainly been performed within a single institution and multiple factors have been determined that influence the uptake pattern, for example (16–19). However, standardization is a key factor in certain imaging procedures (e.g., longitudinal studies or therapy monitoring) and its importance should not be understated.
Today, preclinical imaging studies are usually not conducted in a multicenter approach. The comparison of preclinical imaging results among different institutes is nevertheless of highest importance to be able to exploit the published research data, to benefit from it and to build up on the existing knowledge. Over the last few years, preclinical multicenter studies have been proposed in biomedical research to overcome poor translatability from bench to bedside (12,20). However, the comparison of multicenter studies has so far proven to be challenging (12,20), whereas clear protocols have been created in the clinical setting, for example, the response evaluation criteria in solid tumors (RECIST) guidelines or the European Association of Nuclear Medicine (EANM) procedure guidelines for tumor imaging version 2.0 to allow comparison of data acquired at multiple institutes (21–23).
This study aimed to investigate the comparability among preclinical imaging facilities in terms of PET data acquisition and analysis. The study design is based on determining the 18F-FDG uptake pattern in healthy mice (same strain, age, and sex) within 4 different preclinical imaging facilities. Three separate experiments were conducted. In the first step, basic PET scans were obtained in the 4 laboratories to compare their standard imaging protocols for 18F-FDG. In the second step, the influence of the personnel performing the experiments and the experimental animal handling equipment used in the study were compared. In the third experiment, we determined the influence of the image analysis on the comparability of the results.
MATERIALS AND METHODS
Data are reported in accordance with the “Animal Research: Reporting of In Vivo Experiments” guidelines (24).
System Descriptions, Data Acquisition, and Reconstruction
Phantom and animal experiments were performed in 4 different institutes using different scanners (scanners A and D: Inveon dedicated PET [DPET; Siemens Healthineers]; scanner B: Inveon MultiModality [MM] PET/CT [Siemens Healthineers]; scanner C: Focus 220 [Siemens Healthineers]). Detailed descriptions of the scanners can be found in the literature (25–28). Emission measurements were performed using the standard energy and timing window of each institute (Table 1). Emission list-mode data were acquired for 600 s after a 55-min asleep uptake followed by a transmission acquisition to correct for attenuation. Transmission data were acquired for each animal immediately after the emission acquisition, except for experiment 2 (protocol laboratory D and personnel laboratory D) for which the transmission was acquired before the experiment, and 1 attenuation file was generated for all animals. Transmission acquisition in laboratory C was acquired before the emission scan; Table 1 provides detailed transmission parameters.
Overview of the Used Scanner Types, Software Versions, Energy and Timing Windows, Attenuation Methods, As Well As of the Used Reconstruction Parameters
The acquired emission data were corrected for decay, dead time and randoms; normalization was applied. Calibration of the scanner was performed in-house according to the individual standard protocol. Reconstruction was performed using the 2-dimensional ordered-subset expectation maximization algorithm (OSEM2D) using the software packages and reconstruction parameters as listed in Table 1.
Phantom Experiments
To determine general variations in the overall performance of the individual scanners, the National Electrical Manufacturers Association (NEMA) NU 4-2008 image quality phantom (29) was measured at each site. The phantom was filled with 3.7 MBq of 18F. The acquired data were reconstructed using OSEM2D without attenuation correction to prevent a potential influence of the different transmission measurements. The reconstructed data were analyzed by the same investigator from laboratory A using a self-written script to determine the recovery coefficients (RCs), spillover ratios (SORs) in water and air, and percentage standard deviation (%SD) according to the standardized NEMA protocol (29).
Mice
All animal experiments were approved by the appropriate governmental agency at each site and were performed according to the local regulations. In total, 50 healthy female C57BL/6 mice (7–12 wk, 20.18 ± 1.60 g [46 animals were used for image analysis]) were purchased individually by each facility (10 mice per site) from Charles River Laboratories. The animals were kept on a 12:12-h light–dark cycle (laboratory B: dim phase before and after a 12:12-h cycle, laboratory D: 14:10 h) and were supplied with unlimited autoclaved food and water. In a first experiment, 40 mice were used to evaluate the laboratory-specific 18F-FDG standard imaging protocol, for which 10 animals were used in each laboratory. Animals were directly delivered to each site, arrived at least 1 wk before the start of the experiment, and were housed in each laboratory animal facility (laboratories A, B and D: specific-pathogen-free isolated ventilated cages; laboratory C: individual-ventilated polysulfone type III cages). In a second experiment, 10 animals were used in laboratory D to determine the influence of animal handling, movable animal handling equipment, and personnel on the reproducibility.
Supplemental Tables 1A and 1B (supplemental materials are available at http://jnm.snmjournals.org) provide a detailed overview of the number of animals used for each individual group and analysis, the animal facilities, the mean body weight of each individual group, the measured glucose levels, and the mean injected activity 55 min after injection for each group.
Experiment 1: Laboratory-Specific 18F-FDG Standard Imaging Protocol
To determine differences based on the individual laboratory-specific 18F-FDG standard imaging protocols, 7–10 healthy female C57BL/6 mice were measured at each site (Supplemental Table 1A). Each laboratory used its standard 18F-FDG protocol, including the standard animal preparation (with or without fasting), heating devices, animal beds, and anesthesia systems. The preset conditions that each laboratory was asked to follow included isoflurane for anesthesia, an asleep and warmed uptake time of 55 min, followed by a 10-min emission scan and the standard transmission scan to correct for attenuation.
Standard Imaging Protocols
Scanner/Laboratory A
All animals were fasted 10 h before the first injection. The mice were anesthetized with 1.5% isoflurane vaporized in 1.0 L/min of oxygen gas (mixture not moisturized) using a dedicated vaporizer (Vetland). Blood samples were taken by a retrobulbar puncture to determine glucose levels before tracer injection using the Glucose 201+ device (HemoCue GmbH). A catheter was placed in a lateral tail vein, and 12.03 ± 0.38 MBq of 18F-FDG was injected as a bolus (volume ∼100 µL) followed by a saline flush (volume ∼50 µL). The mice were kept under anesthesia in a warmed (constant temperature) anesthesia box to ensure an asleep uptake of tracer for 55 min and then transferred to the standard Inveon animal bed covered with a heating pad (CWE Inc.) for PET acquisition. The animals were measured consecutively. During the PET scan, the body temperature was maintained at 37°C using a rectal probe with a feedback control unit (TC-1000; CWE). The respiratory rate was not monitored during the scan, and the isoflurane concentration was kept constant. Emission scans were carried out between 8:30 am and 1:30 pm.
Scanner/Laboratory B
All animals were fasted 2 h before the first injection. The animals were anesthetized with 1.5%–2.0% isoflurane vaporized in 0.8 L/min of oxygen gas (anesthesia was manually adjusted depending on respiration rate, mixture was not moisturized) using a dedicated vaporizer (Vetland). Blood samples were taken by a puncture of a tail vein to determine glucose levels before tracer injection using a Freestyle Freedom Lite device (Abbott Diabetes Care Inc.). A catheter was placed in a lateral tail vein, and 12.00 ± 0.53 MBq of 18F-FDG was injected as a bolus followed by a saline flush. The mice were kept under anesthesia in a warmed (temperature 38°C) anesthesia box to ensure an asleep uptake of tracer for 55 min and then transferred to the standard Inveon animal bed covered with a heating pad (BioVet, m2m imaging corp.) for PET acquisition. The heating pad was set to 37°C without a feedback control unit. The respiratory rate was monitored (43.4 ± 16.4 respirations per minute [rpm, n = 9]) by placing a respiratory sensor underneath the animal (BioVet). The animals were measured consecutively. Emission scans were carried out between 10 am and 3:05 pm.
Scanner/Laboratory C
Animals were fasted individually starting 6 h before the tracer injection. For this, the respective animals were transferred in a new cage and held separately for 6 h based on the planned tracer injection time. The mice were anesthetized with 1%–2% isoflurane vaporized in approximately 0.5 L/min of oxygen gas (anesthesia was manually adjusted depending on respiration rate, mixture was moisturized) using a dedicated vaporizer (Vaporizer Sigma Delta, UNO BV). Blood samples were taken by a puncture of a leg vein to determine glucose levels before tracer injection using the Freestyle Lite device (Abbott Diabetes Care Inc.). A catheter was placed in the lateral tail vein, and 6.61 ± 1.90 MBq of 18F-FDG diluted in 100 µL of saline was injected as a continuous infusion of 1 min, followed by flushing the catheter for 30 s with saline (volume: 100 µL). The mice were placed on warmed animal beds (BioVet, m2m imaging corp.) and kept under anesthesia for the uptake time. Temperature of the heating device (BioVet, m2m imaging corp.) was set to 38°C without a feedback control unit. Two animals were measured simultaneously, placed side-by-side. The respiratory rate and temperature (sensors were placed underneath the animals) were monitored (SA Instruments Inc.) of 1 animal per scan. Of 10 animals, 7 were used for analysis; 3 died during the preparation. Emission scans were carried out between 1:55 pm and 5:30 pm.
Scanner/Laboratory D
All animals were not fasted. The animals were individually anesthetized with 1.8 ± 0.2% isoflurane vaporized in 0.6 L/min of oxygen gas using dedicated vaporizers (Ohmeda Isotec 4, GE Healthcare; anesthesia was manually adjusted depending on respiration rate, mixture was moisturized). Blood samples were taken by a puncture of the saphenous vein to determine glucose levels before tracer injection using a Contour XT device (Ascendia Diabetes Care Deutschland GmbH). A catheter was placed in a lateral tail vein, and 8.04 ± 0.75 MBq of 18F-FDG was injected as a bolus (injection and flush volume: 100 µL). The mice were kept under anesthesia in a warmed (constant temperature) anesthesia box to ensure an asleep uptake of tracer for 55 min and then transferred to a heated double-mouse animal bed (Minerve; temperature set to 37°C) for PET acquisition. Two animals were placed side-by-side and measured simultaneously. The respiratory rate of one animal was monitored using a respiratory pad underneath the animal (BioVet, m2m imaging corp.); the respiratory rate of the second animal was monitored intermittently by visual inspection. Anesthesia was adapted individually to achieve a respiratory rate between 60 and 80 breaths per minute (70.9 ± 9.9 rpm [n = 8]). The acquisitions of 2 animals had to be repeated 3 days later due to a misalignment within the field of view. Emission scans were carried out between 11:30 am and 2:30 pm.
Supplemental Table 2 provides a detailed comparison of the standard imaging protocols and equipment in experiment 1 for each laboratory.
All reconstructed images from the different laboratories were analyzed nonblinded by 1 person using the software package Inveon Research Workplace (IRW, Siemens Healthineers, version 4.2). For the brain, the PET data were manually registered to an MRI atlas image template (created in-house, same animal strain), and a 3-dimensional volume of interest (VOI) was drawn over the entire brain (volume: 516.2 mm3) and transferred to the PET images. The same brain VOI was used for all images. To determine the uptake in the left ventricle, a cylindrical VOI was placed over the entire heart, and a fixed threshold (72.8% of the maximum VOI value, visually assigned using the first dataset) was applied for all images (volume: 19.7–47.5 mm3). For the liver (volume: 34.1 mm3) and muscle (volume: 14.4 mm3), VOIs were drawn on the first dataset, and the same VOIs were used for all datasets. VOIs for the liver and muscle did not cover the entire organ.
Experiment 2: Influence of Animal Handling and Personnel on Data Comparability
To determine the impact of animal handling and personnel on the comparability of 18F-FDG uptake and quantification, 10 healthy female C57BL/6 mice were measured in laboratory D using 3 different setups/protocols (Supplemental Table 1B and Supplemental Fig. 1):
Standard imaging protocol of laboratory D, animal handling equipment (anesthesia and temperature units, glucose level devices) of laboratory D, and personnel of laboratory D performing the scans (experiment was performed within 11 am–1 pm).
Standard imaging protocol of laboratory A, animal handling equipment of laboratory D, and personnel of laboratory D performing the scans (experiment was performed within 9 am–1:45 pm).
Standard imaging protocol of laboratory A, animal handling equipment of laboratory A, and personnel of laboratory A performing the scans (experiment was performed within 9 am–1:45 pm).
The respective imaging protocols of laboratories A and D were executed as described in experiment 1. The 3 different setups were scanned with at least a break of 4 d in between to allow the animals to recover and to avoid potential influences due to repeated anesthesia. Detailed information on injected activity, measured glucose levels, and body weight of the animals can be found in Supplemental Table 1B.
Image analysis was performed nonblinded by the same person as in experiment 1 using the same approaches for the individual VOIs. One mouse was excluded from the data analysis due to unilateral abnormal kidney uptake.
Experiment 3: Influence of Image Analysis on Data Comparability
To investigate the impact of the image analysis on the data comparability, the datasets acquired in experiment 2 were analyzed by trained personnel from laboratories A and D using their individual standard analysis for the respective organs. The investigator from laboratory A was the same person, who analyzed the datasets for experiments 1 and 2. The analysis was performed nonblinded and performed as previously described. The investigator from laboratory D used the software package IRW (Siemens Healthineers, version 4.2.0.8) to create VOIs for the left ventricle, liver, and muscle, and the software package PMOD (PMOD Technologies, version 3.703) for the brain VOI. This analysis was performed using blinded datasets. The PET image was registered to an MRI brain template provided with the software, and a VOI covering the entire brain based on the corresponding template was loaded. VOIs for the left ventricle were created using a fixed VOI cylinder covering the entire organ and by individually applying a threshold (50% of the maximum VOI values; threshold was visually assigned using a stepwise color scale for the first image; volume left ventricle: 64.80 - 121.90 mm3). For the liver and the muscle, individual VOIs were drawn for each animal (volume liver: 37.9–113.7 mm3, muscle: 20.2–76.8 mm3).
Statistical Analysis
The acquired data were tested for statistical significance using the JMP software package (SAS Institute, version 11.1.1). The Tukey–Kramer test was used to compare differences between the laboratory-specific 18F-FDG standard imaging protocols (experiment 1). Statistically significant differences in experiment 2 were calculated with the 1-sample t test (comparison of imaging data and glucose levels acquired in laboratory D) and the 2-sample t test (comparison of imaging data acquired in laboratory D to the imaging data acquired in laboratory A). The 2-sample t test was applied to determine differences between the 2 time point measurements of scanner D. Statistical analysis for experiment 3 was performed using the 1-sample t test. For all statistical tests, the α-level was set to 0.05, and the Bonferroni-Holm method was applied to correct for multiple comparisons (applied separately for each organ). Test results that were statistically significant are marked with an asterisk (*). The data are represented as the mean ± SD.
RESULTS
Phantom Experiments
Figure 1 depicts the RCs (A), the SORs in water and air (B), and the %SD (C) for the evaluated scanners. The RCs of all scanners were overall in a comparable range. Scanner C revealed the lowest recovery coefficients for the 3 smallest rods due to the lower scanners’ sensitivity and wider energy window used compared with scanner’s A, B, and D (30). The highest RC for the largest rod was detected for scanner D (second acquisition). The highest SOR in water and air was determined for scanner C and the lowest SOR for scanner B. The determination of the %SD as a measure of noise yielded the highest %SD for scanner C, whereas the first acquisition with scanner D revealed the lowest %SD. The comparison of the RCs, SOR, and %SD of the 2 acquisitions performed with scanner D revealed reproducible values.
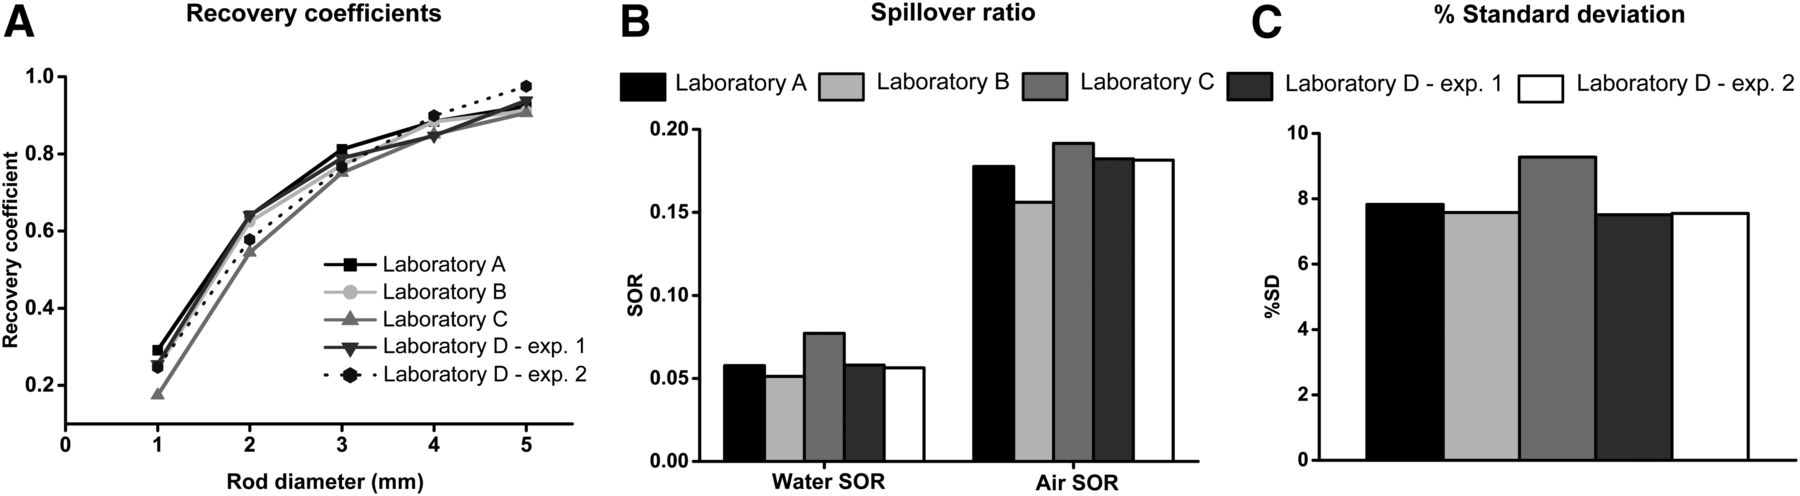
Image quality phantom data. RCs for different rod sizes (A), SOR for water and air (B), and %SD as a measure of noise (C) for all 4 scanners are depicted. Data were reconstructed using OSEM2D without attenuation correction. Exp = experiment.
Experiment 1: Laboratory-Specific 18F-FDG Standard Imaging Protocol
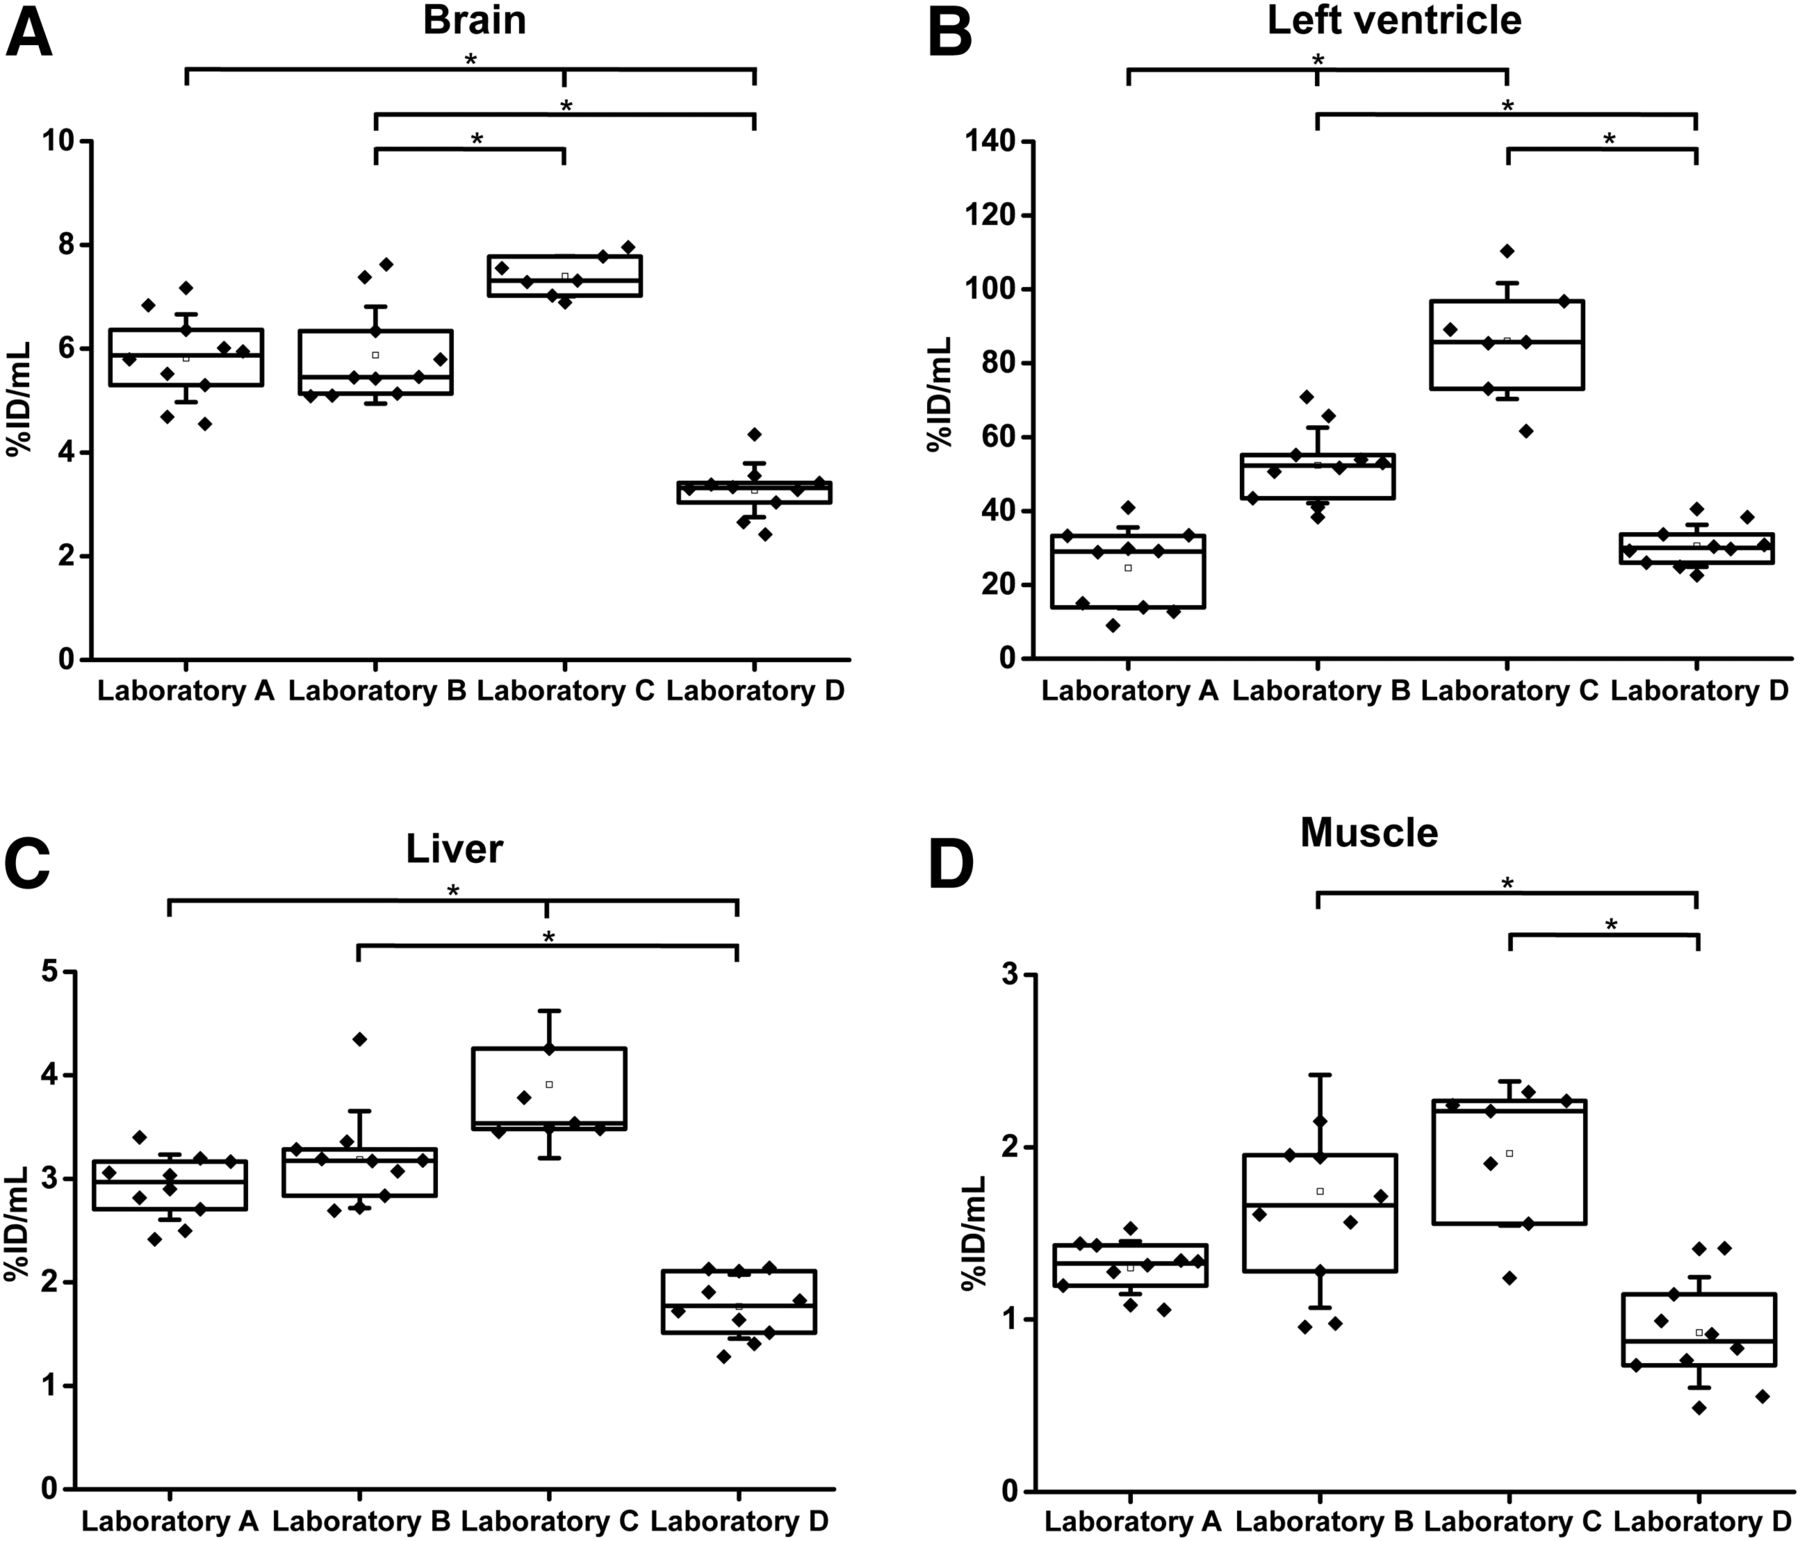
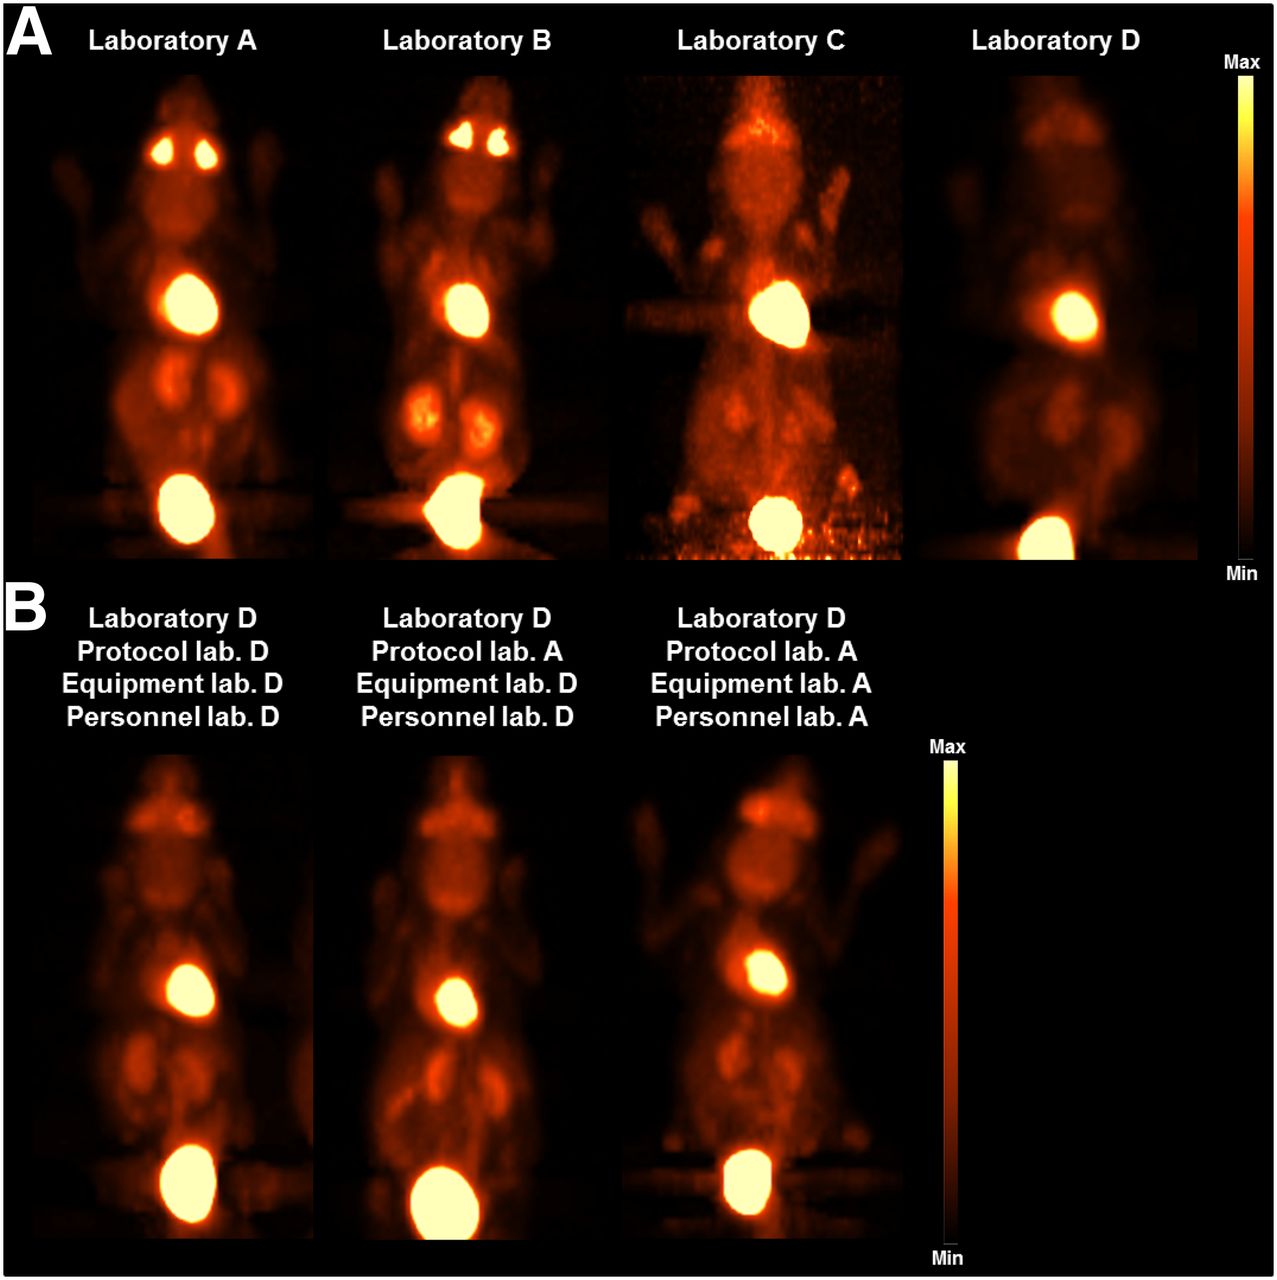
Figure 2 illustrates the percentage injected dose per milliliter (%ID/mL) for the brain (A), left ventricle (B), liver (C), and muscle (D) for the respective 18F-FDG standard imaging protocols of each laboratory. Figure 3A depicts representative images of the In vitro biodistribution. The data were reconstructed using the OSEM2D algorithm, and no attenuation correction was applied. Supplemental Figure 2 depicts the results with attenuation correction.

Experiment 1: laboratory-specific 18F-FDG standard imaging protocols. Quantitative analysis (%injected dose/mL [%ID/mL]) of 18F-FDG uptake is depicted for the brain (A), left ventricle (B), liver (C), and muscle (D) for the 4 laboratories (laboratories A, B, and D: n = 10, laboratory C: n = 7). Data were reconstructed using OSEM2D without attenuation correction. Box plots show group means, 25% and 75% confidence intervals, 1 upper and lower SD of the mean, and all individual data points. Test results that were statistically significant using the Tukey–Kramer test (with α = 5%) after Bonferroni–Holm correction (applied separately for each organ) are marked with asterisk.

Representative images of 18F-FDG biodistribution. (A) Experiment 1: laboratory-specific 18F-FDG standard imaging protocols. (B) Experiment 2: influence of animal handling and personnel on the data comparability. Lab = laboratory.
For the brain, the lowest mean %ID/mL was measured in laboratory D, whereas the highest uptake was identified in laboratory C. The same pattern was identified for the liver and the muscle. Left ventricle uptake was the lowest using the standard imaging protocol of laboratory A and the highest in laboratory C.
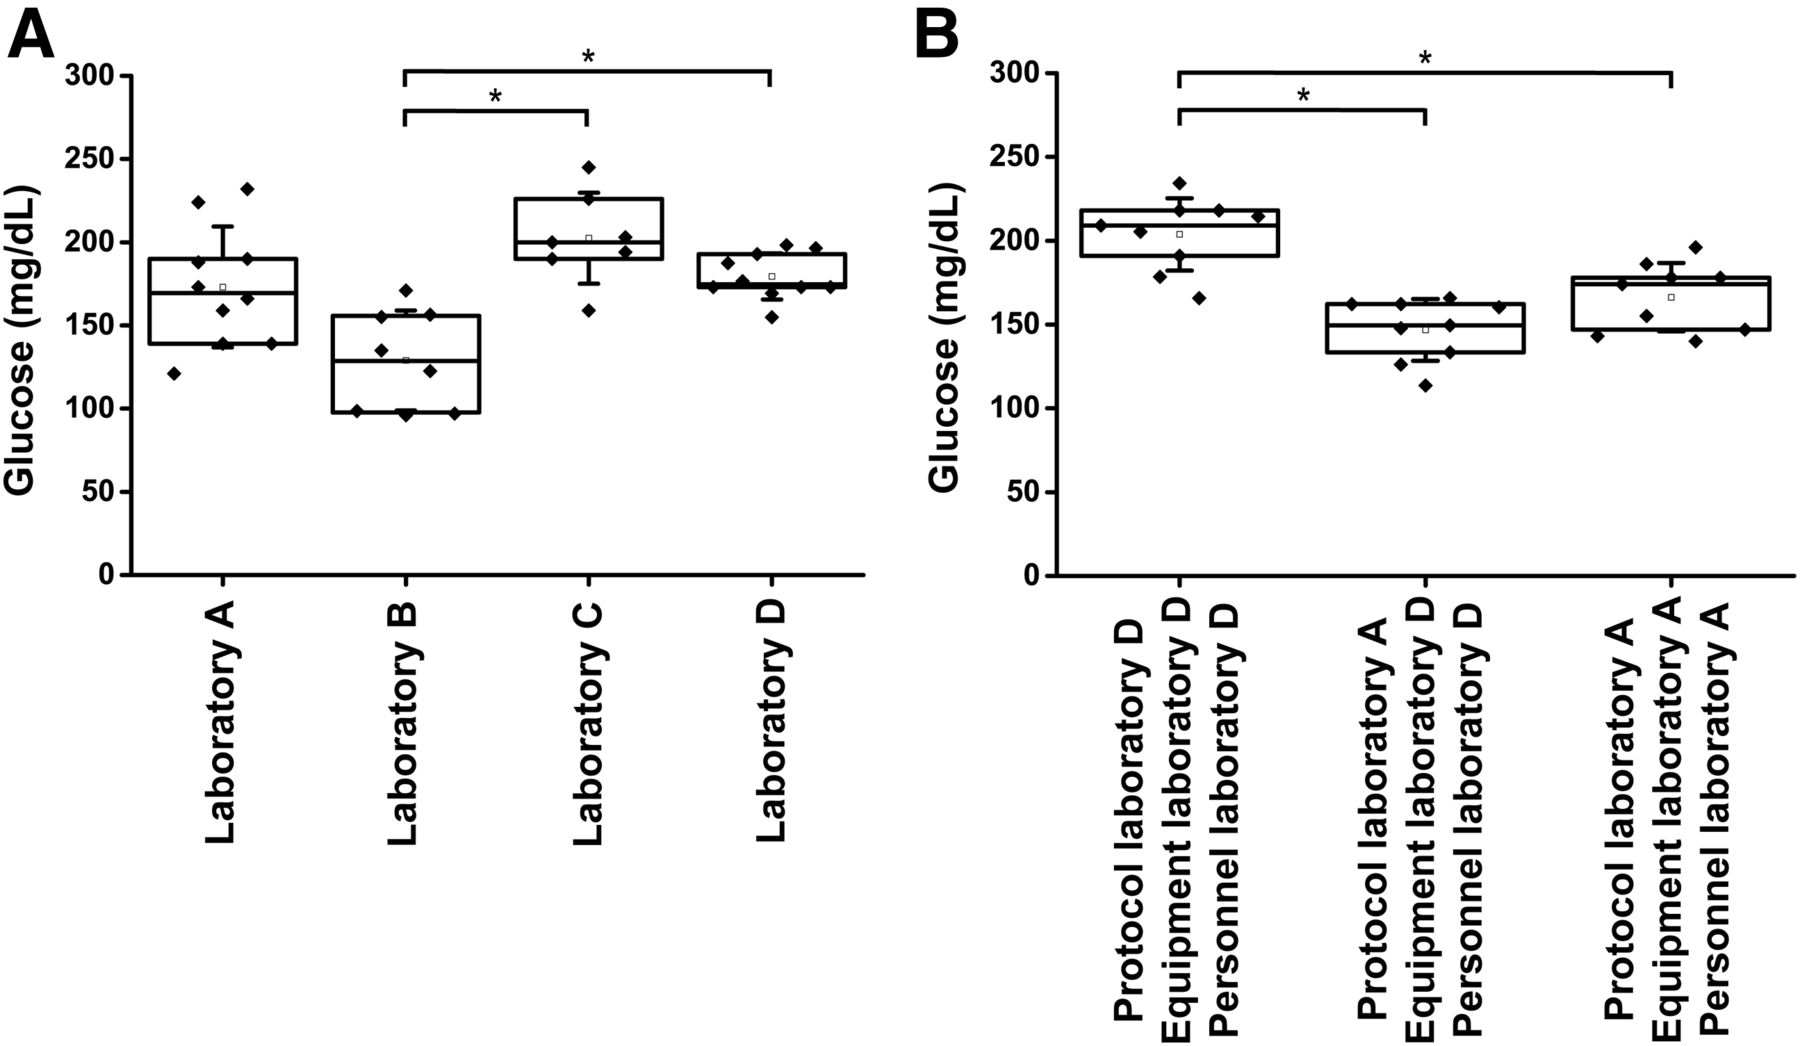
Figure 4A depicts the measured glucose levels before the tracer injection, showing that the highest mean glucose levels were measured in laboratory C, and the lowest glucose levels were measured in laboratory B.

Glucose levels. (A) Laboratory-specific 18F-FDG standard imaging protocols. Blood glucose levels for the animals before 18F-FDG injection (laboratories A, B, and D: n = 10, laboratory C: n = 7) are shown. Glucose parameters were measured with standard glucose device of each laboratory. Tukey–Kramer test was used to determine statistical significance. (B) Influence of animal handling and personnel on data comparability. Blood glucose levels for the animals before 18F-FDG injection are shown for the 3 setups (protocol and personnel laboratory D, protocol laboratory A and personnel laboratory D, protocol and personnel laboratory A). The 1-sample t test was used to determine significant differences. Box plots show group means, 25% and 75% confidence intervals, 1 upper and lower SD of the mean and all individual data points. Test results that were statistically significant (with α = 5%) after Bonferroni–Holm correction (applied separately for each test) are marked with asterisk.
Experiment 2: Influence of Animal Handling and Personnel on Data Comparability
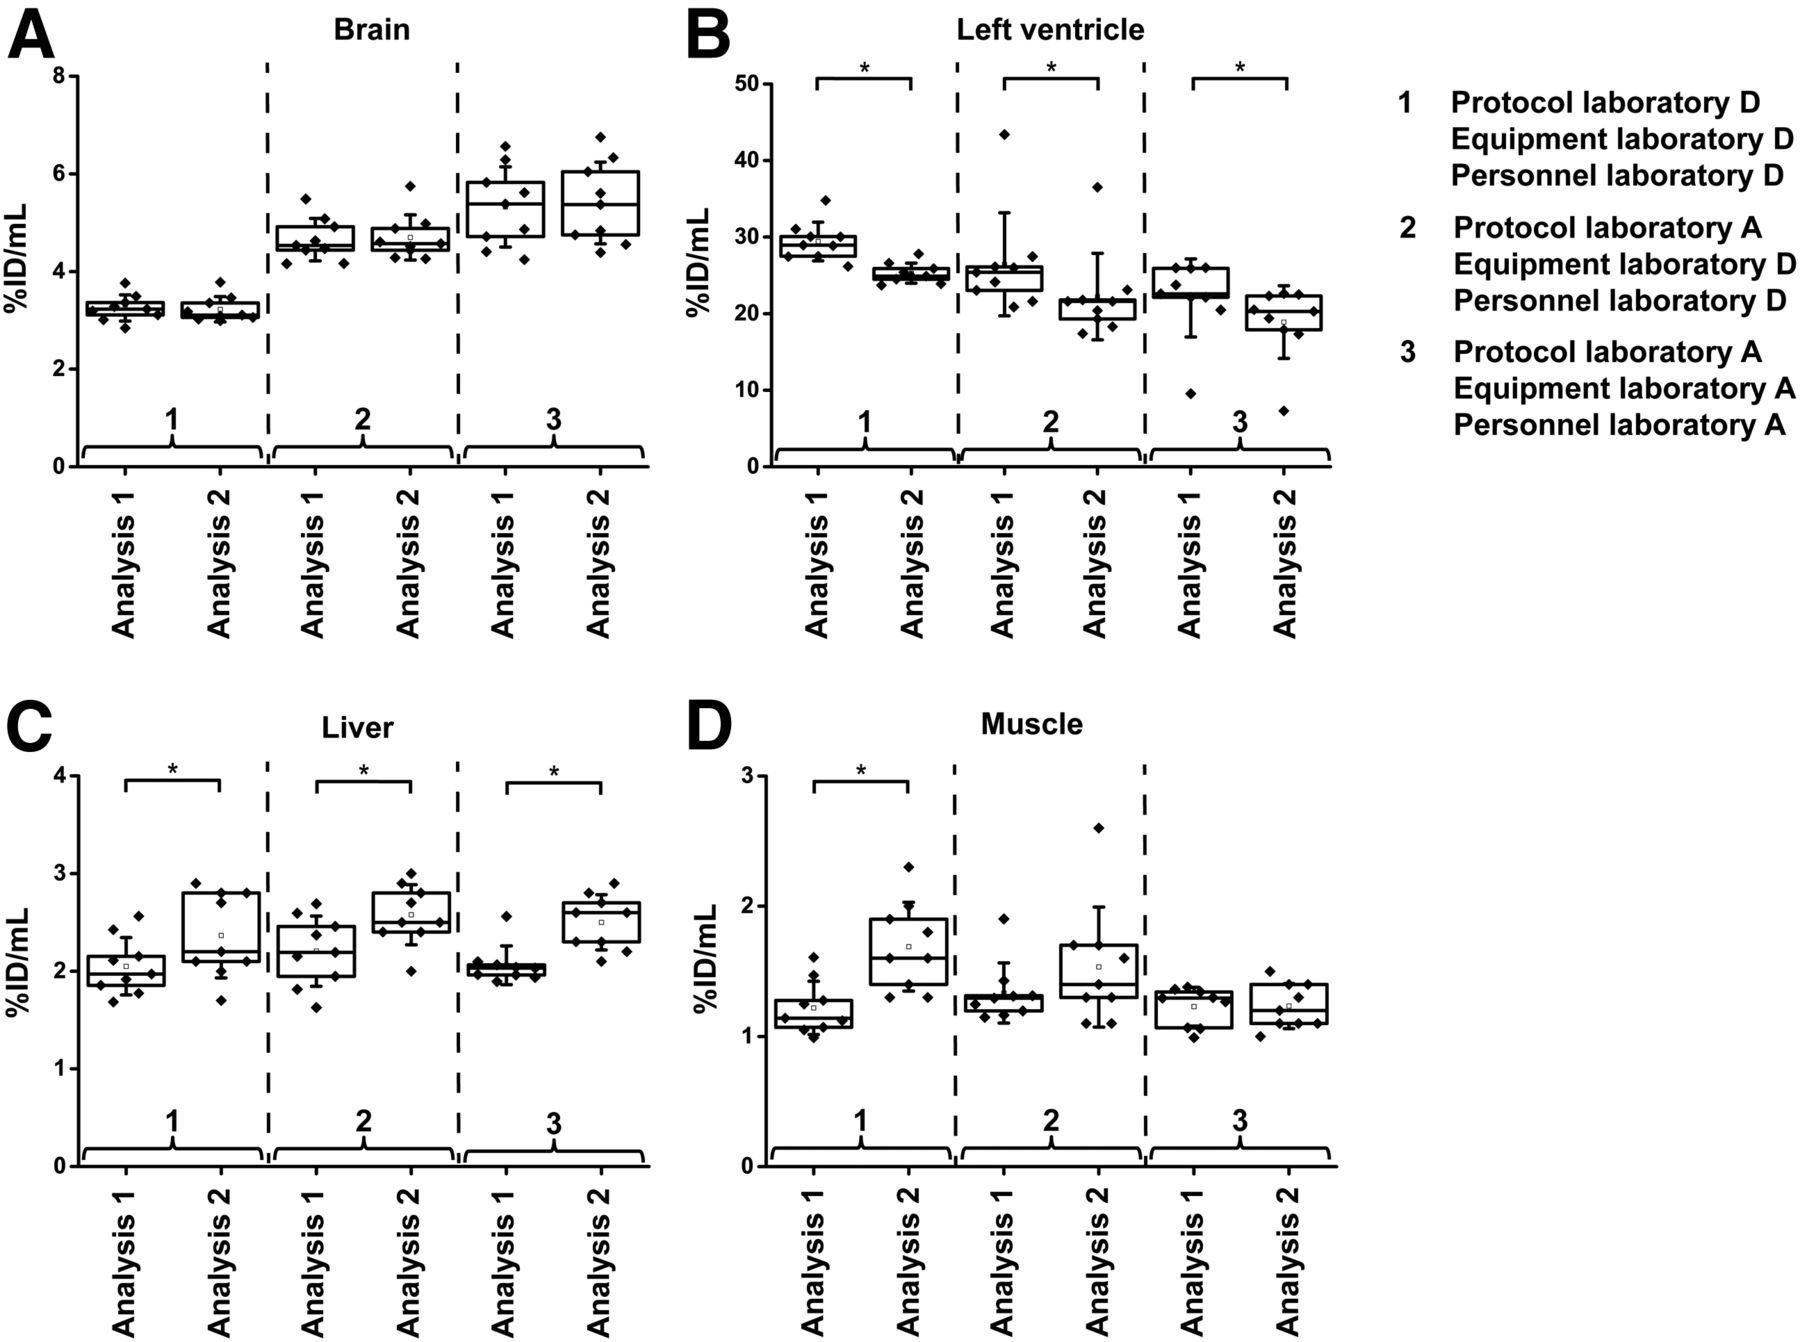
Figure 5 shows the 18F-FDG uptake represented as %ID/mL in the brain (A), left ventricle (B), liver (C), and muscle (D) for experiment 2. Figure 3B depicts representative images of the in vivo biodistribution. The data were reconstructed using OSEM2D, and no attenuation correction was applied. Supplemental Figure 3 depicts the results for this experiment with attenuation correction.

Experiment 2: Influence of animal handling and personnel on data comparability. Quantitative analysis (%injected dose/mL [%ID/mL]) of 18F-FDG uptake is depicted for the brain (A), left ventricle (B), liver (C), and muscle (D) for the 3 studies (n = 9) in laboratory D and compared with data from laboratory A from experiment 1 (n = 10). Data were reconstructed using OSEM2D without attenuation correction. Box plots show group means, 25% and 75% confidence intervals, 1 upper and lower SD of the mean, and all individual data points. Test results that were statistically significant (with α = 5%) after Bonferroni–Holm correction (applied separately for each organ) using the 1-sample t test (comparison of data acquired in laboratory D) and the 2-sample t test (comparison of data acquired in laboratory D to data acquired in laboratory A) are marked with asterisk. Lab = laboratory.
Significant differences in the %ID/mL brain uptake of the data acquired in laboratory D by the personnel from laboratories A and D using the same imaging protocol were revealed. Furthermore, significant differences in the uptake were found for the liver when the personnel of laboratory A performed the experiments (using their own imaging protocol and equipment) in laboratory A and laboratory D.
Significant differences between the results obtained by the personnel of laboratory D executing imaging protocol 1 and 2 were detected for the brain.
Figure 4B depicts the corresponding glucose levels for the animals scanned in laboratory D using the 3 different setups, and Supplemental Figure 4 illustrates the glucose levels for each animal individually. The nonfasted animals for the imaging protocol of laboratory D demonstrated the highest mean glucose levels, whereas the glucose levels for imaging protocol 1 (fasted animals) on both acquisition days were in a comparable range.
Furthermore, a comparison of the data acquired in laboratory D for experiments 1 and 2 was conducted and is depicted in Supplemental Figure 5 (brain [A], left ventricle [B], liver [C], and muscle [D]). Supplemental Figure 6 depicts the results for this comparison with attenuation correction. Significant differences for the 2 experiments were observed for the %ID/mL uptake in the muscle.
Experiment 3: Influence of Image Analysis on Data Reproducibility
Figure 6 illustrates the investigation of a potential influence of the image analysis on the data reproducibility (brain [A], left ventricle [B], liver [C], and muscle [D]), and Supplemental Figure 7 depicts the %ID/mL uptake for each organ (brain [A], left ventricle [B], liver [C], and muscle [D]) and animal individually.
Experiment 3: Reproducibility of PET image analysis. Comparison of quantitative analysis (%injected dose/mL [%ID/mL]) of 18F-FDG uptake in brain (A), left ventricle (B), liver (C), and muscle (D) are depicted. Same datasets (n = 9) were analyzed individually by trained investigators from laboratory A (analysis 1) and from laboratory D (analysis 2). Data were reconstructed using OSEM2D without attenuation correction. Box plots show group means, 25% and 75% confidence intervals, 1 upper and lower SD of the mean, and all individual data points. Test results that were statistically significant using the 1-sample t test (with α = 5%) are marked with asterisk.
The uptake value in the brain was not influenced by the image analysis. However, for both the left ventricle and the liver, significant differences between the 2 analysis methods were detected for all 3 setups. Interestingly, for the protocol and personnel of laboratory D, significant changes due to the image analysis were observed for the muscle.
DISCUSSION
The comparability, reliability, and reproducibility of preclinical imaging data are of profound importance to ensure the scientific integrity of the acquired data, to enhance their validity, and to foster the role of preclinical imaging in basic and translational research. Despite many efforts to standardize procedures within imaging laboratories, only minor steps have been taken to assess the standardization progress and to enhance it. This effort is particularly important with regard to planned and retrospective multicenter studies, which have thus not been executed in preclinical imaging. This study aimed to determine potential differences between laboratory-specific standard PET imaging protocols, as well as a potential impact of animal handling, experimental equipment, and personnel performing the scans on the reproducibility and comparability of the acquired data.
We acquired PET scans in 4 different institutes. To ensure the proper performance of each scanner, the NEMA NU 4-2008 image quality phantom was measured according to the NEMA guidelines (29). All 4 scanners revealed comparable performance values in regard to the RCs, SORs in water and air, and %SD (Fig. 1). Most of these values were also comparable to values reported in the literature (30,31). SORs in air were higher in our study than those in the literature because we did not perform attenuation correction to diminish potential influences on the data due to different attenuation correction methods for the various scanners (CT vs. 57Co source), which has been previously demonstrated to have a tremendous effect on the quantification (32).
The uptake of 18F-FDG in 5 different organs was determined using the standard imaging protocol of each laboratory (experiment 1). Distinct differences in the uptake behavior of all 4 protocols were observed due to, for example, different animal handling procedures before the scans and different animal facilities microenvironments (Fig. 2 and Supplemental Table 2).
All laboratories used different fasting protocols. Because the animals in laboratory C fasted individually for 6 h, whereas animals in laboratory A fasted for 10 h, the same trend of uptake values for both laboratories was expected in the respective organs, although this was not the case in our study. In fact, significant uptake differences in the brain, left ventricle, and liver were detected. The differences between both imaging protocols despite the duration of the fasting (6 vs. 10 h) is that laboratory A removed the food for all animals 10 h before the first injection and laboratory C removed the food individually for each animal with respect to the injection time. This procedure does imply transferring the animals in new cages and keeping them alone or with a second animal in 1 cage, potentially inducing stress to the animals, which should be considered as well. Influences from the fasting protocols can be prevented by not having the animals fast, although, in regard to tumor imaging, fasting and warming of the animal during uptake phase is considered advantageous to reduce brown adipose tissue and skeletal muscle uptake (16).
Furthermore, comparisons of the left ventricle uptake values of laboratory C with literature values and laboratories A, B, and D showed a relatively high uptake in healthy animals in laboratory C, potentially due to a spill-over from one animal to another, since the animals were placed side-by-side in the scanner. However, this outcome needs to be further evaluated.
According to the literature (16–19,33), the lowest measured glucose values in experiment 1 were expected for laboratory A (10-h fasting), followed by laboratory C (6-h fasting), laboratory B (2-h fasting), and laboratory D (no fasting). Our findings did not match this prediction (Fig. 4A); the highest mean glucose level was determined in laboratory C (6-h fasting), whereas laboratory B (2 h) revealed the lowest mean glucose level, which was significantly different from laboratory C and laboratory D. The reason for these findings could be due to a different determination of the glucose values in the 4 laboratories, that is, different devices were used, the anesthesia time of the animals varied, and the location of the blood sampling was different between the laboratories (Supplemental Table 2).
Our findings explicitly show that the comparison among multiple institutes is hampered by the lack of standardization of imaging protocols, animal handling, and experimental equipment (e.g., temperature feedback for regulation of the animals’ temperature). Furthermore, since 2 different scanner systems were used, the quantification accuracy of the in vivo results might be influenced by differences in scanner geometries (e.g., amount of scattered photons due to larger FOV of 1 scanner), although the phantom experiments did show comparable scanner performances.
In experiment 2, the impact of the personnel performing the scans and the imaging protocol, as well as the respective experimental equipment of the laboratories, on the comparability of the acquired data was determined. The used 2 imaging protocols differed in terms of fasting (laboratory A: 10-h fasting, laboratory D: no fasting); hence, differences in uptake patterns were detected (Fig. 5, comparison of imaging protocol 1 to imaging protocol 4 in laboratory D), especially in the brain. However, the comparison of data that were acquired using the same imaging protocol in laboratory D but executed by different personnel and with different experimental equipment also revealed significant differences in the brain uptake, demonstrating that the personnel performing and the experimental equipment can have an influence on the reproducibility and comparability of the data (Fig. 5A).
For all other organs, no significant changes in the mean uptake of the groups scanned with the imaging protocol of laboratory A by the personnel of laboratories A and D were detected, indicating that the brain uptake is much more sensitive in terms of handling compared with the other investigated organs.
Furthermore, when comparing the data of laboratory D from experiment 1 with the data from experiment 2 (time interval of 1.5 y), the muscle uptake revealed significant differences between both experiments (Supplemental Figs. 5D and 6D), which was not detected for the comparison of data from laboratory A (experiment 1 compared with experiment 2, Fig. 5D). This influence is particularly important to point out because the muscle is often used as reference tissue to calculate organ-to-muscle ratios, and the uptake should be stable when using the same imaging protocol and personnel performing the scans.
In the third experiment, the impact of the image analysis of the acquired data from experiment 2 on the data comparability was investigated by having the data independently analyzed by 2 trained persons (Figs. 6A–6D). In terms of the left ventricle, both investigators used fixed but different thresholds relative to the VOI maximum to determine the uptake. The analysis of investigator 1 revealed higher mean uptake values for all 3 investigated protocols compared with the analysis of investigator 2, indicating that the threshold is not a stable tool for image analysis. Furthermore, the liver revealed diametrically opposite results. For this organ, the investigator of analysis 2 used individually drawn VOIs for each animal, resulting in varying VOIs, whereas the investigator of analysis 1 drew the VOI based on the first dataset and used the same VOI for all images. Both methods used manual positioning of the VOIs. In particular in the liver, large blood vessels can influence the VOI values by signal spill-in.
The brain was the only organ in which comparable results were obtained by the 2 investigators for all 3 setups. In this case, the uptake was determined by coregistration of the PET image to an MR image atlas, by drawing the VOI based on the MR image and transferring it to the PET data. This method proved to be a stable image analysis method, and the registration to anatomic data from CT or MR images did provide comparable results.
Our study demonstrated that the reproducibility of preclinical imaging data within an institution needs to be investigated on a regular basis, both in phantoms and in vivo, to ensure stable scanner performance, as well as standardized implementation of experiments and that there is a demand for standardization among multiple institutions.
CONCLUSION
This study investigated the comparability among preclinical imaging facilities in regard to PET data acquisition and analysis. Distinct differences in the investigated parameters were detected due to, for example, the different standard imaging protocols of each laboratory (fasting vs. nonfasting, glucose level determination, temperature regulation vs. constant temperature warming, etc.) and different animal facilities microenvironments. Furthermore, a potential influence of the personnel performing and analyzing the data, as well as of the experimental equipment used, was observed. It has been demonstrated that standardization can be well established within a single institution. However, there is a demand for standardization among multiple institutions, and it is important to raise awareness that comparing data from different institutes might not be feasible depending on the protocol used; therefore, accurate reporting in scientific journals is of primary importance (24,34).
DISCLOSURE
This work was supported by the Werner Siemens Foundation. No other potential conflict of interest relevant to this article was reported.
KEY POINTS
QUESTION: Is preclinical PET imaging data comparable and reproducible among preclinical imaging facilities?
PERTINENT FINDINGS: Distinct differences in the investigated parameters were detected due to, for example, the different standard imaging protocols of each laboratory (fasting vs. nonfasting, glucose level determination, temperature regulation vs. constant temperature warming, etc.) and different animal facilities' microenvironments. Furthermore, a potential influence of the personnel performing and analyzing the data, as well as of the experimental equipment used, was observed.
IMPLICATIONS FOR PATIENT CARE: Preclinical standardization is a key factor in certain imaging procedures (e.g., longitudinal studies or therapy monitoring), and there is a demand for standardization among multiple institutions to enhance translatability from bench to bedside.
Footnotes
Published online Mar. 8, 2019.
- © 2019 by the Society of Nuclear Medicine and Molecular Imaging.
REFERENCES
- Received for publication October 25, 2018.
- Accepted for publication February 25, 2019.


Jump to section
Related Articles
Cited By...
- No citing articles found.