


Article Figures & Data
Figures
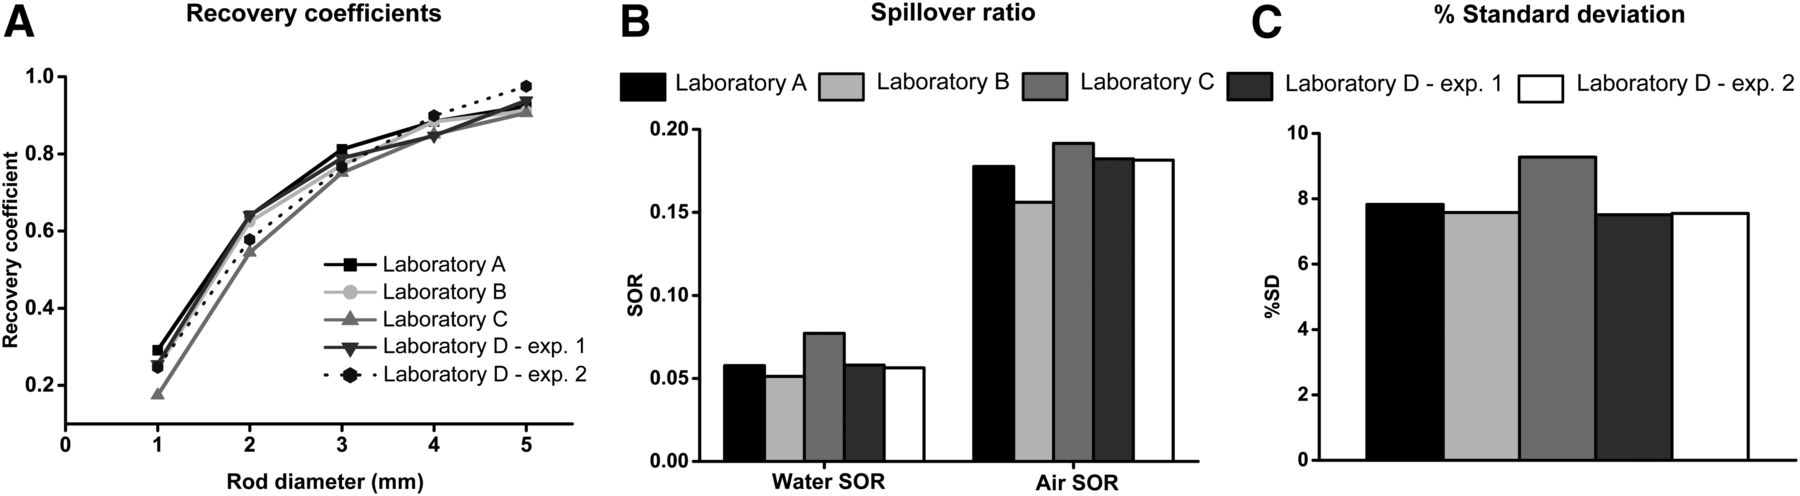
- FIGURE 1.
Image quality phantom data. RCs for different rod sizes (A), SOR for water and air (B), and %SD as a measure of noise (C) for all 4 scanners are depicted. Data were reconstructed using OSEM2D without attenuation correction. Exp = experiment.
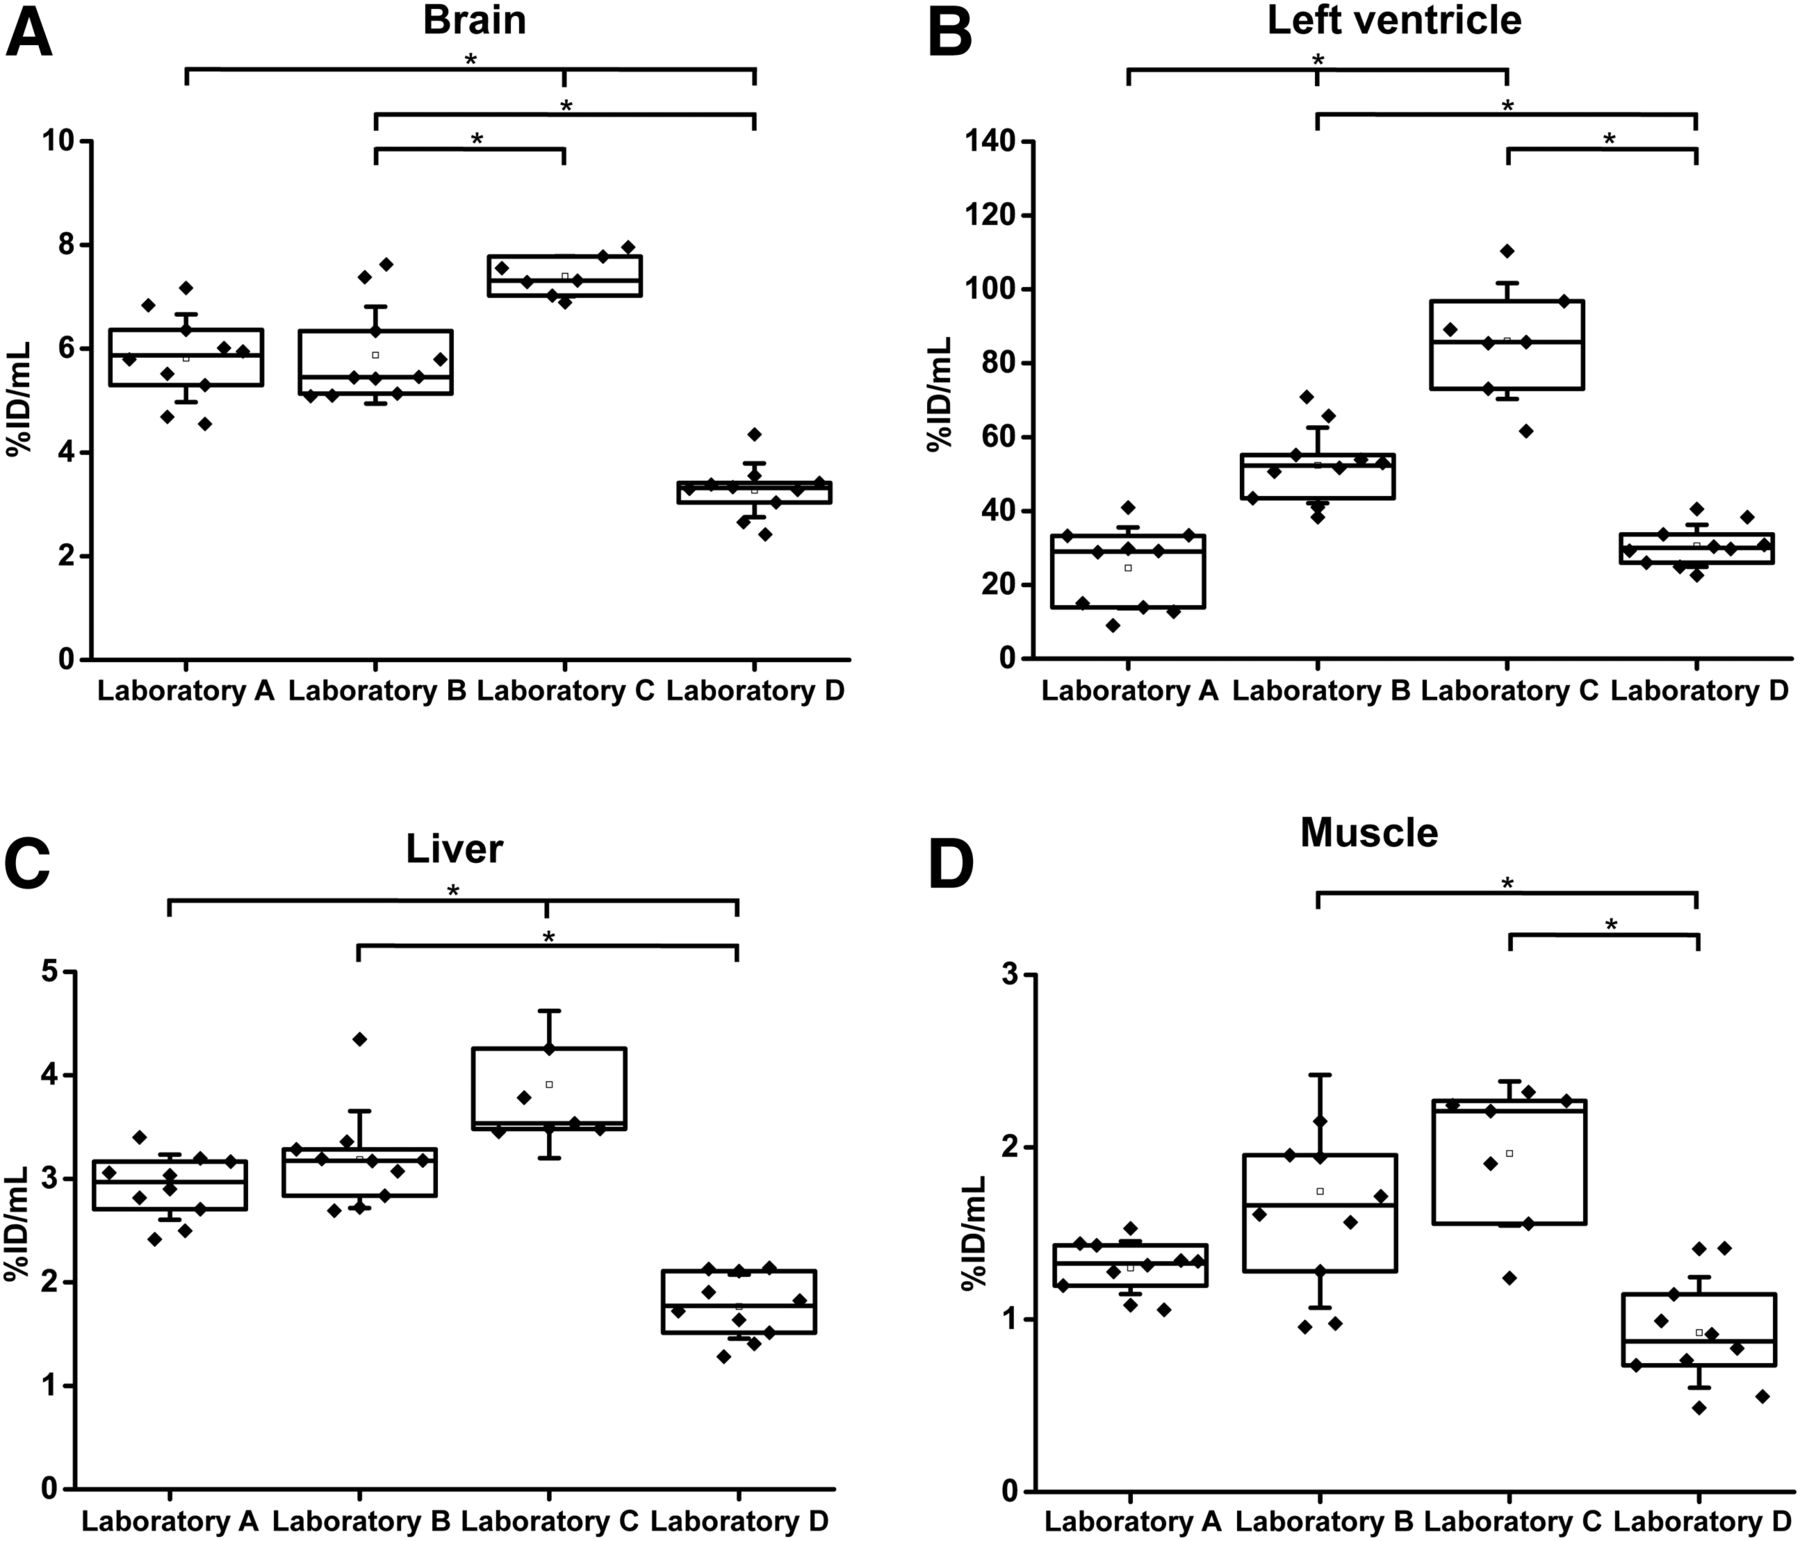
- FIGURE 2.
Experiment 1: laboratory-specific 18F-FDG standard imaging protocols. Quantitative analysis (%injected dose/mL [%ID/mL]) of 18F-FDG uptake is depicted for the brain (A), left ventricle (B), liver (C), and muscle (D) for the 4 laboratories (laboratories A, B, and D: n = 10, laboratory C: n = 7). Data were reconstructed using OSEM2D without attenuation correction. Box plots show group means, 25% and 75% confidence intervals, 1 upper and lower SD of the mean, and all individual data points. Test results that were statistically significant using the Tukey–Kramer test (with α = 5%) after Bonferroni–Holm correction (applied separately for each organ) are marked with asterisk.
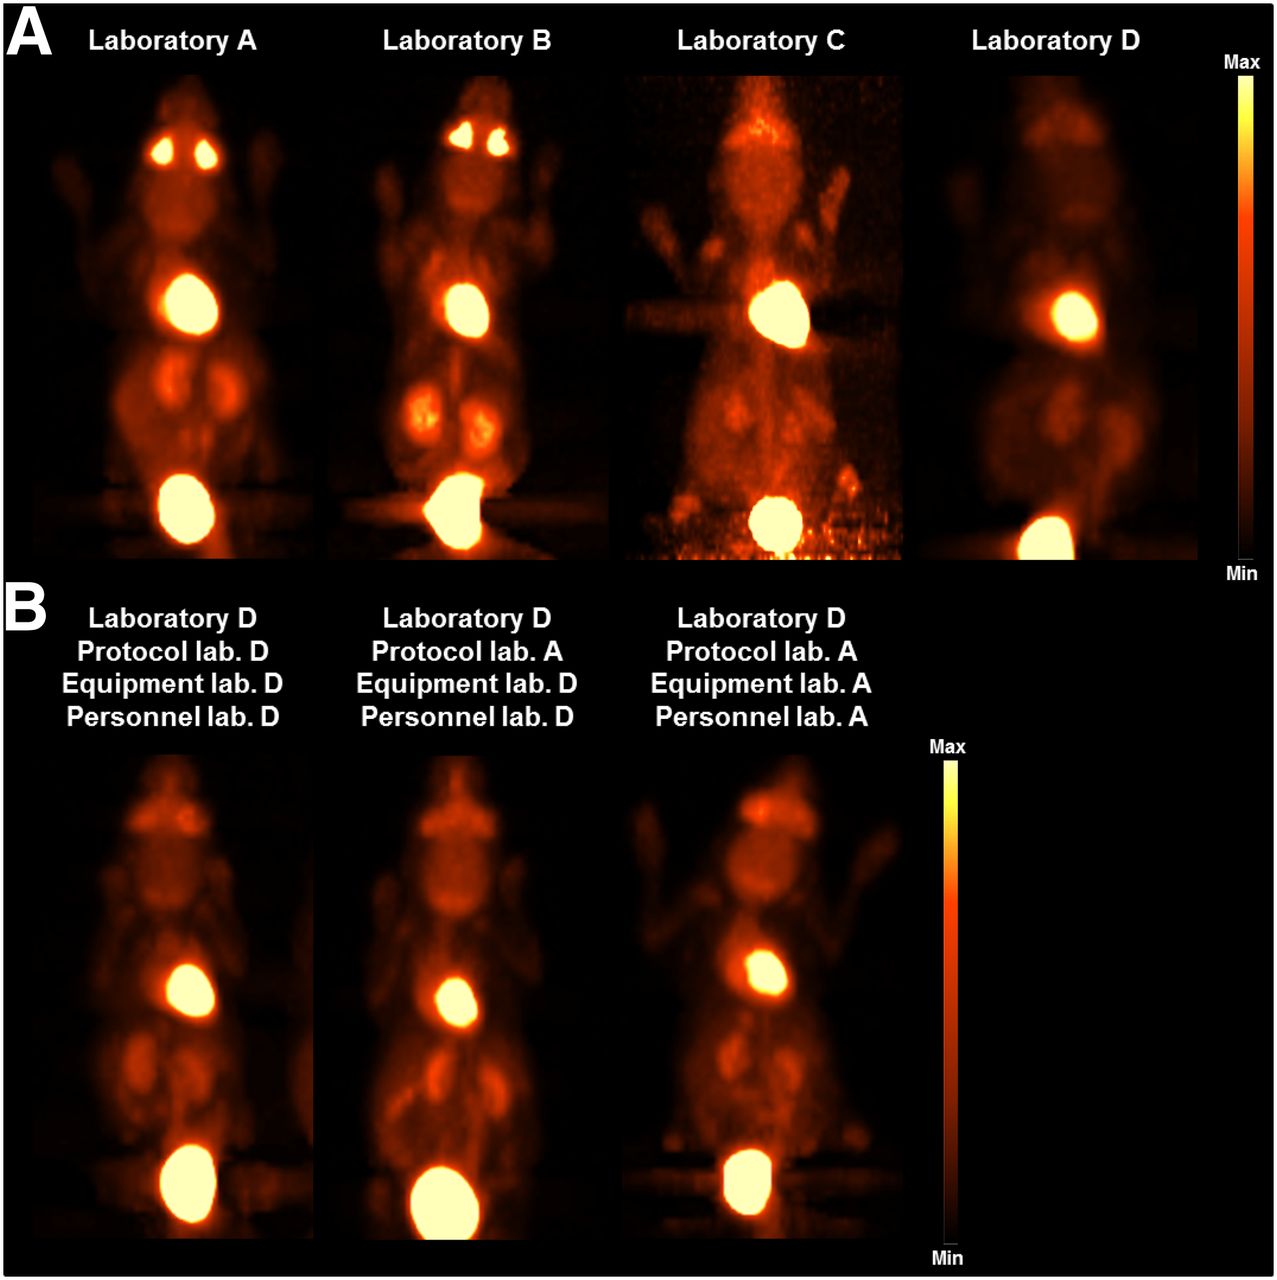
- FIGURE 3.
Representative images of 18F-FDG biodistribution. (A) Experiment 1: laboratory-specific 18F-FDG standard imaging protocols. (B) Experiment 2: influence of animal handling and personnel on the data comparability. Lab = laboratory.
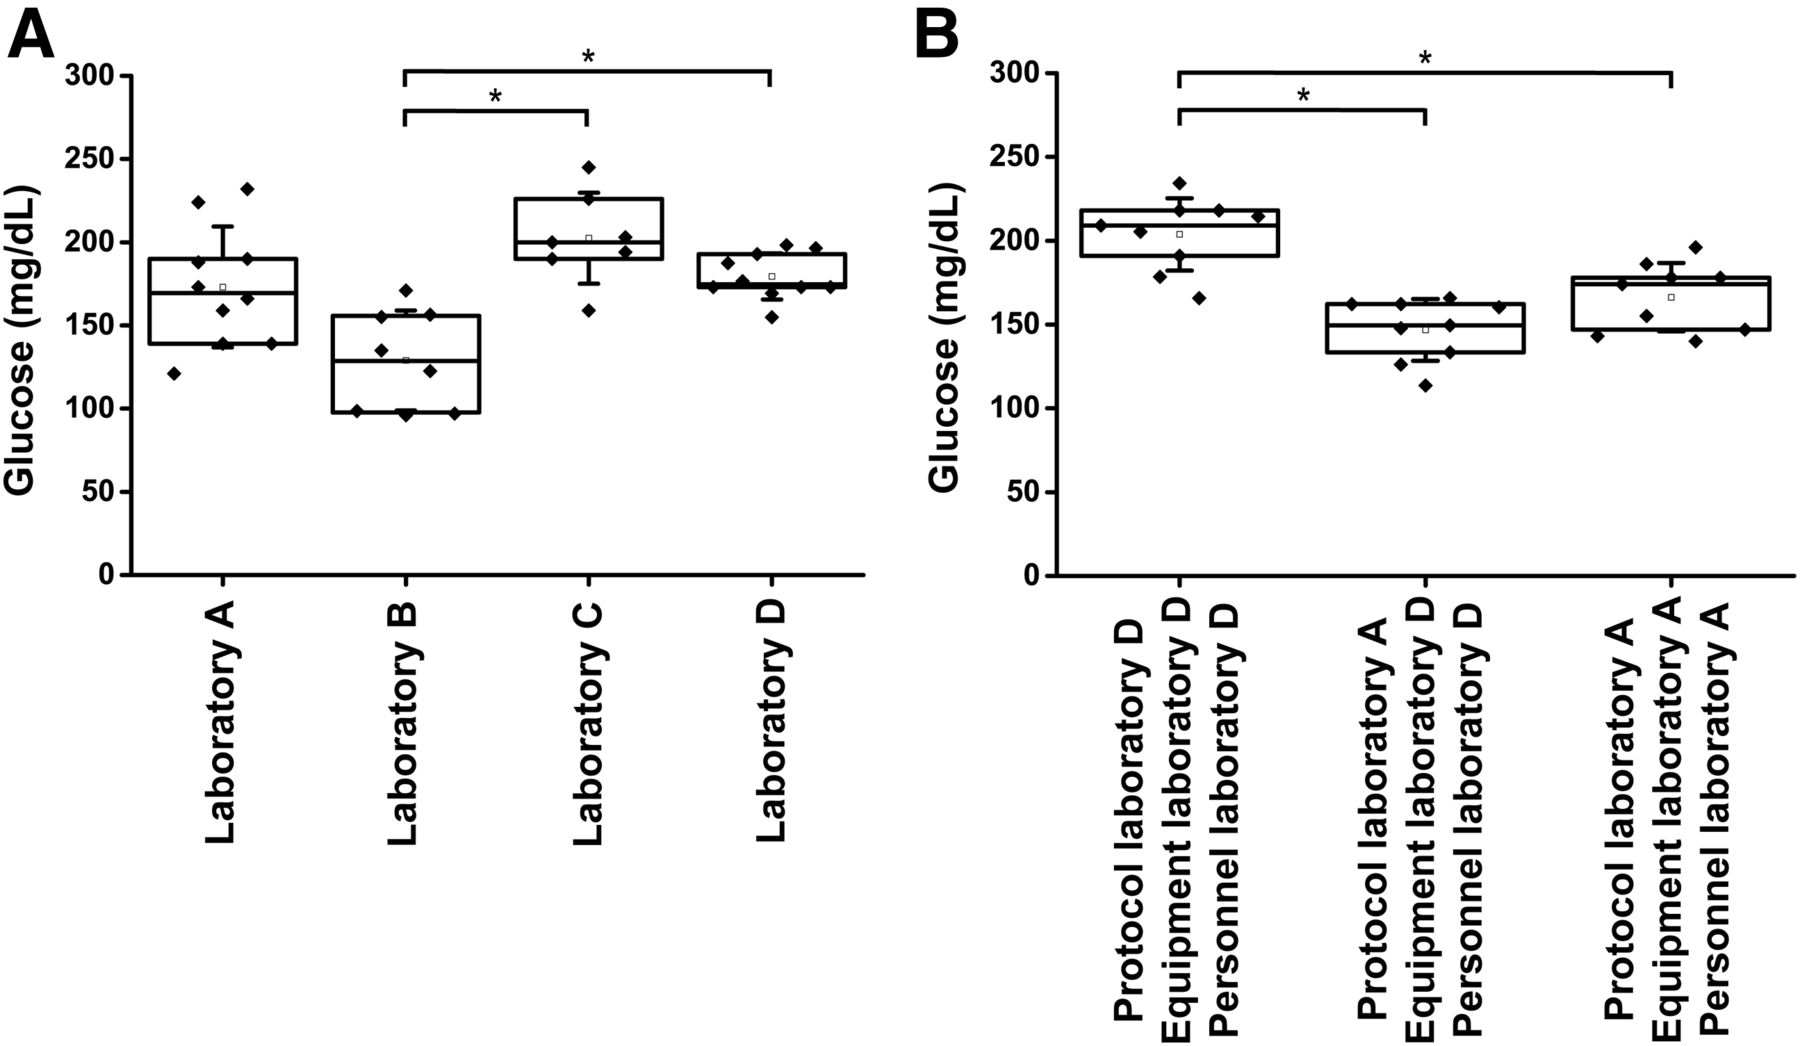
- FIGURE 4.
Glucose levels. (A) Laboratory-specific 18F-FDG standard imaging protocols. Blood glucose levels for the animals before 18F-FDG injection (laboratories A, B, and D: n = 10, laboratory C: n = 7) are shown. Glucose parameters were measured with standard glucose device of each laboratory. Tukey–Kramer test was used to determine statistical significance. (B) Influence of animal handling and personnel on data comparability. Blood glucose levels for the animals before 18F-FDG injection are shown for the 3 setups (protocol and personnel laboratory D, protocol laboratory A and personnel laboratory D, protocol and personnel laboratory A). The 1-sample t test was used to determine significant differences. Box plots show group means, 25% and 75% confidence intervals, 1 upper and lower SD of the mean and all individual data points. Test results that were statistically significant (with α = 5%) after Bonferroni–Holm correction (applied separately for each test) are marked with asterisk.
- FIGURE 5.
Experiment 2: Influence of animal handling and personnel on data comparability. Quantitative analysis (%injected dose/mL [%ID/mL]) of 18F-FDG uptake is depicted for the brain (A), left ventricle (B), liver (C), and muscle (D) for the 3 studies (n = 9) in laboratory D and compared with data from laboratory A from experiment 1 (n = 10). Data were reconstructed using OSEM2D without attenuation correction. Box plots show group means, 25% and 75% confidence intervals, 1 upper and lower SD of the mean, and all individual data points. Test results that were statistically significant (with α = 5%) after Bonferroni–Holm correction (applied separately for each organ) using the 1-sample t test (comparison of data acquired in laboratory D) and the 2-sample t test (comparison of data acquired in laboratory D to data acquired in laboratory A) are marked with asterisk. Lab = laboratory.
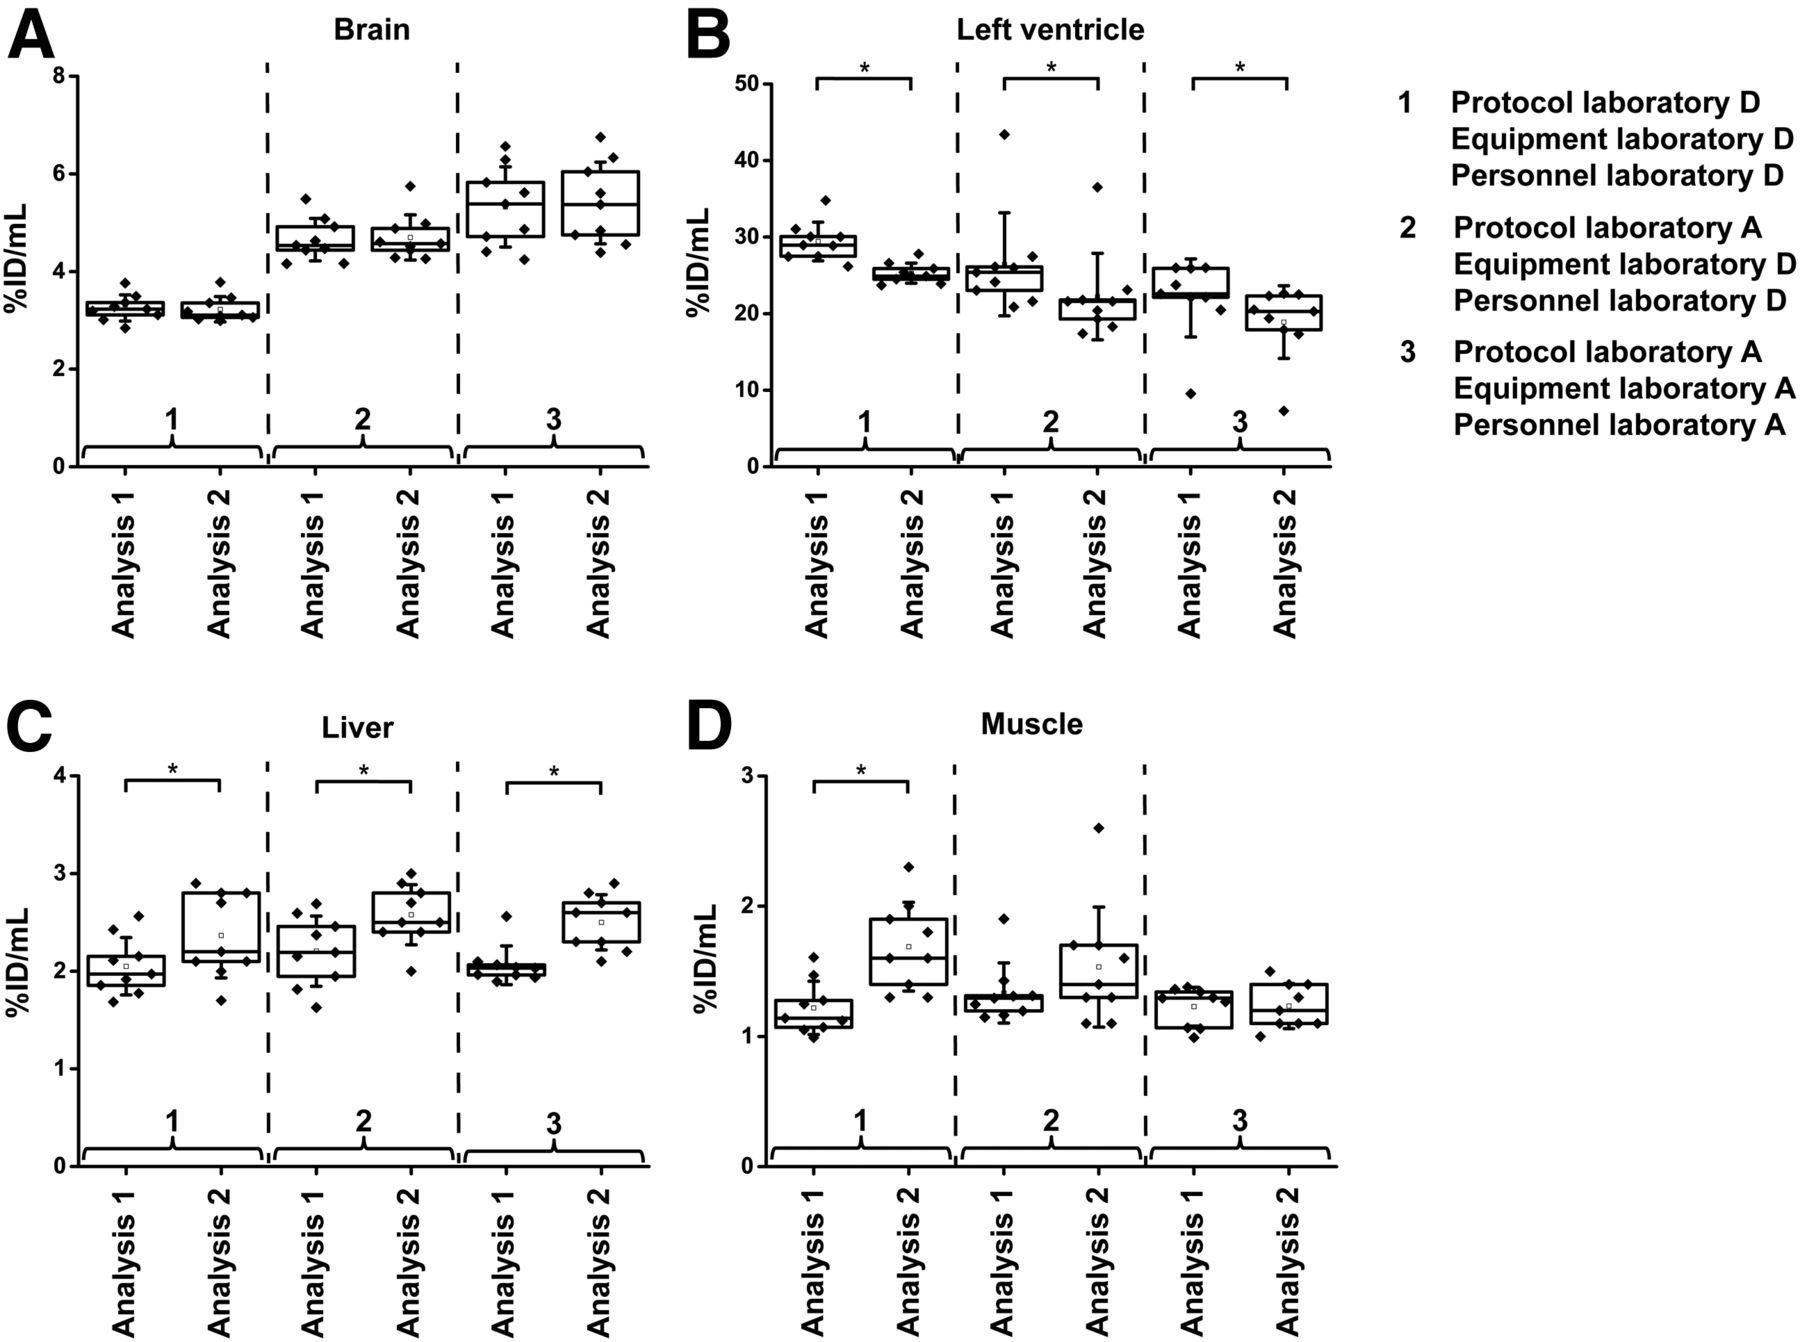
- FIGURE 6.
Experiment 3: Reproducibility of PET image analysis. Comparison of quantitative analysis (%injected dose/mL [%ID/mL]) of 18F-FDG uptake in brain (A), left ventricle (B), liver (C), and muscle (D) are depicted. Same datasets (n = 9) were analyzed individually by trained investigators from laboratory A (analysis 1) and from laboratory D (analysis 2). Data were reconstructed using OSEM2D without attenuation correction. Box plots show group means, 25% and 75% confidence intervals, 1 upper and lower SD of the mean, and all individual data points. Test results that were statistically significant using the 1-sample t test (with α = 5%) are marked with asterisk.


Tables
- TABLE 1
Overview of the Used Scanner Types, Software Versions, Energy and Timing Windows, Attenuation Methods, As Well As of the Used Reconstruction Parameters
Scanner/laboratory Scanner type Software Energy window (keV) Timing window (ns) Reconstruction algorithm Matrix/zoom Reconstructed voxel size (mm3) Attenuation method, acquisition time, acquired counts A Inveon dedicated PET Inveon Acquisition Workplace 1.5.0.28 350–650 3.432 OSEM2D (4 iterations, 16 subsets) 128 × 128 × 159 zoom 1 0.776 × 0.776 × 0.796 57Co source (63.9 MBq), 803 s B Inveon MultiModality PET/CT Inveon Acquisition Workplace 1.5.0.28 350–650 3.432 OSEM2D (4 iterations, 16 subsets) 128 × 128 × 159 zoom 1 0.776 × 0.776 × 0.796 CT, 80 keV, 500 µA, 120 projection steps over 220° rotation, 200 ms exposure time and binning 4, 300 s C Focus 220 microPET Manager 2.5.0.0 250–750 6 OSEM2D (4 iterations, 16 subsets) 128 × 128 × 95 zoom 4.745 0.400 × 0.400 × 0.796 57Co source (50.3 MBq), 604 s D Inveon dedicated PET Inveon Acquisition Workplace 2.0 350–650 3.4375 OSEM2D (4 iterations, 16 subsets) 128 × 128 × 159 zoom 1 0.776 × 0.776 × 0.796 57Co source, 935 s (experiment 1, 60.2 MBq), 827 s and 6,588 s (experiment 2, 16.0 MBq)
Supplemental Data
Files in this Data Supplement:


Jump to section
Related Articles
Cited By...
- No citing articles found.