


Abstract
Quantitative PET/MRI is dependent on reliable and reproducible MR-based attenuation correction (MR-AC). In this study, we evaluated the quality of current vendor-provided thoracic MR-AC maps and further investigated the reproducibility of their impact on 18F-FDG PET quantification in patients with non–small cell lung cancer. Methods: Eleven patients with inoperable non–small cell lung cancer underwent 2–5 thoracic PET/MRI scan–rescan examinations within 22 d. 18F-FDG PET data were acquired along with 2 Dixon MR-AC maps for each examination. Two PET images (PETA and PETB) were reconstructed using identical PET emission data but with MR-AC from these intrasubject repeated attenuation maps. In total, 90 MR-AC maps were evaluated visually for quality and the occurrence of categorized artifacts by 2 PET/MRI-experienced physicians. Each tumor was outlined by a volume of interest (40% isocontour of maximum) on PETA, which was then projected onto the corresponding PETB. SUVmean and SUVmax were assessed from the PET images. Within-examination coefficients of variation and Bland–Altman analyses were conducted for the assessment of SUV variations between PETA and PETB. Results: Image artifacts were observed in 86% of the MR-AC maps, and 30% of the MR-AC maps were subjectively expected to affect the tumor SUV. SUVmean and SUVmax resulted in coefficients of variation of 5.6% and 6.6%, respectively, and scan–rescan SUV variations were within ±20% in 95% of the cases. Substantial SUV variations were seen mainly for scan–rescan examinations affected by respiratory motion. Conclusion: Artifacts occur frequently in standard thoracic MR-AC maps, affecting the reproducibility of PET/MRI. These, in combination with other well-known sources of error associated with PET/MRI examinations, lead to inconsistent SUV measurements in serial studies, which may affect the reliability of therapy response assessment. A thorough visual inspection of the thoracic MR-AC map and Dixon images from which it is derived remains crucial for the detection of MR-AC artifacts that may influence the reliability of SUV.
PET imaging with various tracers, including 18F-FDG, is increasingly used for evaluation of biologic response to cancer treatment (1). Reliable and repeatable quantitative PET images are therefore important for follow-up examinations. The reproducibility of SUV in PET-only and combined PET/CT examinations has been well studied (2–11). A single study by Rasmussen et al. also analyzed the reproducibility of 18F-FDG PET/MRI scans (12). Reproducibility of PET imaging is affected by many sources of variation arising from emission and attenuation data. However, none of the mentioned studies have tried to isolate and quantify the effect of the different sources of variation, which include errors of the images used for attenuation correction of PET. Attenuation correction is an essential prerequisite for quantification of PET images, and the reproducibility of attenuation maps is therefore expected to be strongly linked to the overall PET reproducibility.
Although a PET/CT system uses the CT transmission scan to generate an attenuation map, PET/MRI systems lack such information. For the Siemens Biograph mMR scanner, the current vendor-provided MR-based attenuation correction (MR-AC) maps are derived from a segmentation of Dixon images (13) into 4 classes (soft tissue, fat, lungs, and air), each with a predetermined linear attenuation coefficient value (14). It is well known that this method for MR-AC introduces a systematic and considerable bias, especially because of the lack of bone (15) and the allocation of a single predetermined attenuation coefficient to specific tissues. Nevertheless, because the Dixon-based method is the reality in vendor-provided whole-body clinical routine today, there is interest in investigating the reproducibility of the Dixon-based MR-AC maps. This reproducibility has been questioned because the underlying Dixon MR images are sensitive to artifacts (16–18). Truncation artifacts due to the limited field of view, water/fat inversion artifacts, and patient movements have been shown to affect the measured SUVs of lesions (19–22). Thoracic MR-AC maps are especially challenging to derive because of respiratory motion, which may occur despite clear breathing instructions given to the patient. Paulus et al. exemplified that incorrect lung classification in an MR-AC map resulted in a 53% increase in SUVmean relative to CT-based attenuation correction for a lesion near the lung (23). Furthermore, the fast signal decay induced by air–tissue interfaces may cause small lesions or fine reticulations to be missed (24,25).
In the present study, we evaluated the quality of current vendor-provided thoracic MR-AC maps and investigated how the reproducibility of these maps affects PET quantification in patients with non–small cell lung cancer.
MATERIALS AND METHODS
Patients
This prospective clinical study included 11 patients (4 women and 7 men; mean age ± SD, age 62 ± 6 y; weight, 70 ± 11 kg) with inoperable stage IIIB/IV non–small cell lung cancer but who were in good physical condition, that is, with a performance status of 0 or 1 (26).
The study was approved by the departmental science committees at Rigshospitalet, by the Regional Ethics Committee of Copenhagen (approval H-3-2013-090), and by the Danish Data Protection Agency.
18F-FDG PET/MRI
Each patient underwent 2–5 thoracic PET/MRI scan–rescan examinations within 22 d of the first examination (before and during chemotherapy), resulting in a total of 45 examinations included in this study. All scans were obtained on the same Biograph mMR device (Siemens Healthcare) with Syngo MR software, version B20P, at Rigshospitalet.
The patients were instructed to fast for a minimum of 6 h before undergoing each PET/MRI examination. PET scans were started approximately 60 min after injection of 18F-FDG (2 MBq/kg). Data from 2 bed positions covering the thorax and upper abdomen were acquired to fully cover the lungs. The PET emission data were acquired for 8 min per bed position. Simultaneously, a standard 2-point Dixon MRI sequence was acquired for derivation of the MR-AC map, using a repetition time of 3.60 ms, echo times of 1.23 and 2.46 ms, and a flip angle of 10°. Before this, the patients were instructed to hold their breath at end-expiration to minimize respiration artifacts. The Dixon images (in-phase, opposed-phase, water, and fat) were generated on 192 × 126 × 128 matrices with a voxel size of 2.6 × 2.6 × 3.1 mm for each bed position and then composed into a single image volume for the derivation of the MR-AC map following vendor-specific processing. Without repositioning the patient, a second PET/MRI scan was obtained as described above, resulting in 90 MR-AC maps for visual evaluation (the PET data from this rescan were not used in the subsequent analyses).
The rescan MR-AC map was coregistered to the first MR-AC map by a 6-parameter rigid alignment procedure (minctracc; McConnel Imaging Center), with cross-correlation as the objective function and using nearest-neighbor interpolation. The first MR-AC map was denoted μ-mapA, and the coregistered rescan MR-AC map was denoted μ-mapB.
Using the same raw PET emission data, 2 different PET images, PETA and PETB, were reconstructed offline using E7Tools (Siemens Medical Solutions), with μ-mapA and μ-mapB, respectively, for MR-AC. The reconstructions were performed using 3-dimensional ordinary Poisson ordered-subset expectation maximization with 3 iterations, 21 subsets, and 4-mm gaussian postfiltering on 344 × 344 × 224 matrices with a voxel size of 2.1 × 2.1 × 2.0 mm. Maximum-likelihood reconstruction of attenuation and activity was not applied.
Image Analysis
The general quality of MR-AC maps was assessed visually by PET/MRI-experienced physicians. The impact of MR-AC map reproducibility on PET quantification was analyzed by examining tumor SUV variability between PETA and PETB.
Visual Evaluation of MR-AC Maps
Two PET/MRI-experienced physicians visually evaluated all 90 MR-AC maps for categorized artifacts, first separately and then in consensus. We report only the findings of the consensus artifact assessment. Each MR-AC map was inspected with only standard MRI sequences and PET for anatomic and metabolic references, respectively. The types of artifacts were based on those presented in studies by Keller et al. (19) and Brendle et al. (22), which include metal artifacts, trachea artifacts (the air-filled trachea segmented as soft tissue or fat), lung border artifacts, respiration artifacts, body contour artifacts, and erroneous tissue classification. Truncation artifacts were present in all MR-AC maps and were not included in this analysis.
Each MR-AC map was further subjectively categorized as critical or noncritical on the basis of whether any artifacts were expected to affect a tumor’s SUV. Especially, the size and location of the artifacts relative to the tumor were considered.
Quantitative Evaluation of PET Images
One of the 2 PET/MRI-experienced physicians outlined every tumor of each patient on PETA by a volume of interest (VOI), using the image analysis tool Mirada XD (Mirada Medical). The VOIs were defined as an automatically segmented 40% isocontour of SUVmax. Minor manual adjustments of the VOIs were done, such as excluding adjacent physiologic uptake, if considered appropriate by the physician. The VOIs outlined on PETA were projected onto the corresponding PETB without modification of the contours. Next, SUVmean and SUVmax (body weight–corrected) were assessed. The relative difference between the measured SUVs in PETA versus PETB was calculated as  and
and  , always keeping PETA as the reference.
A 10-cm-diameter sphere was placed in μ-mapA and μ-mapB, with the center located at the center of mass of each tumor. From these local spheres, the volumes of the different tissue compartments were assessed and the absolute differences between these volumes in μ-mapA and in μ-mapB were calculated for lung tissue ( ), fat (
 ), and soft tissue (
 ).
).
Statistical Analysis
Statistical analyses were performed in R (R Development Core Team). First, both SUVmean and SUVmax were transformed by the natural logarithm due to skewed distributions of their paired scan–rescan differences. To assess the components of variation for SUVmean and SUVmax, a random-effects 1-way ANOVA was conducted for the loge-transformed data, with the specific examination as a random effect. From this, we obtained the within-examination variation ( ) and the between-examination variation (
 ). Next, the correlation among observations within the same examination, known as the intraclass correlation (ICC), and the within-examination coefficient of variation (CV) were calculated as follows (27):
 Eq. 1
Eq. 1 Eq. 2
Eq. 2
The scan–rescan SUV agreement was further assessed by the 95% limits of agreement (LOA) from the Bland–Altman analysis for repeated observations (28,29). The analysis was performed on loge-transformed SUVmean and SUVmax, and the lower and upper LOA were back-transformed (by exponential ex) into the original scale to represent ratios and expressed as percentage differences. The back-transformed lower and upper LOA were visualized graphically by Bland–Altman plots of the SUV percentage differences versus the SUV average for both SUVmean and SUVmax.
Finally, linear regression analysis was used to assess the correlation between the difference variables:  ,
, ,
,  ,
,  , and
, and  .
.
RESULTS
In total, 19 separate tumors were found in the 11 patients, resulting in 80 tumors for reproducibility analysis.
Image artifacts were observed in 86% (77/90) of the MR-AC maps. The trachea artifact was most frequent and seen in 79% of the MR-AC maps, followed by erroneous tissue classification (34%), body contour artifacts (19%), metal artifacts (13%), respiration artifacts (11%), and lung border artifacts (10%).
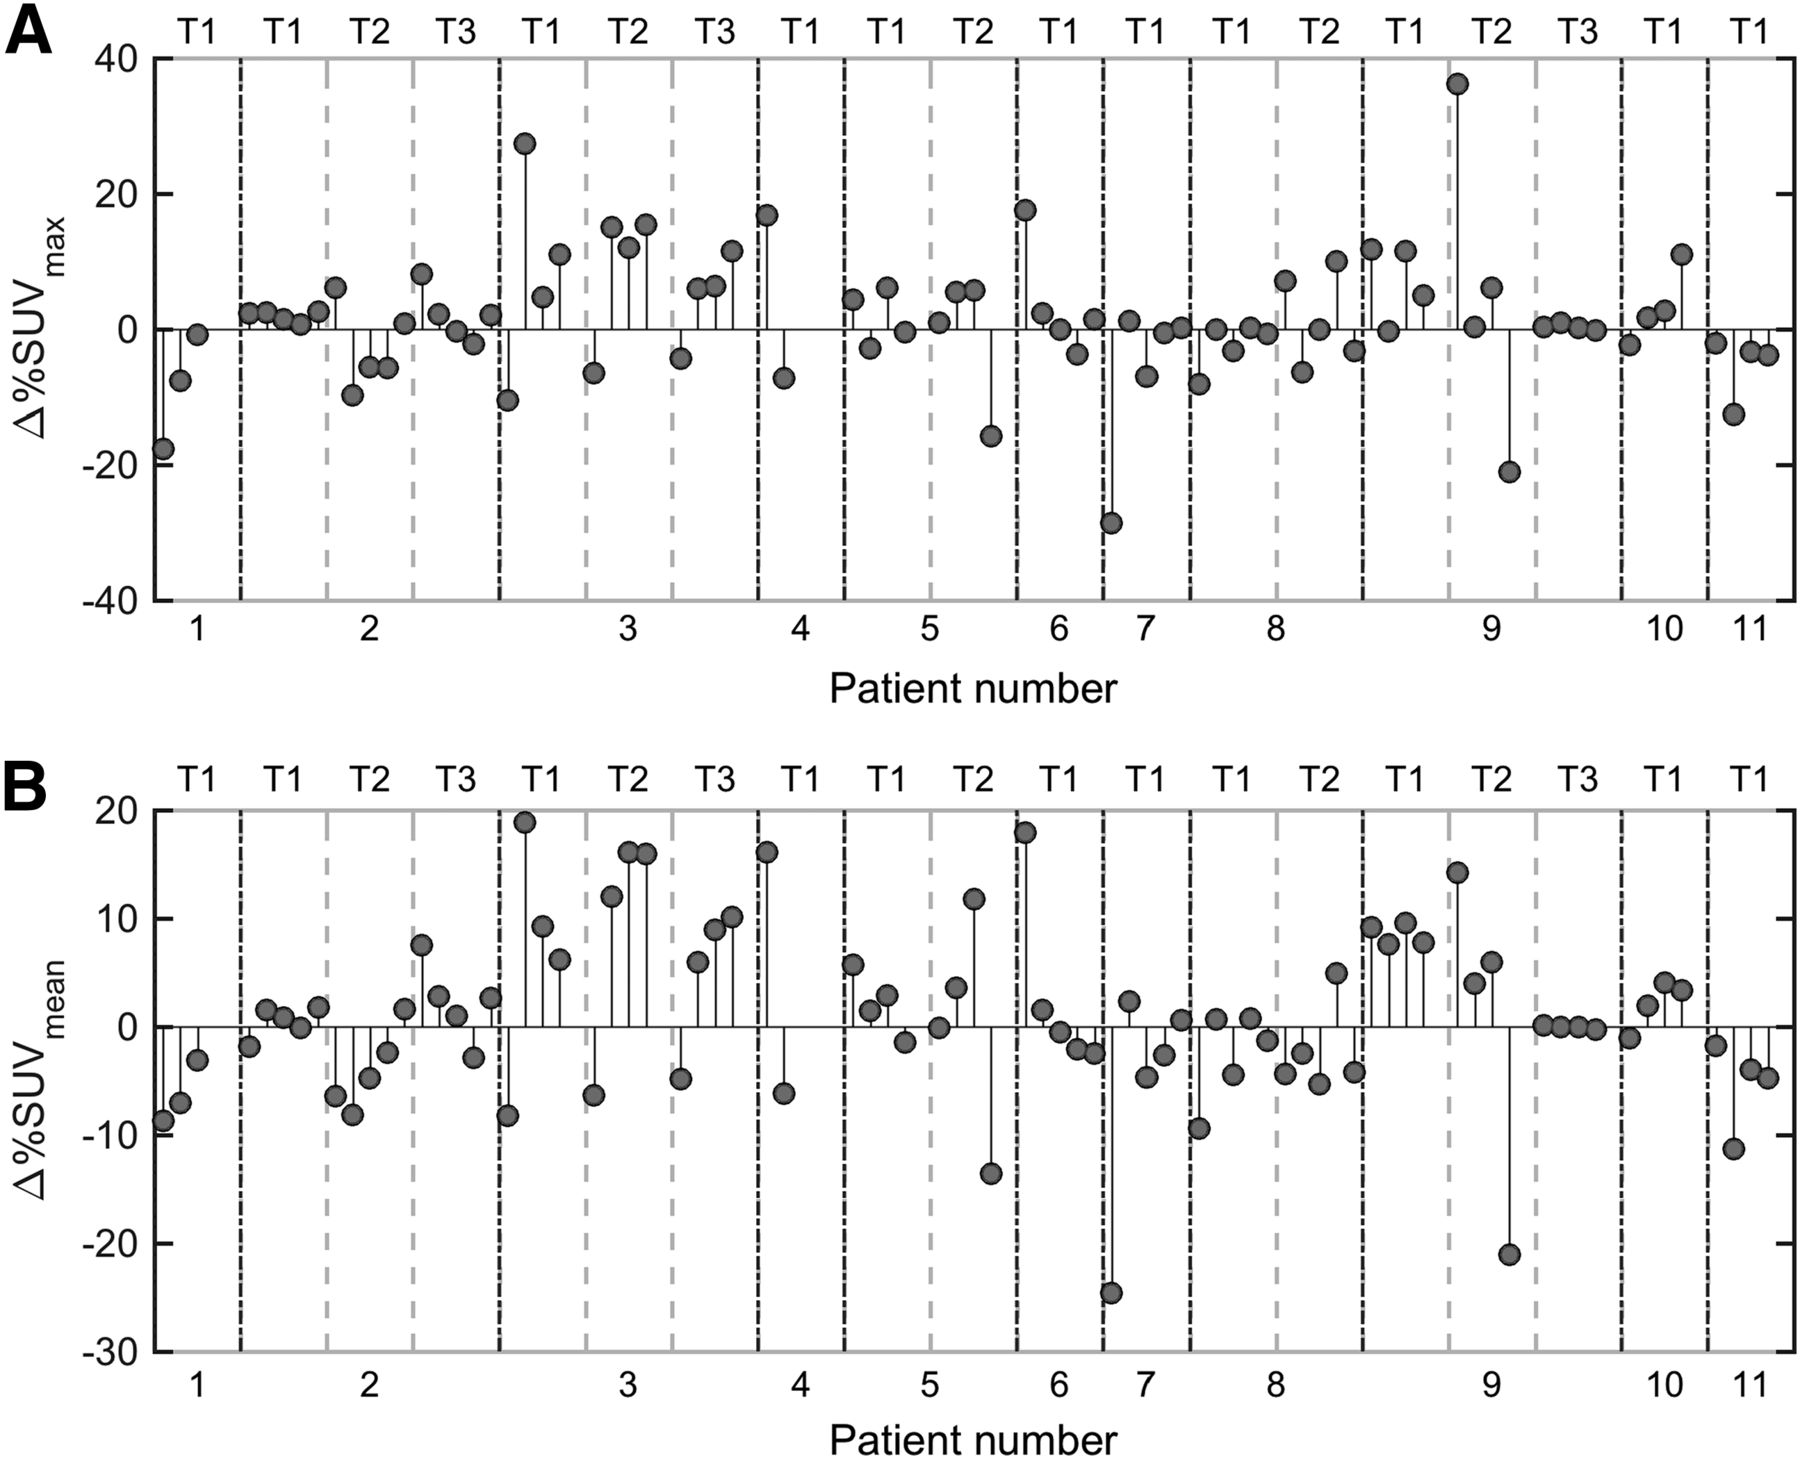
Critical artifacts, subjectively expected to affect SUV, were present in 30% (27/90) of the MR-AC maps. Figure 1 reports an overview of the MR-AC maps categorized as critical and noncritical, including color coding to specify the type of artifact causing a critical categorization. The information in Figure 1 can be related to Figure 2, where and
and  can be seen for each tumor of each examination of each patient. In relation to reproducibility, it is of interest that in 9 examinations the 2 members of the MR-AC map pair, μ-mapA and μ-mapB, were categorized differently from each other—that is, one as critical and the other as noncritical. The
  exceeded ±20% for 4 tumors (originating from 4 different repeated MR-AC map pairs in 3 different patients).
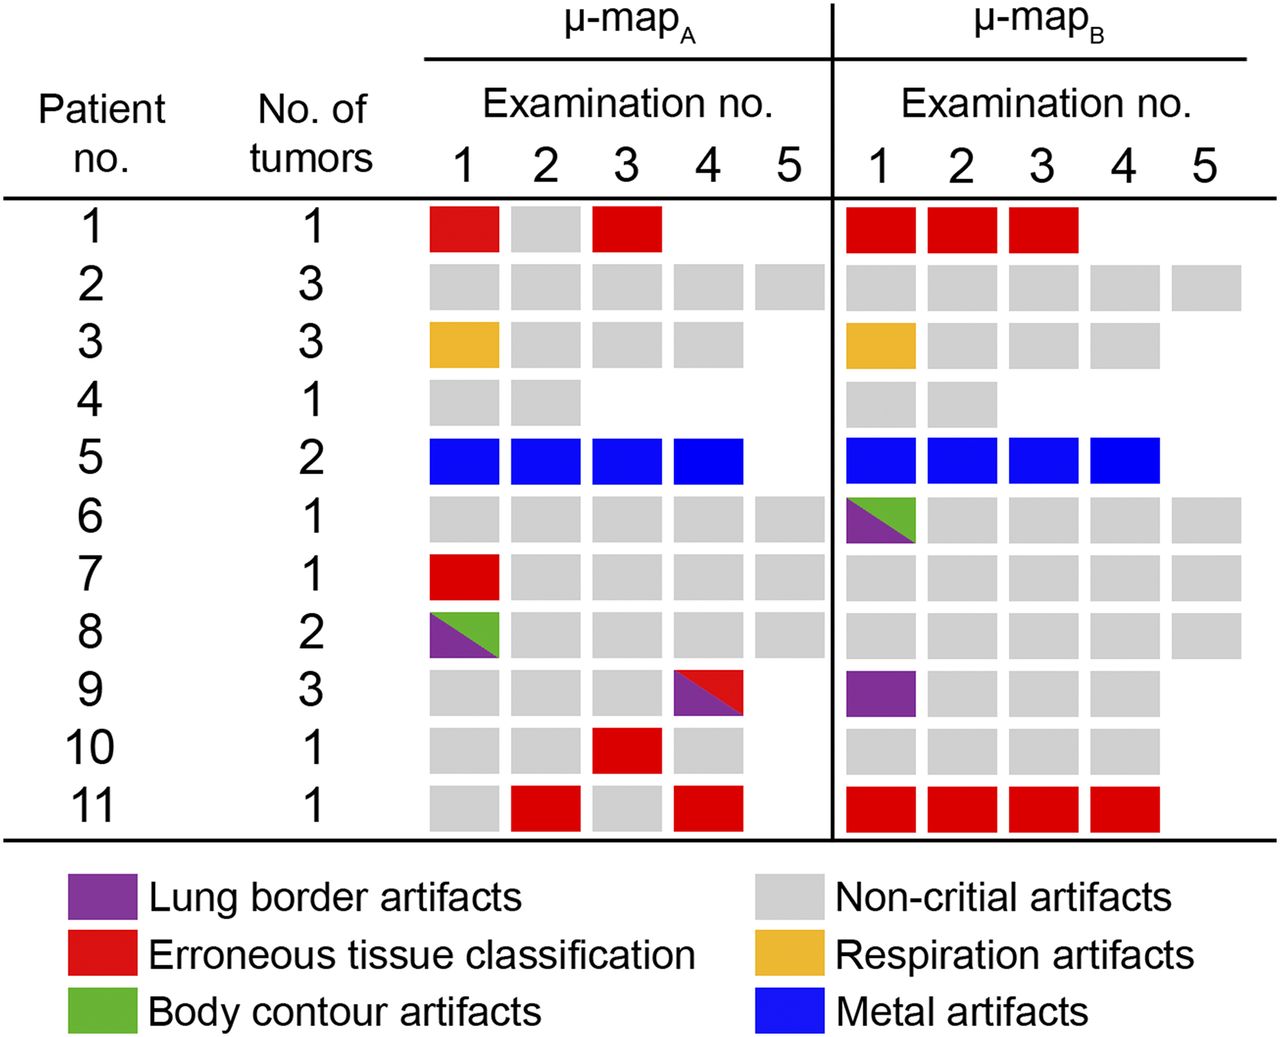
Overview of categorization of all 90 MR-AC maps, including color coding of type of artifact causing categorization. Empty fields indicate no examination performed, and gray squares indicate MR-AC maps categorized as noncritical. All other colored squares indicate MR-AC maps categorized as critical.

Overview of  (A) and
  (B) for each tumor of each examination of each patient. Each patient has up to 3 tumors (T1, T2, T3). For each tumor,
  is displayed on y-axis for each examination (up to 5 examinations). This information can be compared with that of Figure 1.
We consider in detail the 4 cases in which  exceeded ±20%.
Case 1
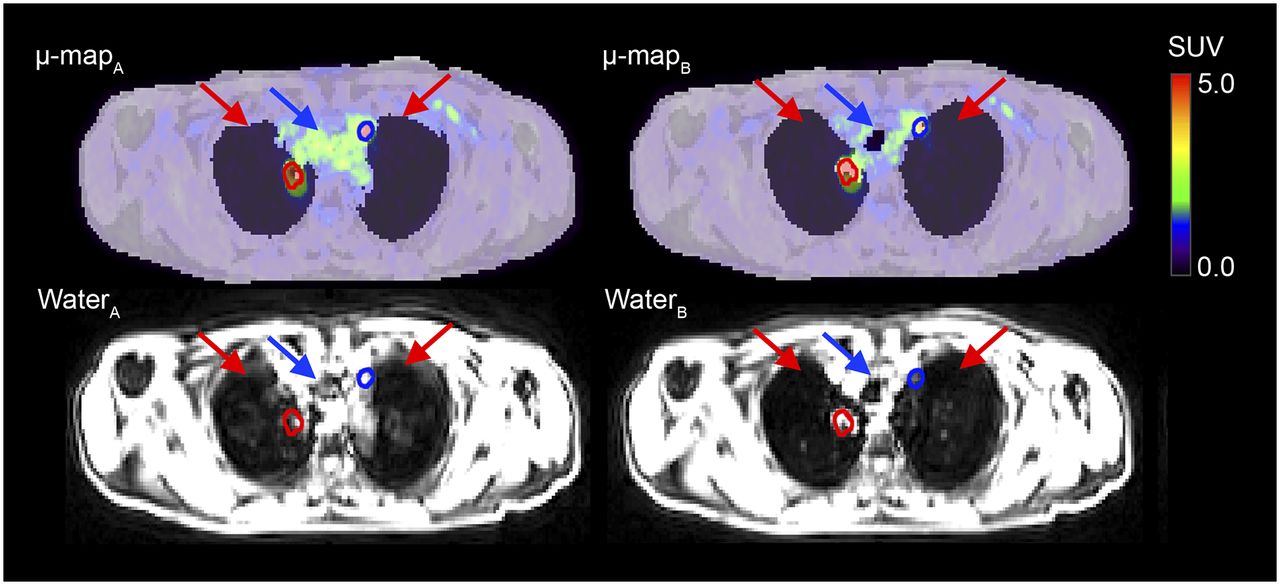
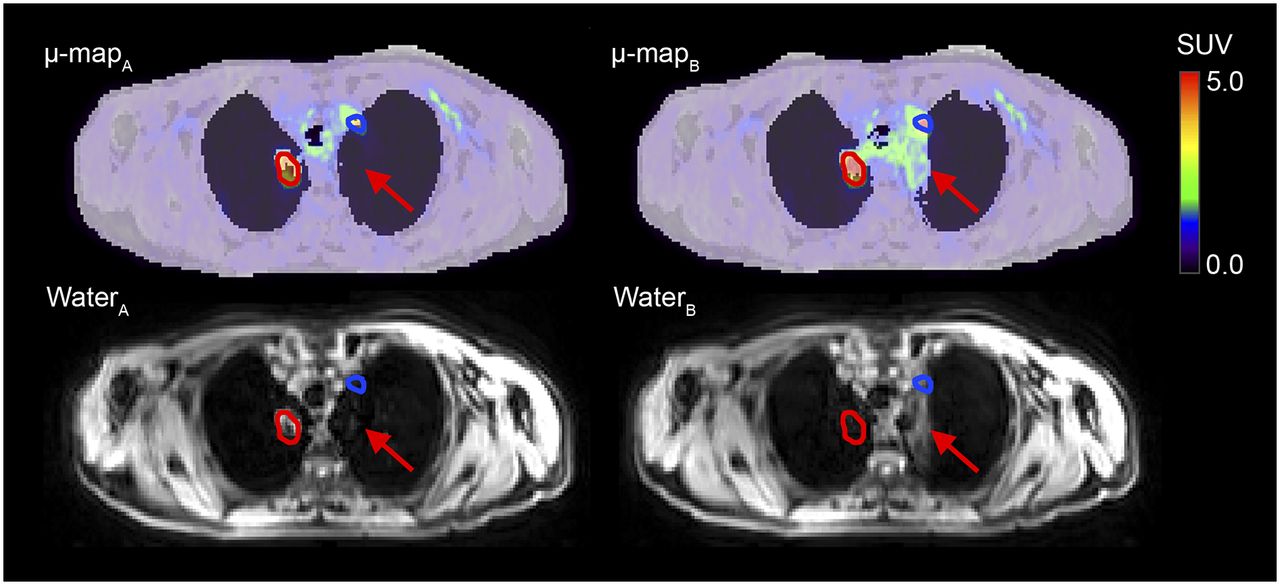
In the first examination of patient 9 (Fig. 3), μ-mapA was categorized as noncritical and μ-mapB was categorized as critical (lung border artifact). Obvious differences in what is classified as lung tissue could be seen in the paired MR-AC maps.

Patient 9, examination 1. Intrasubject repeated MR-AC maps fused with PETA and PETB are shown along with their respective Dixon water images. Tumor delineated in red has  of 12%; tumor delineated in blue, 36%. Arrows indicate noteworthy differences in paired MR-AC maps and Dixon water images.
Case 2
In the fourth examination of patient 9 (Fig. 4), μ-mapA was categorized as critical (lung border artifact and erroneous tissue classification) and μ-mapB was categorized as noncritical. Obvious differences in the paired MR-AC maps could be seen, and respiratory motion was apparent from the corresponding Dixon water images. Part of the lungs and the entire trachea were misclassified as soft tissue in μ-mapA.
Patient 9, examination 4. Intrasubject repeated MR-AC maps fused with PETA and PETB are shown along with their respective Dixon water images. Respiratory motion causes incorrect tissue classification in μ-mapA. Trachea is completely missed (blue arrows), and lung tissue is incorrectly classified as soft tissue (red arrows). As a result, PETB is lower than PETA for tumor delineated in blue ( of −21%), because PETA is locally overcorrected for attenuation (SUVs too high). Tumor delineated in red is incorrectly classified as lung tissue in μ-mapA, causing undercorrection for attenuation in PETA and causing PETB to be slightly higher than PETA (
 of 5%).
Case 3
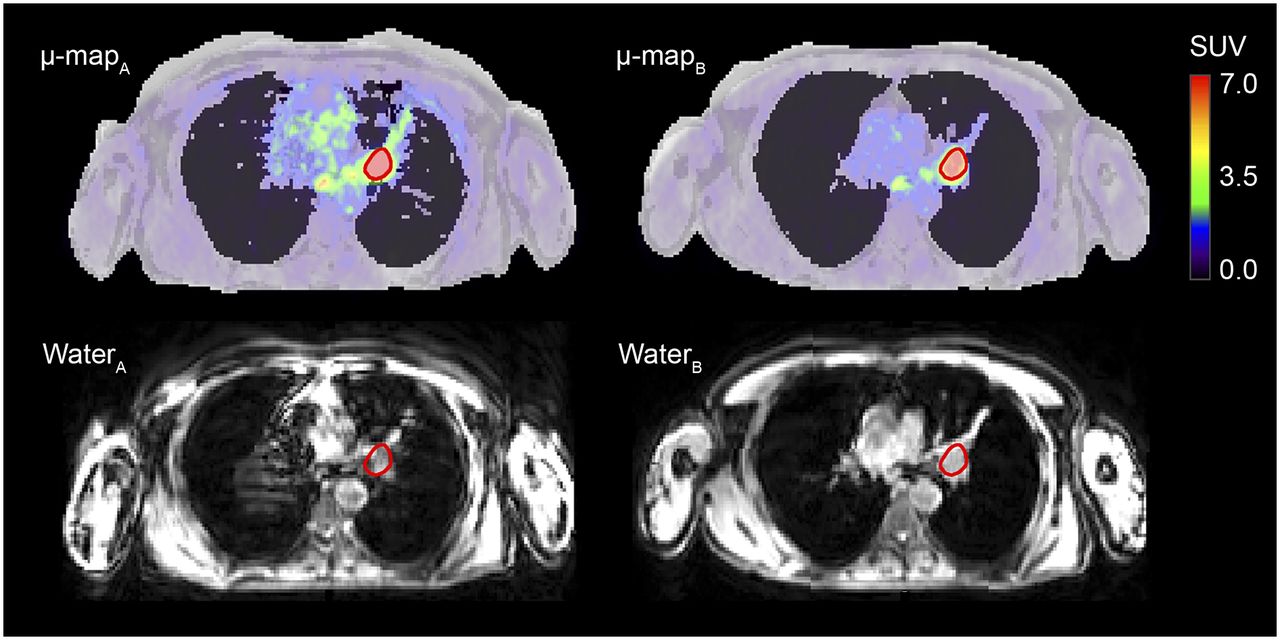
In the first examination of patient 7 (Fig. 5), μ-mapA was categorized as critical (erroneous tissue classification) and μ-mapB was categorized as noncritical. In the Dixon water image of μ-mapA, there were pronounced respiratory motion artifacts that resulted in tissue misclassification in μ-mapA.

Patient 7, examination 1. Intrasubject repeated MR-AC maps fused with PETA and PETB are shown along with their respective Dixon water images.  of −29% is found in tumor delineated in red. Respiratory motion artifacts cause erroneous tissue classification in μ-mapA.
Case 4
In the second examination of patient 3 (Fig. 6), both MR-AC maps were categorized as noncritical. Nevertheless, 1 of the 3 tumors had a large percentage difference, with a  of 27%. Through a joint inspection of the MR-AC maps and the corresponding Dixon water image, several different respiration states in the Dixon water image of μ-mapB became apparent. This feature was undetected by the physicians, as the evaluation of each MR-AC map was limited to MR-AC maps not including the Dixon water images.
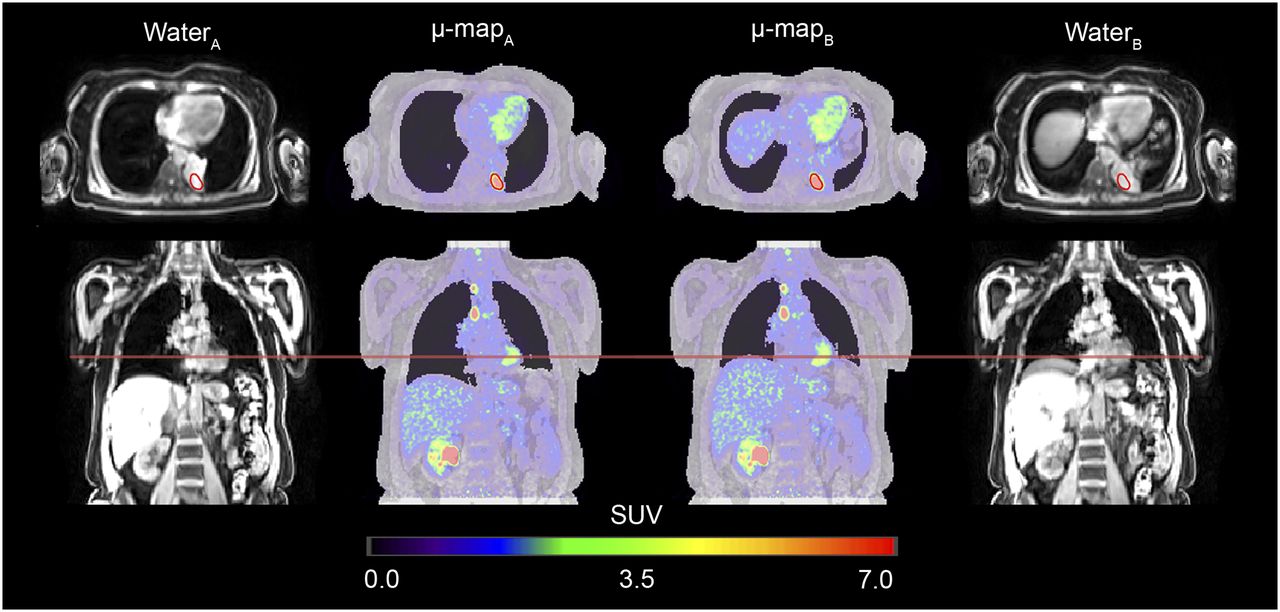
Patient 3, examination 2. Intrasubject repeated MR-AC maps fused with PETA and PETB are shown along with their respective Dixon water images. Initially, no artifacts were thought to affect tumor SUV based on visual evaluation of MR-AC maps alone. However, from corresponding Dixon water image of μ-mapB, respiration artifacts are apparent. A comparison of μ-mapA and μ-mapB shows partially elevated diaphragm in μ-mapB (red line), causing  of 27%.
The Bland–Altman plots with the percentage differences in SUVmean and SUVmax are shown in Figure 7. The back-transformed bias between the observations and the back-transformed lower and upper LOA are also shown in Figure 7. Table 1 summarizes the results and depicts the lower and upper LOA, intraclass correlation, and coefficient of variation for SUVmean and SUVmax. The LOA were approximately ±20% for both SUVmean and SUVmax.

Bland–Altman plots showing  vs. average SUV. Upper and lower LOA were calculated for log-transformed SUVmean (A) and log-transformed SUVmax (B), in which multiple observations for each patient were accounted for.
Intraclass Correlation and Coefficient of Variation for SUVmean and SUVmax
The correlation matrix for the variables ,
, ,
,  ,
,  , and
, and  is shown in Table 2. The relative SUV differences correlated with both
  and
and  . Furthermore,
 and
and  had a strong negative correlation.
Correlation Matrix for  ,
,  , and Selected Variables Measured Within 10-Centimeter-Diameter Sphere Encapsulating Center of Mass of Tumor
DISCUSSION
To the best of our knowledge, this study was the first to examine how the reproducibility of thoracic MR-AC maps affects PET quantification by comparing PET image pairs (PETA and PETB) reconstructed with the same emission data but different intrasubject repeated MR-AC maps.
In general, we found that the relative SUV variations were independent of the absolute values (Fig. 7). Both SUVmean and SUVmax had a coefficient of variation of approximately 6%, and the scan–rescan SUV variation was within ±20% in 95% of the cases using intrasubject repeated MR-AC map pairs. If we assume SUVmax to be similar to lean body mass–corrected SUVpeak, then the observed LOA are within the proposed PERCIST criteria for stable disease (change within ±30%) (9). However, these criteria are based on studies that assessed SUV variations from 2 different PET acquisitions; thus, the variation comes from several sources, including differences in emission and attenuation data as well as biologic variations. The only source of variation in our study came from differences in the MR-AC maps alone—differences that are additional to other well-known sources of variation in measuring SUV. Thus, the SUV variations observed in this study must be considered alarmingly high. Note that the distribution is skewed. This bias might be related to a systematic difference in the paired MR-AC maps, as could be caused, for example, by the patients being more relaxed during the later scan. For comparison, a metaanalysis by de Langen et al. reported LOA for day-to-day SUV variations for 18F-FDG PET-only and PET/CT of ±20% for SUVmean and ±25% for SUVmax (11). Rasmussen et al. reported LOA of ±20% and a coefficient of variation of about 6% for day-to-day SUV variations in 18F-FDG PET/CT and PET/MRI in patients with head and neck squamous cell carcinoma (12).
Substantial SUVmax differences (exceeding ±20%) were observed in 4 different examinations. In 3 of the 4 cases, the paired MR-AC maps were categorized differently, as agrees with the expectation that large differences between MR-AC maps will result in large differences in SUVs. This finding emphasizes that physicians must examine the MR-AC maps and be aware that SUV measures can be unreliable if artifacts or patient motion is present. On the other hand, of the 9 examinations in which the paired MR-AC maps were categorized differently, 5 had SUVmax differences of less than 10% and 1 had a difference of 18%. Furthermore, in the case in which  exceeded 20% but no critical artifacts were detected, different states of the breathing cycle could be observed when the paired MR-AC maps were compared side-by-side and when the Dixon water image of μ-mapB was inspected (Fig. 5). This finding suggests that artifacts and respiratory motion affecting quantitative PET are difficult to identify when only the corresponding MR-AC map is inspected. Therefore, a joint inspection of the MR-AC map and the underlying Dixon images for artifacts, and thus patient compliance with breath-hold instructions, is recommended. Alternatively, acquisition of more than 1 MR-AC map per patient could be a safety precaution in case the first acquisition has obvious artifacts.
Most of the large SUV differences resulted from respiratory motion, which led to a misclassification of lung tissue as soft tissue and vice versa in the MR-AC maps (Table 2). Thus, we propose that strategies to obtain highly reproducible MR-AC maps should focus on reducing movement during data acquisition. Furthermore, the segmentation algorithm deriving the MR-AC maps should be optimized.
In this study, 19 different tumors from 11 patients were investigated. Each patient underwent several test–retest scans over a few days, giving 80 tumors for analysis but with multiple repetitions of the same tumors. Therefore, multiple lesions within the same patient may have an undesirable correlated reproducibility, as may the same tumor from different days. We accounted for this possibility by using the Bland–Altman analysis for repeated observations (28,29). Nevertheless, it would be desirable to have a larger study population to generalize observations.
Projecting the VOIs from one PET image to the other instead of recalculating the isocontour may also have affected our results. The projection method was conservative and was applied because we wanted to quantify the effect of MR-AC reproducibility in a specific and fixed tumor volume, whereas recalculating the isocontour would change these quantitative values while giving insight into morphologic changes in the VOI, such as volume.
Furthermore, for studies in which repeated PET scans are performed, the allocation of predetermined attenuation coefficients to specific tissues not only introduces a bias but also is a potential source of variation, as the attenuation in lung can vary dramatically depending on disease and respiration pattern. However, in the present study, we used the same raw PET data but applied different intrasubject repeated MR-AC maps, which were acquired without repositioning the patient. Thus, the only variation in the resulting PET images would be that arising from the differences in the MR-AC maps and not from assumption of a fixed single attenuation value.
Finally, although new methods for deriving improved MR-AC map including bone representatives is under intense research (23,30), a reproducibility study of such methods should also be conducted.
CONCLUSION
In the present study, we found that artifacts occur frequently in standard thoracic MR-AC maps, affecting the reproducibility of PET/MRI by causing large SUV variations. These artifacts, in combination with other well-known sources of error associated with PET/MRI examinations, lead to inconsistent SUV measurements in serial studies, which may affect the reliability of therapy response assessment. Therefore, a thorough visual inspection of thoracic MR-AC maps and the corresponding unsegmented Dixon images remains crucial for the detection of artifacts and errors influencing the reproducibility of SUV in test–retest settings. On the basis of our findings, a reduction in respiratory movement during data acquisition, possibly by shortening the acquisition time or by gated data acquisition, is especially important for improving MR-AC map reproducibility.
DISCLOSURE
This project was supported by grants from the Danish Cancer Society (grants R134-A8543-B79 and Rp11446). No other potential conflict of interest relevant to this article was reported.
Acknowledgments
We thank the John and Birthe Meyer Foundation, which donated the PET/MRI system.
Footnotes
Published online Nov. 9, 2017.
- © 2018 by the Society of Nuclear Medicine and Molecular Imaging.
REFERENCES
- Received for publication July 10, 2017.
- Accepted for publication October 30, 2017.


