


Article Figures & Data
Figures
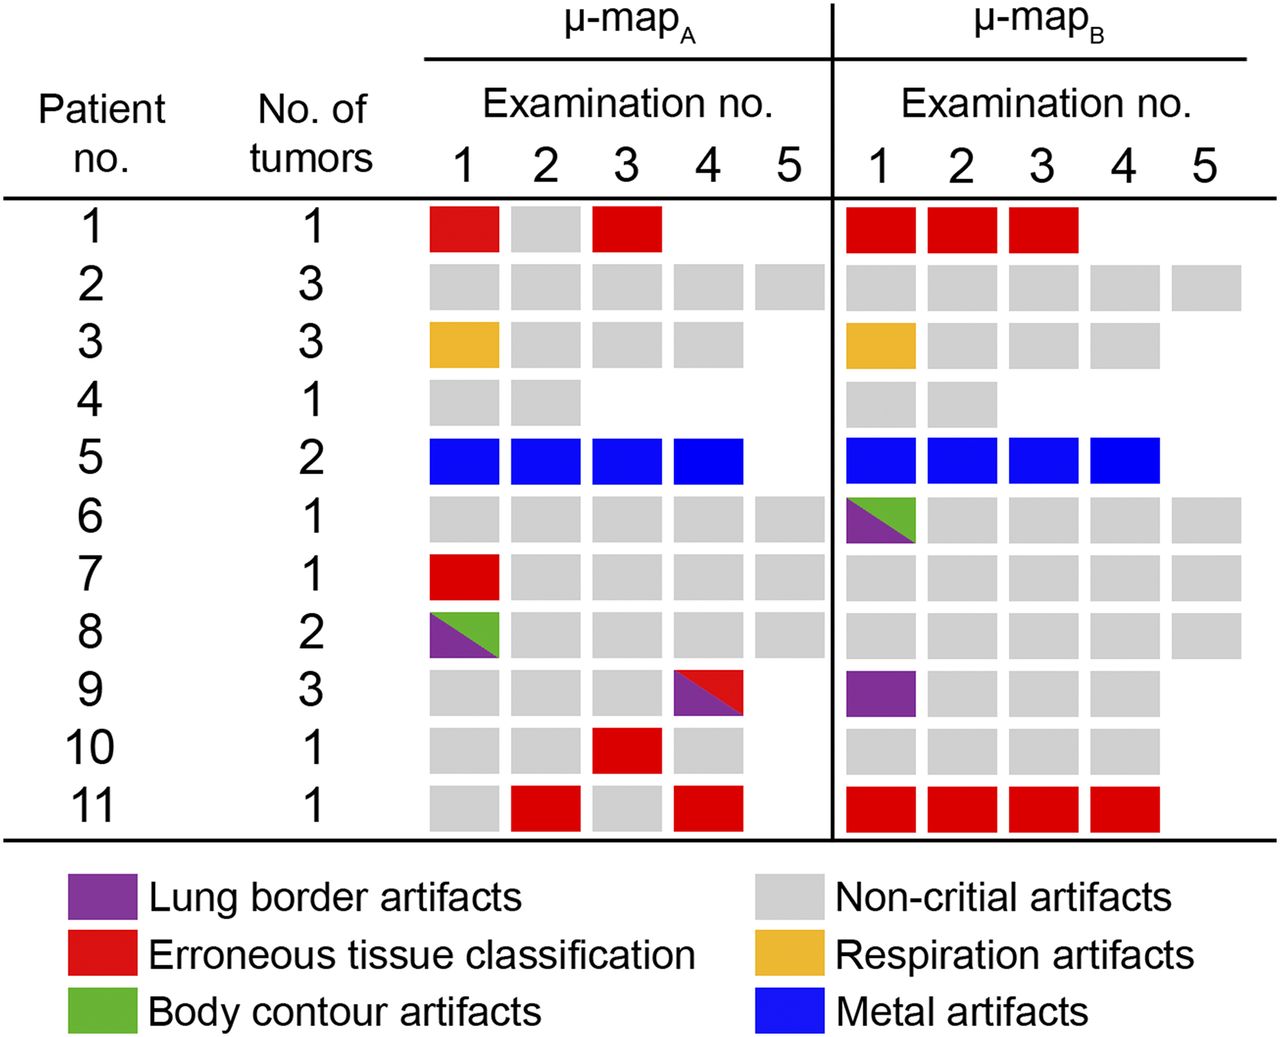
- FIGURE 1.
Overview of categorization of all 90 MR-AC maps, including color coding of type of artifact causing categorization. Empty fields indicate no examination performed, and gray squares indicate MR-AC maps categorized as noncritical. All other colored squares indicate MR-AC maps categorized as critical.
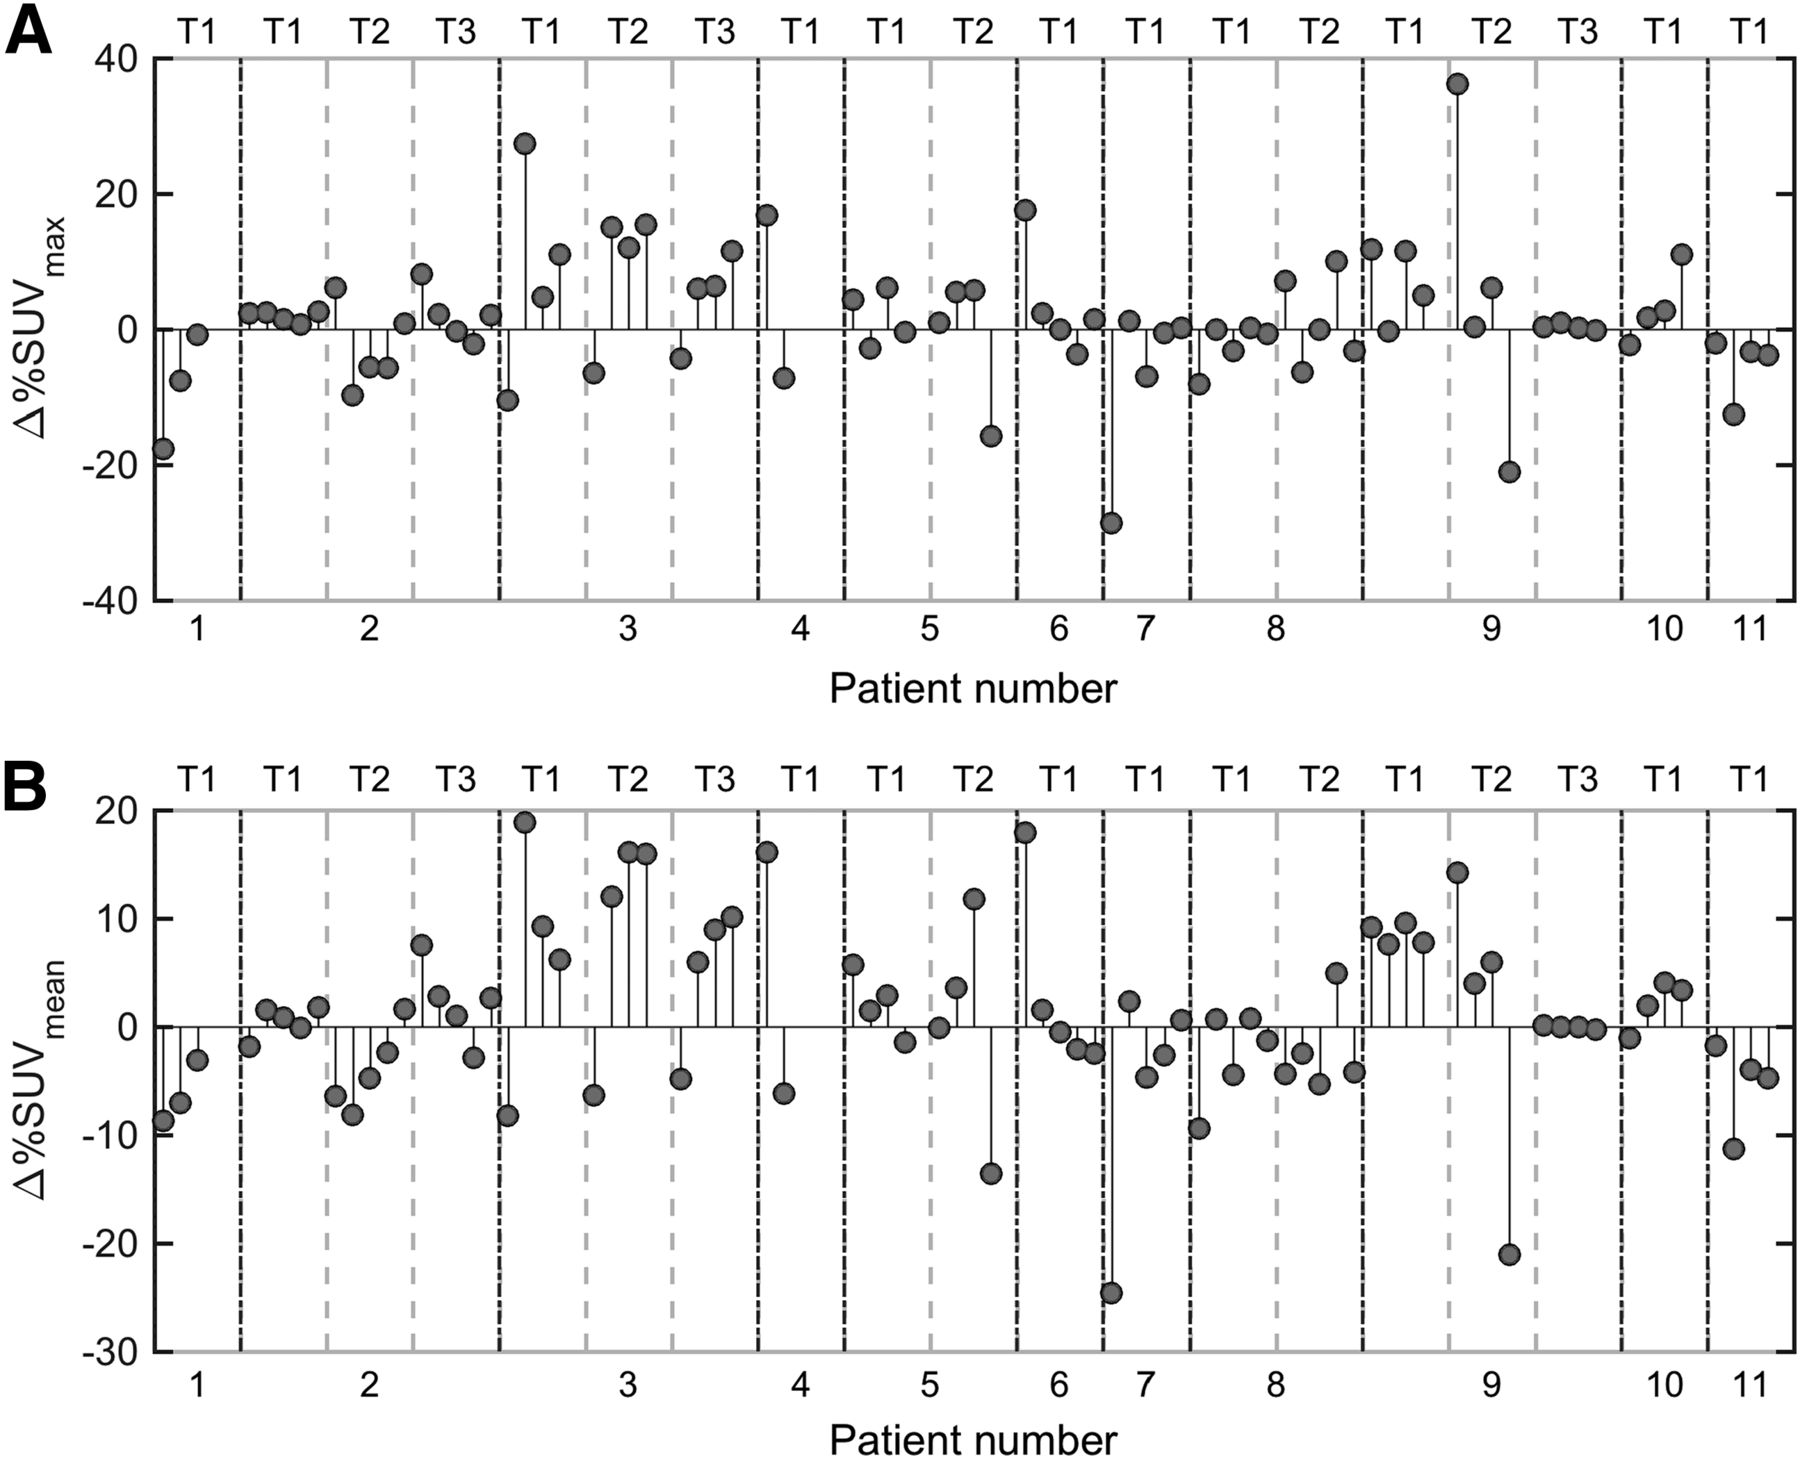
- FIGURE 2.
Overview of
 (A) and (B) for each tumor of each examination of each patient. Each patient has up to 3 tumors (T1, T2, T3). For each tumor, is displayed on y-axis for each examination (up to 5 examinations). This information can be compared with that of Figure 1.
 - FIGURE 3.
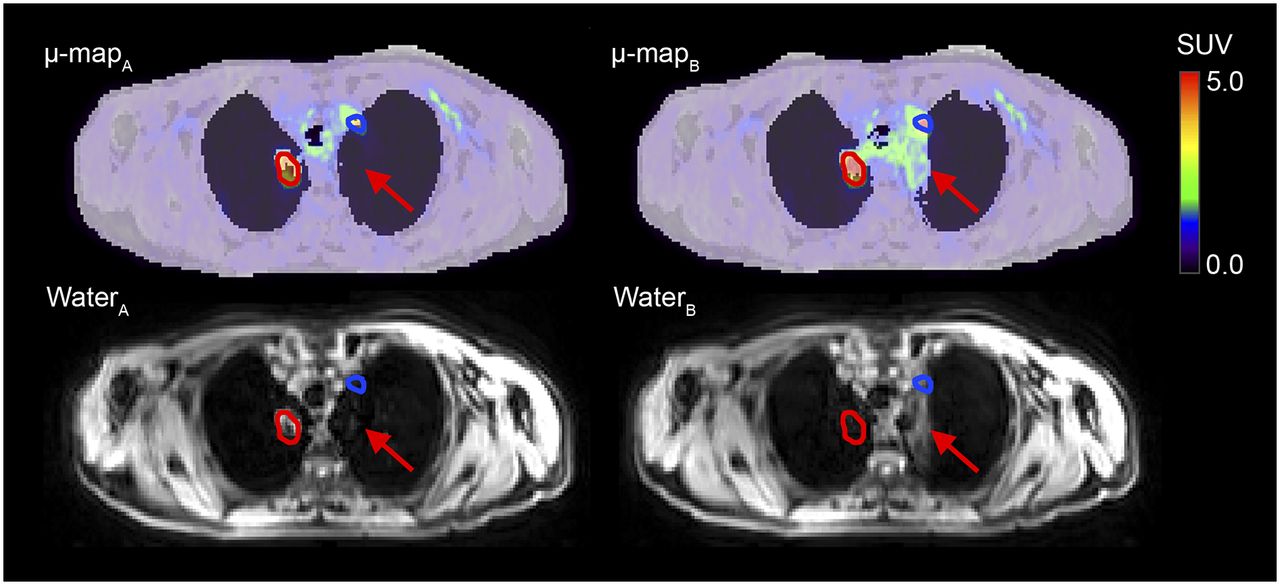
Patient 9, examination 1. Intrasubject repeated MR-AC maps fused with PETA and PETB are shown along with their respective Dixon water images. Tumor delineated in red has
of 12%; tumor delineated in blue, 36%. Arrows indicate noteworthy differences in paired MR-AC maps and Dixon water images. - FIGURE 4.
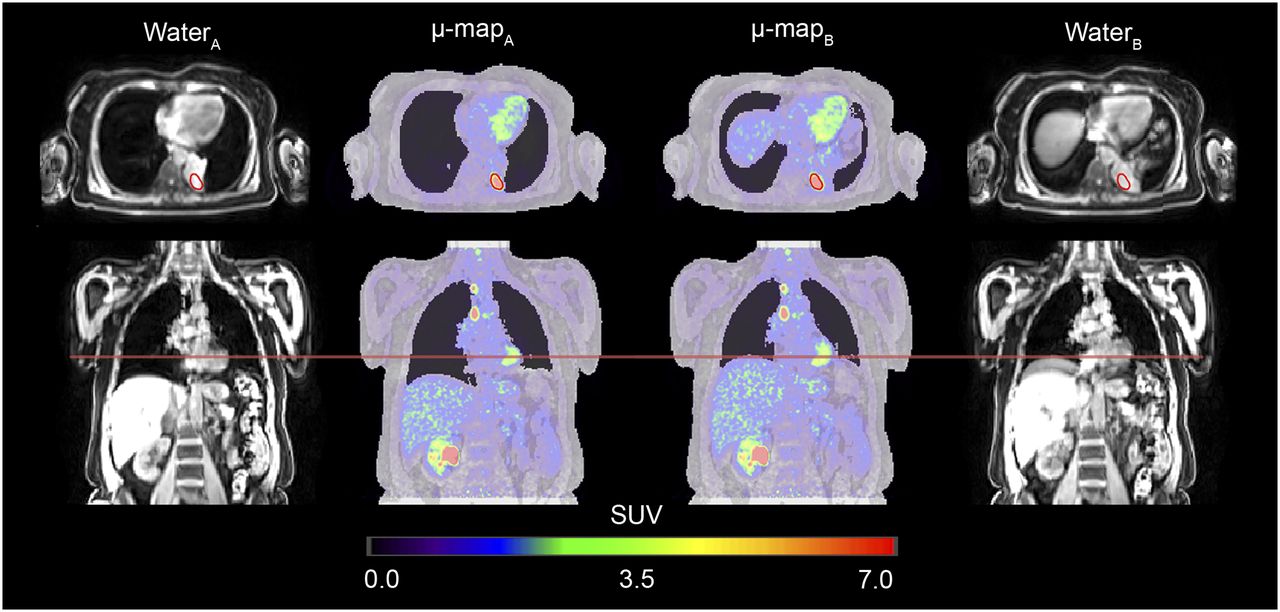
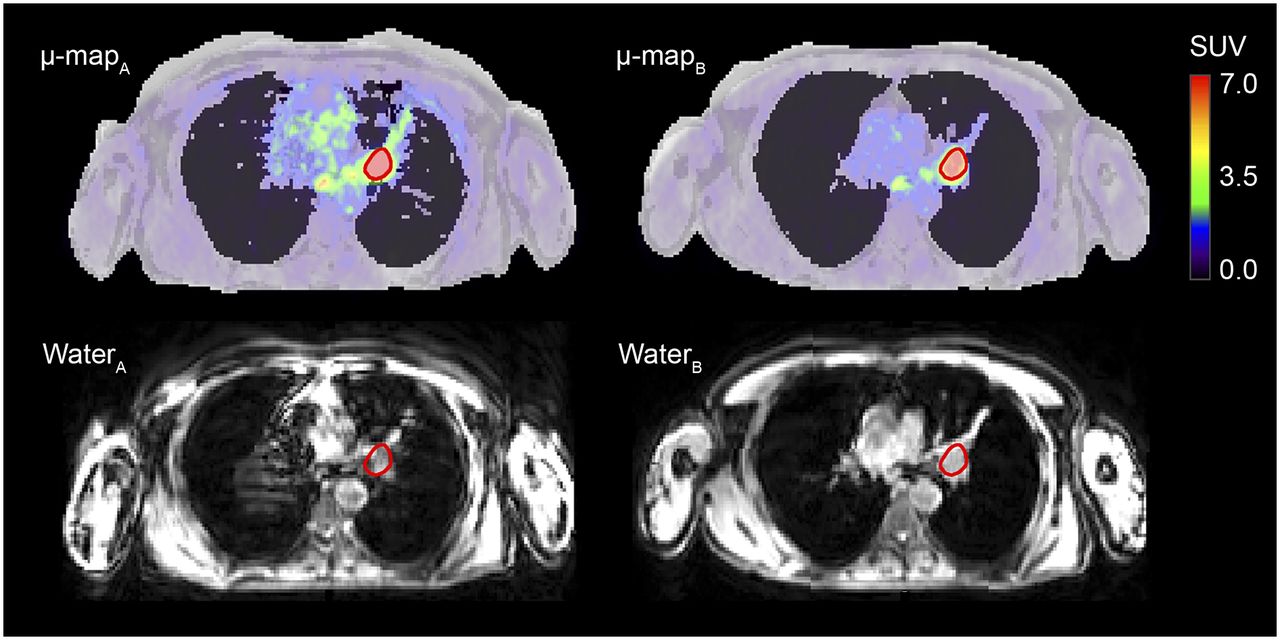
Patient 9, examination 4. Intrasubject repeated MR-AC maps fused with PETA and PETB are shown along with their respective Dixon water images. Respiratory motion causes incorrect tissue classification in μ-mapA. Trachea is completely missed (blue arrows), and lung tissue is incorrectly classified as soft tissue (red arrows). As a result, PETB is lower than PETA for tumor delineated in blue (
of −21%), because PETA is locally overcorrected for attenuation (SUVs too high). Tumor delineated in red is incorrectly classified as lung tissue in μ-mapA, causing undercorrection for attenuation in PETA and causing PETB to be slightly higher than PETA ( of 5%). - FIGURE 5.
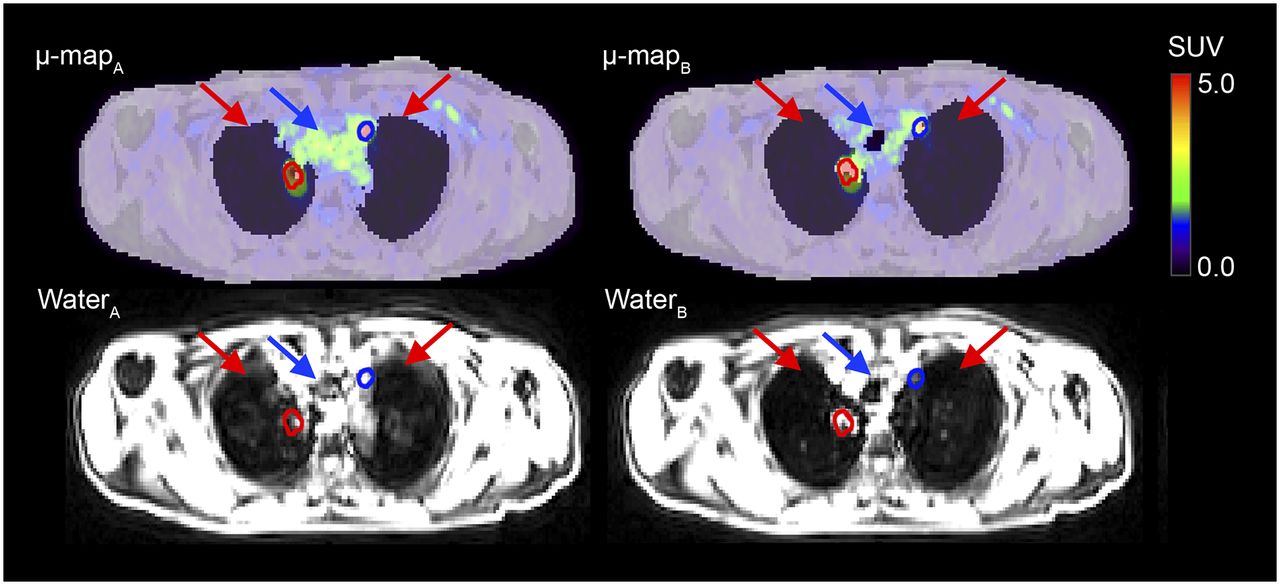
Patient 7, examination 1. Intrasubject repeated MR-AC maps fused with PETA and PETB are shown along with their respective Dixon water images.
of −29% is found in tumor delineated in red. Respiratory motion artifacts cause erroneous tissue classification in μ-mapA. - FIGURE 6.
Patient 3, examination 2. Intrasubject repeated MR-AC maps fused with PETA and PETB are shown along with their respective Dixon water images. Initially, no artifacts were thought to affect tumor SUV based on visual evaluation of MR-AC maps alone. However, from corresponding Dixon water image of μ-mapB, respiration artifacts are apparent. A comparison of μ-mapA and μ-mapB shows partially elevated diaphragm in μ-mapB (red line), causing
of 27%. - FIGURE 7.
Bland–Altman plots showing
vs. average SUV. Upper and lower LOA were calculated for log-transformed SUVmean (A) and log-transformed SUVmax (B), in which multiple observations for each patient were accounted for.


Tables
LOA (%) Variable Intraclass correlation Coefficient of variation (%) Lower Upper SUVmean 0.982 5.6 −14.08 17.48 SUVmax 0.975 6.6 −16.21 21.18


