


Abstract
HighlY constrained backPRojection (HYPR) is a promising image-processing strategy with widespread application in time-resolved MRI that is also well suited for PET applications requiring time series data. The HYPR technique involves the creation of a composite image from the entire time series. The individual time frames then provide the basis for weighting matrices of the composite. The signal-to-noise ratio (SNR) of the individual time frames can be dramatically improved using the high SNR of the composite image. In this study, we introduced the modified HYPR algorithm (the HYPR method constraining the backprojections to local regions of interest [HYPR-LR]) for the processing of dynamic PET studies. We demonstrated the performance of HYPR-LR in phantom, small-animal, and human studies using qualitative, semiquantitative, and quantitative comparisons. The results demonstrate that significant improvements in SNR can be realized in the PET time series, particularly for voxel-based analysis, without sacrificing spatial resolution. HYPR-LR processing holds great potential in nuclear medicine imaging for all applications with low SNR in dynamic scans, including for the generation of voxel-based parametric images and visualization of rapid radiotracer uptake and distribution.
PET is a powerful in vivo imaging modality for tracking dynamic changes in physiologic processes. However, the temporal resolution and, in turn, the underlying physiologic information are often sacrificed by integrating the data collection across time to yield images with adequate signal-to-noise ratios (SNRs). Such has been the strategy for 18F-FDG, the mainstay of PET, using imaging acquisition methods that require only 1 time point to obtain an approximation of glucose metabolism (1). Despite the experimental ease of single-time-point assays, investigators have acknowledged the advantages of acquiring radiotracer time courses for quantitative assessment (2,3). Kinetic analysis is generally recognized as a more informative method of quantifying PET data than using simpler methods such as standardized uptake values (4–6) but remains underutilized in the clinical setting in part because of the low SNR accompanying time series data and lengthier acquisition.
Strategies have been explored since the infancy of PET to optimize both data acquisition and algorithm implementation for parameter estimation from dynamic time series (7–9). Preprocessing algorithms (i.e., on sinograms) were developed to exploit the spatiotemporal correlation in dynamic PET scans, with the aim of improving physiologic parameter estimation (10,11). Most strategies have focused on postprocessing algorithms with time series data reconstructed with filtered backprojection (FBP) or ordered-subset expectation maximization. For example, wavelet processing has demonstrated some success as a denoising method on voxel-based time–activity data (12–15). However, wavelet processing is computationally intensive and requires further investigation to optimize the denoising of wavelet coefficients. Methods using spatial constraint algorithms have also been applied to the process of parameter estimation and have yielded measurable reductions in parameter estimation variability (16), but these methods are limited to the spatial constraint of a single time frame and do not take advantage of the increased SNR of the entire time series.
HighlY constrained back PRojection (HYPR) is a promising strategy with widespread application in time-resolved MRI (17) that is also well suited for PET applications requiring time series data. HYPR was initially introduced for the reconstruction of highly undersampled MRI time series data—for example, in applications for which the passage of contrast material through a region is faster than the acquisition capabilities of the MRI system. The HYPR technique involves the creation of a composite image from the entire undersampled radial time series. The individual (undersampled) time frames then provide the high temporal resolution for the weighting matrices, which are multiplied by the composite image containing the high spatial resolution. This technique permits image generation of rapidly changing processes from acquisitions that are radially undersampled by factors of up to several hundred. This method was further refined by constraining the backprojections to local regions of interest (ROIs), which was termed HYPR-LR (18). This local reconstruction adaptation of HYPR can accommodate situations in which image sparsity and complete spatiotemporal correlation are not met. For the case of radionuclide imaging studies, in which adequate angular sampling exists during each time frame, the HYPR-LR weighting images are formed by a ratio of convolved versions of the time frame and composite image, thus taking advantage of the spatiotemporal correlations between time frames.
Strategies have been used for the application of partial-volume correction of PET data that use algorithms similar to HYPR-LR. Boussion et al. (19) developed a technique to capture the high spatial resolution from a separate imaging study, such as MRI or CT, using wavelet transforms and applying this information into image-based corrections for the lower-resolution PET (and SPECT) studies. In contrast, the HYPR-LR algorithm captures high SNR by integrating the PET data over the time course of the study but with the same spatial resolution as the original PET data. Filtering functions are then used to obtain high SNR in the independent time frames, without attempting to improve spatial resolution.
HYPR-LR processing holds great potential in nuclear medicine imaging for all applications with low SNR in dynamic scans, including the generation of voxel-based parametric images and visualization of rapid radiotracer uptake and distribution. To evaluate the performance of HYPR-LR postprocessing (i.e., on the FBP-reconstructed dataset), we present data based on qualitative, semiquantitative, and quantitative comparisons in phantom, small-animal, and human studies. For all methods of evaluation, we chose to analyze dynamic measured PET data rather than to use computer-simulated data. This method of evaluation was chosen to present an overall performance of HYPR-LR postprocessing using actual studies to demonstrate the practical application of this technique and phantom studies to assess signal fidelity using known concentrations of radionuclide.
MATERIALS AND METHODS
HYPR-LR Processing
A schematic of the HYPR-LR method is shown in Figure 1. The general HYPR-LR approach involves the formation of a composite image from several or all of the images in a time series. This image, which provides high-spatial-resolution, high-SNR information, is multiplied by low-spatial-resolution weighting images formed from each time frame. HYPR-LR weighting images are formed by taking a ratio of spatially convolved versions of the time sequence and composite image; thus, each individual frame has an SNR closer to that of the composite. The functional equation for HYPR-LR processing, following the notation of Johnson et al. (18), is: Eq. 1where IH is the HYPR image, and Ic is the time-averaged composite image. Iw is the weighting image derived from the original reconstructed images I; a box-kernel (low-pass) spatial filter function, F; and Ic, given as:
 Eq. 2In the original formulation (18), the Ic term in the denominator of Equation 2 was represented by a composite formed from a sliding temporal window of the time series (rather than the entire time series). The temporal window for the image, Ic, was empirically determined by examining the fidelity of the large ROI PET signal (i.e., high SNR) with the HYPR-LR time series of varying window widths. For the studies reported herein, it was found that using the entire time series for this image did not distort the signal fidelity; therefore, the composite image, Ic, represented the entire summed PET dynamic study—that is,
 Eq. 3for i frames of duration Δti. The filter function used either a 2-dimensional (2D; in-plane) or 3-dimensional (3D; volumetric) kernel, F. For dynamic PET studies with time frames of varying duration, the I (=PETi) images were weighted according to their duration (Δti). For the HYPR-LR process, the SNR of the individual time frames is largely determined by the SNR of the composite image, and it has been shown that the variance of the HYPR-LR images is inversely proportional to the number of nonzero elements in the filter function (F) (18). However, excessive spatial filtering can also introduce spillover of signals from neighboring regions. A range of spatial filters was investigated to examine this effect.

Schematic of HYPR-LR processing of dynamic PET data. 4D = 4-dimensional.
Experimental
Evaluating Accuracy and Reduced Voxel SNR
A custom-made miniature Derenzo acrylic phantom (diameter, 40 mm; length, 13 mm) was filled with a uniform concentration of aqueous radioactivity (18F, 1.5 MBq/mL) and scanned using a Concorde microPET P4 scanner (20). The phantom contained holes (diameters, 0.8, 1.0, 1.25, 1.5, 2.0, and 2.5 mm) arranged in wedged-shaped groupings, with the center-to-center hole separation being twice the hole diameter (21,22). Emission and transmission events were binned into 3D sinograms, with a span of 3 and a ring difference of 31, using the system software (version 2.3.3.6). The emission list-mode files were then binned into sixty 1-min frames. For reconstruction, the 3D sinograms were first rebinned to 2 dimensions by the system Fourier rebinning algorithm. The data were reconstructed using FBP with a ramp filter (at the Nyquist frequency cutoff), a ×1.5 image zoom, and no offsets to a matrix size of 128 × 128 × 63 with voxel dimensions of 1.26 × 1.26 × 1.21 mm. Corrections for normalization, dead time, random coincidences, attenuation, scatter, and decay of radioactivity were applied using the system software. An in-plane profile through the 2.5- and 1.5-mm diameter holes was applied to both the FBP and HYPR-LR processed time series. The mean and SD were then calculated for each voxel passing through the profile. The accuracy (bias) was compared on the basis of the profile mean measured concentration, and the SNR was defined as the voxel mean divided by its SD.
Measurement accuracy was also evaluated with a dynamic small-animal PET scan of the rhesus monkey using 18F-fallypride, a PET ligand targeting the dopamine D2/D3 receptor sites in the brain. 18F-fallypride was administered in 3 injections containing a high-specific-activity radiotracer (0 min, 168 MBq, 4.2 nmol), partially saturating low specific activity (20 min, 189 MBq, 10.3 nmol), and competing unlabeled blocking dose (80 min, 0 MBq, 100 nmol) into a 5-kg subject, and data were acquired for 160 min. The PET data were binned into dynamic frames of 2 min per frame. Time–activity curves were generated for the striatum, which demonstrated changing in vivo kinetics throughout the course of the study.
Accuracy in Parameter Estimation
An 80-mm-diameter cylindric phantom with 14-mm internal (cylindric) chambers was scanned using the Concorde microPET P4 scanner. The overall chamber was filled with 16.7 kBq/mL of 18F (half-life [t1/2], 110 min); one internal chamber was filled with 26 kBq/mL of 11C (t1/2, 20.4 min), one chamber with air, and the other with solid acrylic. This phantom was scanned for 40 min as the 11C activity went from roughly double to half the 18F background. The acquisition and reconstruction parameters were the same as those described above, except correction for decay was not included in the FBP reconstruction. ROIs (diameter, 9 voxels [11.3 mm], spanning 26 planes, 1,274 total voxels) were placed over the areas containing 11C and 18F radioactivity. Time–activity curves were generated for each voxel within these regions (voxelwise) and also for averages over the entire region (regionwise). Decay constants from the time–activity curves were estimated using a nonlinear least-squares fit (lsqcurvefit in Matlab [The MathWorks]; TolX = 1e-6, TolFun = 1e-6, MaxIter = 400) to the equation C(t) = Coe−λt, for the parameters of starting concentration (Co) and radionuclide decay constant (λ = ln(2)/t1/2), with initial guesses for the parameter values fixed to ±50% of the known values. The accuracy or bias of the estimates was measured by comparing the distribution mean with the known values (11C, 0.034 min−1; 18F, 0.0063 min−1).
Performance of HYPR-LR in Datasets with High Noise Levels
A human scan of 15O-water was acquired, which consisted of sixty 2-s frames initiated with a bolus injection of 2.78 GBq of radiotracer. The scan was acquired using the Advance PET scanner (GE Healthcare) in 2D mode, as specified by the NIH-sponsored Carotid Occlusion Surgery Study. The data were reconstructed using FBP (ramp filter) to a matrix size of 128 × 128 × 63, with voxel dimensions of 2.34 × 2.34 × 4.25 mm. HYPR-LR processing was performed using the entire 120 s of data as the composite image. Time–activity curves over small and large regions of the brain were compared for accuracy and SNR.
RESULTS
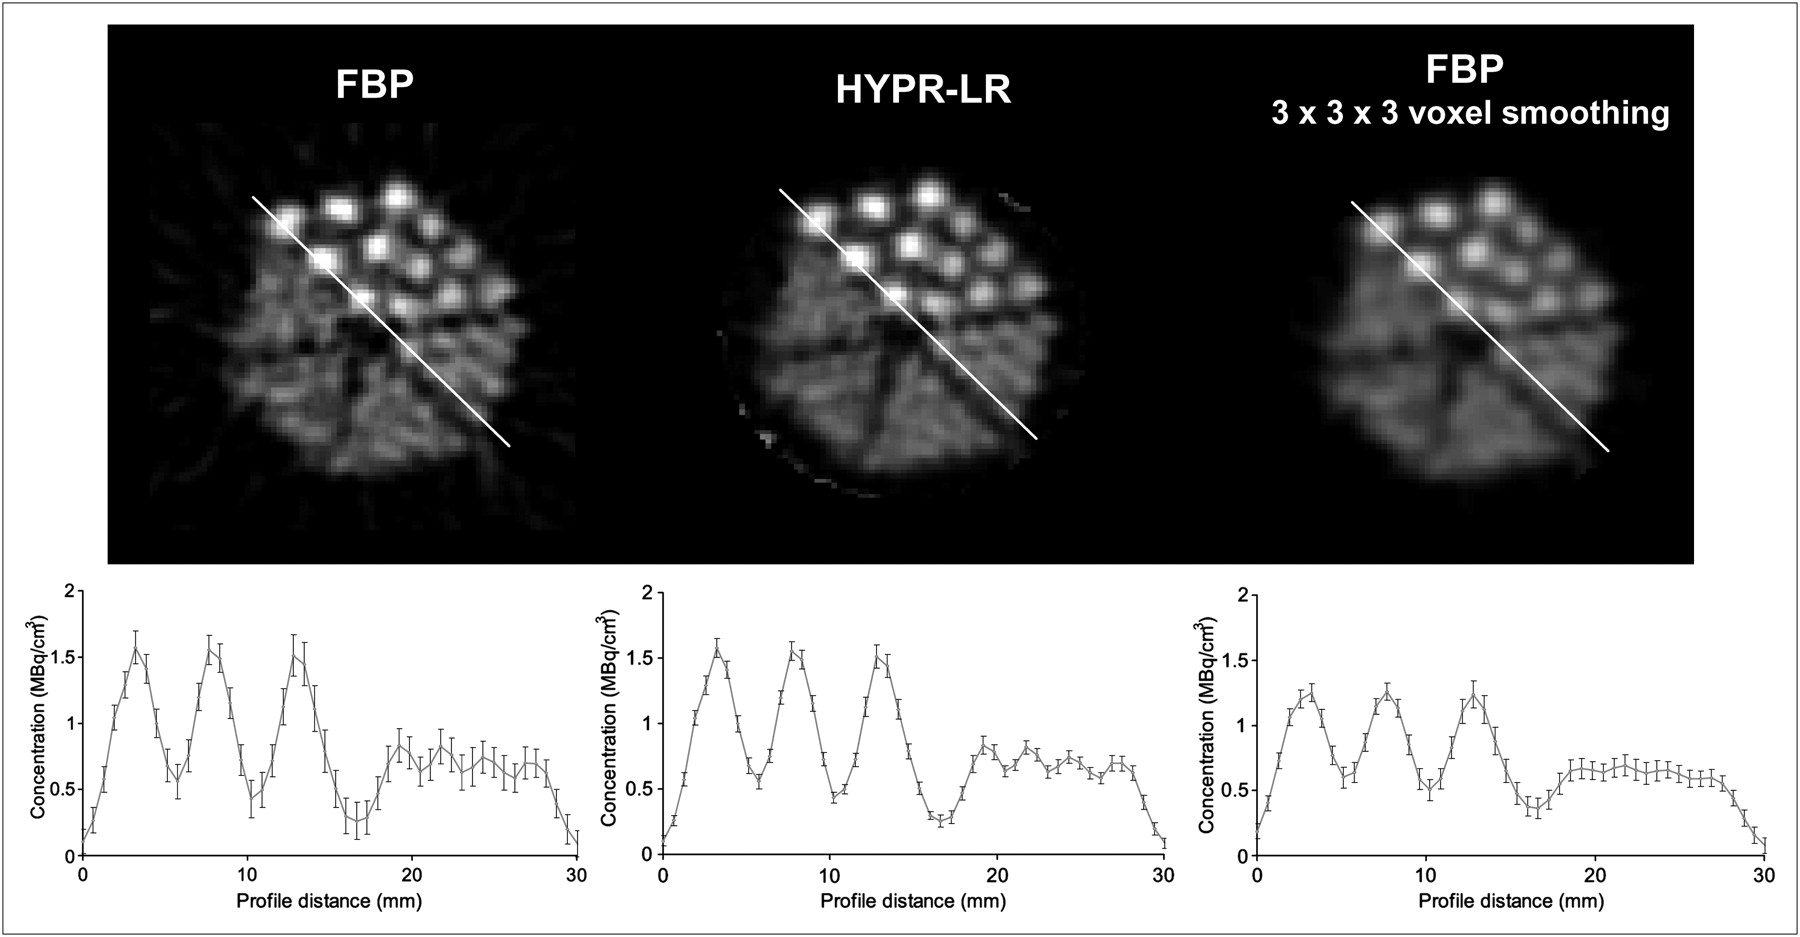
The results of a semiquantitative comparison of the miniature Derenzo phantom are shown in Figure 2 for the HYPR-LR image using a 3.78 × 3.78 × 3.63 mm (3 × 3 × 3 voxels) 3D boxcar smoothing filter. Averaged over the sixty 1-min frames, the mean concentrations at each voxel along the profile are in close agreement, with a mean difference in measured concentration of less than 0.2% between the FBP and HYPR-LR data. However, the mean coefficient of variation (COV) (SD/mean) is significantly less in the HYPR-LR data, with a COV FBP of 22% and a COV HYPR of 9% (P < 0.00002), suggesting a more than 2-fold improvement in SNR. A profile of 1 voxel (width, 1.26 mm) was used for the data in Figure 2. Also shown (far right column) are the results of postprocessing with just the smoothing filter (F). This processing yields a reduced variability, with smooth COV of 13%, but is accompanied by the inability to resolve the 1.5-mm regions and reduced activity recovery in the 2.5-mm regions.

HYPR-LR processing of small-animal PET images of miniature Derenzo phantom. Transaxial slices of 1-min frames for FBP, HYPR-LR processing, and 3.78 × 3.78 × 3.63 mm (3 × 3 × 3 voxels) 3D boxcar smoothing of FBP image are displayed on top. Profiles (as shown on the images) plotting mean and SD of 1-min frames over entire 60-min study are shown on bottom. All images are shown using same window and threshold.
The accuracy of the parameter estimates was examined using a phantom with 2 radioactive sources of different decay constants. The FBP-reconstructed and HYPR-LR–processed images using 1-min time frames are shown in Figure 3. HYPR-LR processing was performed using a 3.78 × 3.78 × 3.63 mm (3 × 3 × 3 voxels) 3D boxcar spatial filter (F) on the composite and dynamic images. Volumes of 1,274 voxels (2.4 cm3) were selected from the regions within the 11C and 18F volumes. The decay constants were compared by regionwise (averaged over all voxels) and voxelwise analysis. Figure 4A displays the regionwise time–activity curves. The decay constants from these time–activity curves were estimated using a nonlinear least-squares fit to the equation C(t) = Coe−λt, for the parameters of starting concentration (Co) and radionuclide decay constant (λ = ln(2)/t1/2), with the results shown in Table 1. For the 11C region, both the FBP and HYPR-LR processing yielded similar values within the true range of the decay constant. For the 18F region, there was little difference between the FBP and HYPR-LR estimates, regardless of spatial filtering in the HYPR-LR processing. The 2%−6% underestimation from the theoretic value is attributable to using only 40 min of data to estimate this rate constant with a 110-min half-life.
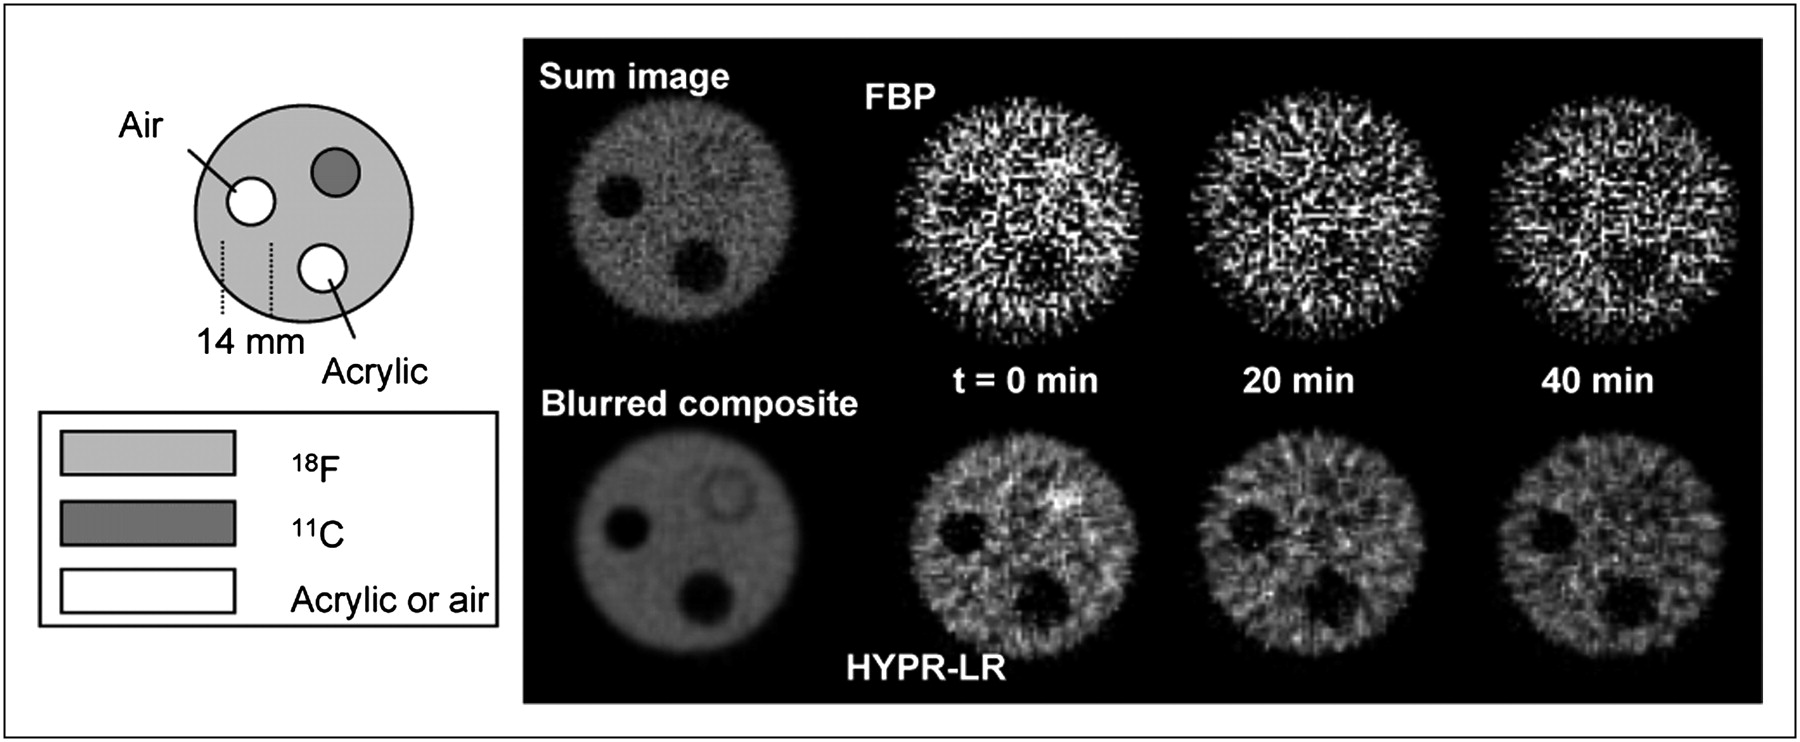
HYPR-LR processing of images of multiradionuclide phantom. Cylindric volume is filled with 11C (t1/2, 20.4 min), and surrounding volume contains 18F (t1/2, 110 min). Total summed image (0–40 min) and FBP-reconstructed images of 1-min frames at 0, 20, and 40 min are shown on top. Blurred composite (sum) image and 1-min frames of data processed with HYPR-LR using 3.78 × 3.78 × 3.63 mm (3 × 3 × 3 voxels) 3D boxcar filter are shown on bottom. All images are scaled to maximum intensity of 37 kBq/mL.
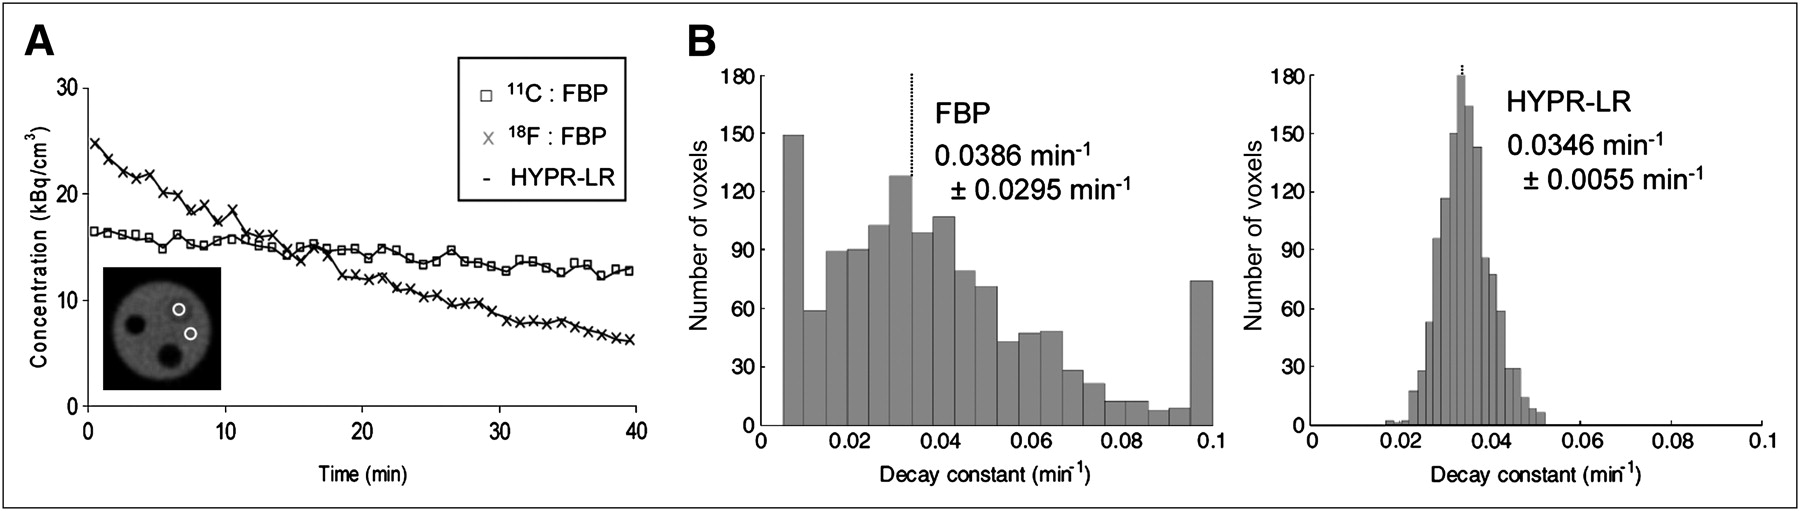
Quantitative accuracy of HYPR-LR processing. (A) Regionwise analysis: graph displays time–activity curves of volume containing 1,274 voxels (2.4 cm3) centered over 11C and 18F areas. When averaged over entire volume, time–activity curves are almost identical for FBP data and HYPR-LR data. (B) Voxelwise analysis: results of voxel-based analysis of measured decay constants from 11C region. HYPR-LR processing was performed using 3.78 × 3.78 × 3.63 mm (3 × 3 × 3 voxels) 3D boxcar filter. Values on each graph indicate mean ± SD for each distribution. Decay constant for 11C is 0.034 min−1.
ROI Estimates of Decay Constant (min−1)
ROI Estimates of Decay Constant (min−1) (Table 1)
The decay constants were also estimated from the time–activity curve of each voxel within this region. The distributions of the voxel-based decay constant estimates are shown in Figure 4B. For the native FBP image set, approximately 14% of the voxels yielded estimates with low or negative decay constants (<0.005 min−1) or high constants (>0.1 min−1) because of the high levels of noise in these time–activity curves. The outliers were not included in the estimation of the mean of λ for the FBP data. The parameter estimates agreed closely with the known decay rates and yielded a reduced COV (SD/mean), compared with the FBP processing (15% vs. 76%, respectively), using the HYPR-LR processing. Increased spatial filtering of the weighting image was investigated, and a reduction in the variance in the distribution of parameter estimates was found (P < 0.0001 for all HYPR-LR data); however, this was at the cost of increased bias due to the mixing of signal from the 18F background region (Supplemental Fig. 1; supplemental materials are available online only at http://jnm.snmjournals.org).
To examine the effects of rapidly changing temporal kinetics under experimental conditions, HYPR-LR processing was performed on a PET neuroligand study having kinetics that were dramatically altered mid scan. A time–activity curve of the data is shown in Figure 5. For a voxel ROI placed in the high-uptake region of the striatum, reduced noise is present in the HYPR-LR processed data, with no apparent bias between methods in the time–activity curves. For this study, the composite image consisted of the entire 160 min of the study, including the period of washout at approximately 80 min, which is dominated by the dissociation constant koff rate of fallypride (∼0.025 min−1) (23).

HYPR-LR processing in study with rapid changes in PET signal. PET images represent single 2-min time frame (at 28 min after injection) of 18F-fallypride in brain of rhesus monkey. This PET study consisted of 3 injections with radiolabeled and unlabeled fallypride at 0 (168 MBq, 4.2 nmol), 20 (189 MBq, 10.3 nmol), and 80 min (0 MBq, 100 nmol), as indicated by arrows in graph. Graph represents time–activity curves from 4-voxel ROI with high and low radiotracer uptake, indicated by circles in bottom image.
Figure 6 displays a comparison of 15O-water in the human brain to illustrate the effects of images with high levels of noise. A single composite image was used for HYPR-LR processing of this study, and the individual frames were spatially filtered with a 16.4 × 16.4 × 17.0 mm (7 × 7 × 4 voxels) 3D boxcar filter. The time course of the radiotracer entering this transaxial slice can be seen in the large ROI time–activity curve in the graph on the left in Supplemental Figure 2. This plot illustrates that for regions containing significant spatial averaging, the SNR in the native FBP data and HYPR-LR processed data is almost equivalent. However, in the extreme case of a single voxel, the denoising properties of HYPR-LR processing are profound, as seen in Figure 6. In this limit, the SNR of each individual time point (for a single voxel) is strongly dependent on the SNR from the composite image, which is created by integrating the entire study (after the arrival of the radiotracer).
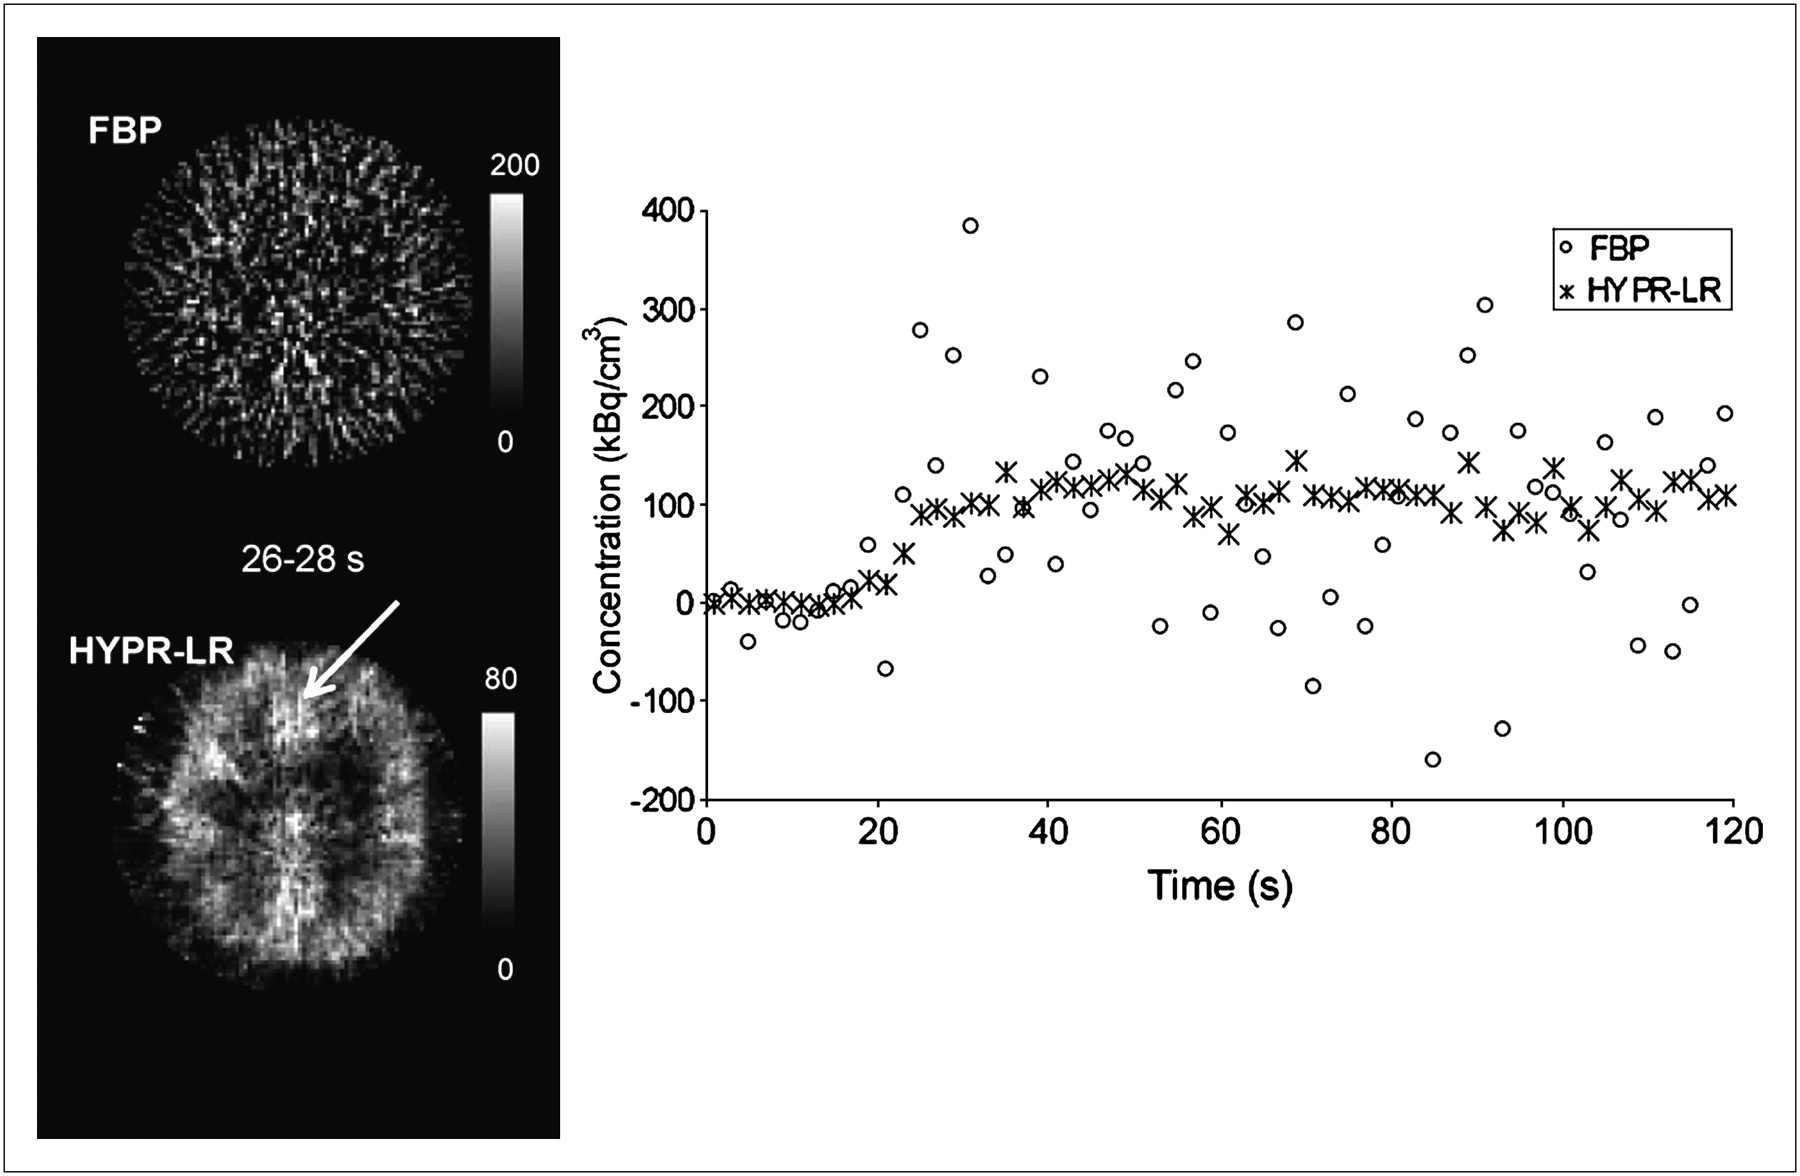
HYPR-LR processing of 15O-water consisting of 60 frames with duration of 2 s each. Top image contains single 2-s frame of data from 26 to 28 s. Bottom image contains matching frame after HYPR-LR processing 16.4 × 16.4 × 17.0 mm (7 × 7 × 4 voxels) 3D boxcar filter. Color bars are in units of kBq/mL. Graph illustrates time–activity curve of single voxel in region of arrow. (Supplemental Fig. 3 provides multiple images of time course.)
DISCUSSION
In this work, we have presented HYPR-LR processing in the context of dynamic PET as a tool for denoising individual time frames. The primary advantage of HYPR-LR postprocessing lies in its ease of implementation and fast processing time (approximately seconds per frame using a personal computer with a Pentium P4 [Intel] processor). To evaluate the accuracy of HYPR-LR processing and to examine the potential limits of the algorithm for yielding quantitative results, we chose a series of phantom, animal, and human studies with varying levels of noise and temporal kinetics. We have not attempted to characterize a fixed metric for SNR improvement because this is highly dependent on the SNR in the composite image and the original images, which is dependent on the choice of time frame duration.
With HYPR-LR processing, the SNR of each time frame is primarily determined by the SNR in the composite image and the number of nonzero elements in the filtering function, F (18). The miniature Derenzo phantom was used to illustrate the improvement in SNR and preservation of resolution as determined by the composite image. Figure 2 demonstrates that the widths from the profiles, which are indicative of system resolution, are unchanged in the 2 image sets of FBP and HYPR-LR. Because the entire 60-min image was used as the composite, this image largely determines the SNR and spatial resolution of the radioactivity distribution. The mean concentrations for the FBP and HYPR-LR data are almost equal, never exceeding a 2% difference between the methods and having a 0.15% mean difference over the entire profile. However, the variance of each point along the profile is reduced for the HYPR-LR data, yielding an improvement factor of 2.4 in SNR. Figure 2 illustrates that the variance at each point is also reduced using just the smoothing filter (by a factor of 1.7); however, this reduction is at the cost of reduced spatial resolution as seen by the inability to resolve the 1.5-mm-diameter holes.
A multiradionuclide phantom was used to simulate a setting with varying kinetics over the course of a time series. Because the entire time series was used as the composite image (Fig. 3), the region with the 11C activity appears to have concentration approximately equal to the surrounding 18F background activity. A range of spatial filters (F) was applied to the composite and individual time frames to investigate bias in the measured signal. The effects of this spatial filtering were examined on both region-based and voxel-based time–activity curves. Increased spatial filtering produces significant improvements in SNR, which in turn reduces the variance in the distribution of voxel decay constants. However, the excessive blurring in the signal from the surrounding regions introduces a bias in the decay constant outcome parameter (Supplemental Fig. 1). A bias of 21% was observed for 12.6 × 12.6 mm (10 × 10 voxels) 2D filtering and reduced to less than 2% for both 5.04 × 5.04 mm (4 × 4 voxels) 2D and 3.78 × 3.78 × 3.63 mm (3 × 3 × 3 voxels) 3D filtering, which is well within the experimental error of PET measurements. These resolution effects were discussed for MRI applications by Johnson et al. (18) for considerations of filter size selection. As a general guideline, the effects of excessive blurring can be suppressed by choosing a filter that is approximately half the diameter of the object of interest.
Although HYPR-LR processing capitalizes on the spatiotemporal correlation existing in a PET time series, there is little temporal correlation introduced into the time series from HYPR-LR processing. The composite image contains information from all frames in a dynamic scan, but the noise components of each frame will be largely uncorrelated because of the long signal in the composite image with respect to the independent frames. Each time frame is calculated as the product of the composite (total sum) and a weighting matrix (Eq. 2), which contains only spatial smoothing. The time–activity curves from the multiple-injection study (Fig. 5) do not suggest that a temporal correlation was introduced in the HYPR-LR data. For example, the use of a moving average (time series) filter would tend to smooth out the transitions during the injections at 20 and 80 min. Such trends were not observed in this dataset, which used the entire time series as the composite image.
Though we foresee several applications for which dynamic PET would benefit from HYPR-LR processing, we believe the greatest potential will be to improve quantitative PET for voxel-based analysis. For example, the Logan reference region method (24) is one of the most widely used schemes for the analysis of reversibly bound radiotracers; however, this method has been shown to demonstrate a negative bias in distribution volume ratio estimation with increasing levels of noise (25–28). This bias is due to the high correlation of noise in the independent and dependent variables, which are calculated directly from the PET data, and result in an underestimation of distribution volume ratio in the (higher noise) voxel-based estimates. Thus, for voxel-based comparisons of small regions, HYPR-LR processing holds the potential to enhance disease detection sensitivity or reduce subject sample size by improving parameter estimation accuracy. For example, the use of the Logan reference region method has been validated for the amyloid-binding radiotracer 11C-Pittsburgh compound B (29), which is being used to discriminate between subjects with Alzheimer disease and healthy controls in the Alzheimer Disease Neuroimaging Initiative multicenter trial, and HYPR-LR may enhance the sensitivity of studies with this radiotracer. A similar application is presented with the 15O-water study. Although cerebral perfusion (or oxygen metabolism) estimation with HYPR-LR processing will not be improved with analysis techniques that integrate the entire PET time course—for example, a count-based method (30)—HYPR-LR processing does open up opportunities for improving the sensitivity using other voxel-based methods of analysis.
Other examples include studies with 11C-WAY100635, in which injections are limited to 260 MBq (31) but scans in excess of 90 are required, and research protocols involving children, for whom only 10% of the radiation dose of comparable adult studies is allowed. Similarly, PET methods that rely on the measurement of subtle changes in the dynamic PET signal for detecting neurotransmitter release in small regions (32–37) may benefit profoundly from HYPR-LR denoising. Most important, as data acquisition systems for PET continue to improve, it may be possible to develop clinical applications that rely on visual image (or time series) interpretation (2), which benefits significantly from HYPR-LR processing.
CONCLUSION
In this work, we presented the application of HYPR-LR for denoising PET data for time series analysis. This method has potential applications in imaging protocols with an inherently low SNR that is due either to an extended dynamic acquisition duration or a low radiation dose.
Acknowledgments
We thank Drs. Miguel Alivia-Rodriguez (UNAM) and John Nye (Emory University) for the use of the phantom, Dr. Alex Converse and Elizabeth Ahlers for technical assistance with the microPET scanner, Barb Mueller for the acquisition of the human PET studies, and Dr. Dana Tudorascu for technical discussions. This study was presented in part at the 54th annual Society of Nuclear Medicine Meeting, Washington, DC, June 2007.
Footnotes
-
COPYRIGHT © 2010 by the Society of Nuclear Medicine, Inc.
References
- Received for publication December 16, 2009.
- Accepted for publication March 4, 2010.


Jump to section
Related Articles
Cited By...
- Modeling PET Data Acquired During Nonsteady Conditions: What If Brain Conditions Change During the Scan?
- Optimal filtering strategies for task-specific functional PET imaging
- Longitudinal Tau PET Using 18F-Flortaucipir: The Effect of Relative Cerebral Blood Flow on Quantitative and Semiquantitative Parameters
- Detection of transient neurotransmitter response using personalized neural networks
- Denoising of Scintillation Camera Images Using a Deep Convolutional Neural Network: A Monte Carlo Simulation Approach
- In vivo characterization and quantification of neurofibrillary tau PET radioligand [18F]MK-6240 in humans from Alzheimers disease dementia to young controls
- In Vivo Characterization and Quantification of Neurofibrillary Tau PET Radioligand 18F-MK-6240 in Humans from Alzheimer Disease Dementia to Young Controls
- In Vivo Comparison of Tau Radioligands 18F-THK-5351 and 18F-THK-5317
- Sex Differences in the Brain's Dopamine Signature of Cigarette Smoking
- Advanced Cardiovascular Magnetic Resonance Myocardial Perfusion Imaging: High-Spatial Resolution Versus 3-Dimensional Whole-Heart Coverage
- PET Imaging of {alpha}4{beta}2* Nicotinic Acetylcholine Receptors: Quantitative Analysis of 18F-Nifene Kinetics in the Nonhuman Primate