


Abstract
This study compared the in vivo imaging characteristics of tau PET ligands 18F-THK-5351 and 18F-THK-5317 in the context of Alzheimer disease (AD). Additionally, reference tissue distribution volume ratio (DVR) estimation methods and SUV ratio (SUVR) timing windows were evaluated to determine the optimal strategy for specific binding quantification. Methods: Twenty-eight subjects (mean age ± SD, 71 ± 7 y) underwent either dynamic 90-min 18F-THK-5317 or 18F-THK-5351 PET scans. Bland–Altman plots were used to compare the simplified reference tissue method, multilinear reference tissue method (MRTM2), and Logan reference tissue DVR estimates and to assess temporal stability of SUVR windows using cerebellar gray matter as a reference region. In vivo kinetics and DVR estimates were directly compared for 10 subjects who underwent both 18F-THK-5317 and 18F-THK-5351 PET scans. Results: THK-5351 exhibited faster cerebellar gray matter clearance, faster cortical white matter clearance, and higher DVR estimates in AD tau-associated regions of interest than THK-5317. The MRTM2 method produced the most reliable DVR estimates for both tracers, particularly when scan duration was shortened to 60 min. SUVR stability was observed 50–70 min after injection for both tracers. Parametric images revealed differences between MRTM2, Logan, and SUVR binding in white matter regions for THK-5317. Conclusion: THK-5317 and THK-5351 show promise for in vivo detection of AD tau. THK-5351 has more favorable pharmacokinetics and imaging characteristics than THK-5317.
Alzheimer disease (AD) is characterized by the aggregation of β-amyloid (Aβ) and abnormally phosphorylated tau proteins along with neurodegeneration and cognitive impairment (1). Pathologic Aβ and neurofibrillary tau deposits follow distinct hierarchical spatial patterns in AD (1,2). In a study of 2,332 cases, more than 80% of individuals between the ages of 51 and 60 y indicated accumulations of neurofibrillary tau in Braak stages I–II or higher, which increased to more than 90% for ages 61–70 y (3). Neurofibrillary tau deposition, but not Aβ plaque deposition, is suggested to correlate with cognitive symptoms later in AD, and is a potential target for diagnosing disease and monitoring disease progression (4–6). Multimodal imaging has the potential for detecting and characterizing AD-related pathologic changes. In particular, studies following individuals during the presymptomatic phase of AD as they progress to dementia have the potential for identifying AD-specific patterns versus those of normal aging (7–10). Additionally, the presymptomatic phase of AD is thought to be an opportunistic window for disease intervention.
Following the success of amyloid PET, radioligands are being investigated for pathologic tau imaging (11–14). The THK series developed by investigators at Tohoku University have the potential for in vivo detection of AD tau. In vitro studies indicate that THK-5117 has affinity for tau over Aβ and binding patterns consistent with AD tau deposits using autoradiography (11,15,16). THK-5117 also demonstrates binding in other non-AD tauopathies (17), THK-5117 binds to the combination of 3R and 4R isoforms found in paired helical filaments, and is sensitive to β-sheet disruption (15). THK-5117 is a racemic mixture, which could preclude accurate in vivo quantification. Although both enantiomers show similar spatial distributions in autoradiography, S-enantiomers of THK compounds display higher affinity for human AD tau and more favorable in vivo kinetics in rodents (18). PET imaging of 18F-THK-5317 (aka 18F-(S)THK-5117) with arterial blood sampling in subjects with mild cognitive impairment (MCI) and AD demonstrates favorable in vivo kinetics and concordance with a 2-tissue-compartment model (19). Binding estimates using reference tissue methods (simplified reference tissue method [SRTM] (20), SRTM2 (21), and Logan (22)) demonstrated agreement with arterial-based measures. Both THK-5117 and THK-5317 show high nonspecific white matter (WM) binding, which may limit accurate quantification in adjacent gray matter (GM) regions and visual assessment in clinical applications (13,19,23). Cross-sectional and longitudinal studies demonstrate the utility of THK-5117 and THK-5317 for monitoring the in vivo spatial distribution of AD tau and the usefulness of a multimodal imaging paradigm (23,24).
THK-5351, the antecessor to THK-5117, is chemically similar to the optically pure THK-5317 (13). The substitution of a pyridine for benzene at the 2-aryl group decreased the lipophilicity of the molecule (Log P = 1.5 vs. 2.3) in an effort to reduce nonspecific WM binding. In vitro and in vivo study of THK-5351 is consistent with THK-5117 in selectivity for AD tau over other amyloids and yielded a higher affinity for AD tau than THK-5117 (13). Investigation of THK-5351 binding with non-AD tauopathies is ongoing (25). In vivo comparison in 2 AD subjects indicates THK-5351 has reduced WM binding, lower brain uptake, and slightly faster GM kinetics than THK-5117. A recent study suggests Logan analysis using 60 min of dynamic data and SUV ratio (SUVR) (40–60 min after injection) are suitable for binding estimation of THK-5351 (26). Currently, there are few studies characterizing in vivo quantification methods for THK-5351, and a comparison of optically pure THK-5317 and THK-5351 is needed in individuals ranging from nondemented to probable AD. The aims of the current study were to perform a comparison of reference tissue methods for specific binding estimation of both THK-5317 and THK-5351 and to compare their imaging properties in individuals ranging from cognitively stable to probable AD.
MATERIALS AND METHODS
Recruiting and Cohort Summary
Participants (n = 28) were recruited from the University of Wisconsin Alzheimer Disease Research Center (those with MCI or probable AD) or from the Wisconsin Registry for Alzheimer Prevention study (participants from a late-middle-aged cohort enriched for AD risk factors) (10). The sample consisted of 18 apolipoprotein-ε4 carriers and 15 individuals with parental history of AD (Supplemental Table 1; supplemental materials are available at http://jnm.snmjournals.org). Participants were aged 53–85 y (mean age ± SD, 71 ± 7 y) and ranged from cognitively stable to frank dementia. At-risk individuals were grouped as cognitively stable (n = 9) or cognitively declining (n = 10) based on longitudinal neuropsychologic evaluation (27). Amnestic MCI (n = 3) and probable AD (n = 6) groups were classified on the basis of consensus diagnosis at the annual evaluation closest to scanning before the availability of tau and Aβ biomarker data. Fourteen subjects indicated elevated Aβ (using 11C-Pittsburgh compound B [PiB]), and 14 did not. This study was approved by the Institutional Review Board, and signature of written informed consent was obtained for all participants. 18F-THK-5351 and 11C-PiB PET scans were obtained under Food and Drug Administration–approved investigational new drug applications and 18F-THK-5317 under the Radioactive Drug Research Committee (RDRC) program.
Imaging Protocol
T1-Weighted MRI
All study participants underwent MRI using a 3.0-T SIGNA 750 scanner (GE Healthcare UK) with an 8- or 32-channel head coil. T1-weighted anatomic data were acquired in the transverse or sagittal plane using a 3-dimensional inversion recovery fast spoiled gradient-echo sequence (inversion time, 450 ms; repetition time, 8.1 ms; echo time, 3.2 ms; flip angle, 12°; matrix, 256 × 256 × 156; voxel dimensions, 1 × 1 × 1 mm; field of view, 256 mm; slice thickness, 1.0 mm).
Radiotracer Synthesis
18F-labeled THK-5317 and THK-5351 were synthesized similarly to previously described methods (13,15), however, the methods were modified to improve purification. Briefly, 18F was produced on a PETtrace (GE Healthcare). 18F-THK-5317 was synthesized using an automated chemistry module (Explora FDG4; Siemens Healthcare) by performing azeotropic distillation of the 18F solution, nucleophilic substitution of tosylate precursor (S)-2-(4-methylaminophenyl)-6-[[2-(tetrahydro-2H-pyran-2-yloxy)-3-tosyloxy]propoxy]quinolone ((S)THK-5119-2; Tohoku University) for 10 min at 110°C, and deprotection of the hydroxyl protecting group for 3 min at 110°C. Crude reaction product was purified by semipreparative high-performance liquid chromatography (Intersil ODS-4 5μ 250 × 10 mm [GL Sciences, Inc.], 60/40 20 mM NaH2PO4/CH3CN), and residual organic solvents were removed. Product was diluted in 10 mL of 10% EtOH/saline solution and passed through a 0.22-μm sterile filter. 18F-THK-5351 was synthesized similarly to 18F-THK-5317 except for semipreparative high-performance liquid chromatography purification (Luna 10μ 250 × 10 mm [Phenomenex], 78/22 20 mM NaH2PO4/CH3CN).
PET Imaging
Participants underwent 18F-THK-5317 (n = 14) or 18F-THK-5351 (n = 24) PET scans. A subset of 10 subjects (5 stable, 4 declining, 1 MCI; age, 69 ± 8 y; age range, 53–81 y) were scanned with both THK radiotracers with an average of 321 ± 46 d between scans. PET scans were acquired on an ECAT EXACT HR+ (Siemens Healthcare) in 3-dimensional mode. A 6-min 68Ge/68Ga transmission scan was obtained, followed by a dynamic 90-min emission scan (5 × 2 min/fr, 16 × 5 min/fr) initiated with a bolus injection (20–30 s) in the antecubital vein of a 185-MBq target dose for 18F-THK-5317 and a 185- or 370-MBq target dose for 18F-THK-5351. PET images were reconstructed using filtered backprojection (matrix size, 128 × 128 × 63; voxel dimensions, 2.57 × 2.54 × 2.43 mm), with corrections applied for normalization, detection deadtime, attenuation, and radioactive decay. Dynamic 11C-PiB PET scans were also acquired and used to determine the amyloid status of the subjects (Supplemental Table 1).
Image Processing and Data Extraction
The reconstructed PET time series images were presmoothed with a 3-mm isotropic gaussian kernel, realigned for interframe motion (SPM12; www.fil.ion.ucl.ac.uk/spm), denoised using highly constrained backprojection-local reconstruction-full composite (HYPR-LR-FC) (9-mm isotropic gaussian composite smoothing) (28), and coregistered to the T1-weighted MR image (SPM12). HYPR-LR is a spatial resolution preserving, temporal smoothing algorithm that has been shown to minimize noise-dependent Logan bias and reduce variance of parametric distribution volume ratio (DVR) images (28,29). Time–activity curves were extracted from the coregistered dynamic PET data.
Region-of-interest (ROI) segmentation of the T1-weighted MR image was performed using FreeSurfer 5.3 (http://surfer.nmr.mgh.harvard.edu/). FreeSurfer-defined cerebellar GM and cerebral WM masks were eroded to limit spillover from adjacent regions by smoothing binarized FreeSurfer ROIs with an isotropic 8-mm gaussian kernel (to simulate PET resolution) and thresholding out values below 0.6 for cerebellar GM and 0.95 for cerebral WM. Thresholds were selected on the basis of apparent spillover of summed PET images. Nine a priori regions were selected for analysis based on previously reported regions affected by AD tau in vivo (1,23,24,30,31). Regions included the entorhinal cortex; hippocampus; parahippocampus; fusiform gyrus; inferior, middle, and superior temporal gyrus; inferior parietal cortex; and the peristriate region of the occipital cortex. With the exception of WM and cerebellar GM, ROIs were split unilaterally.
Estimation of Tracer Specific Binding Using Reference Tissue Methods
Several reference tissue methods have been developed for estimation of specific tracer binding for reversible ligands in neuroligand PET applications (20–22,32–35). For these methods, parameters are estimated to determine either the DVR (ratio of the specific [Vs] and nondisplaceable [VND] distribution volumes) or the in vivo binding potential (BPND). which are related by the following:  (36). The DVR and BPND are proportional to the ligand–receptor affinity (1/KD) and the maximum receptor availability. Cerebellar GM is thought to be devoid of neurofibrillary tau in AD (37) and was previously validated as a reference region of negligible specific binding with in vitro binding assays of THK-5117 and T807 (AV1451) (16,38). DVR estimates were calculated by applying the Logan reference region graphical method (22), the multilinear reference tissue method (MRTM2) (35), and the basis function implementation of the SRTM (20) to ROI time–activity curves with cerebellar GM as a reference region (22,35,39). For the Logan and MRTM2 methods, time of linearization (t*) was evaluated by comparison of within-method differences using t* = 10, 20, 30, 40, 50, and 60 min, and the average of MRTM2 and SRTM k2′ estimates (for Logan). SRTM was implemented by generating 200 basis functions using θ3 = 0.001–0.2 min−1 in 0.001 min−1 increments. The effect of shortening scan duration was evaluated by comparing 50-, 60-, and 70-min derived DVR estimates with 90-min derived DVR estimates. In addition to dynamic methods, the SUVR was determined using 20-min windows starting at 10–70 min after injection in 10-min intervals to assess the temporal stability over the 90-min time course. Parametric DVR and SUVR images were generated for visual comparison of THK-5351 and THK-5317.
Comparison of Binding Estimates
Within- and between-method differences in DVR (or SUVR) were assessed using a Bland–Altman approach and by calculating the mean and SD of DVR differences across all subjects and analyzed ROIs. Bland–Altman plots, as opposed to regression/correlation analysis, have an advantage in the context of DVR and SUVR comparison because effects related to the magnitude of binding and noise can be more easily identified (40,41). For example, plotting the differences in DVR between successive t* values as a function of binding for Logan or MRTM2 can aid in identifying stability of DVR estimates when higher binding regions generally have slower equilibrium (later t*).
RESULTS
Comparison of THK-5317 and THK-5351 In Vivo Kinetics
Summary statistics for the radiosyntheses of THK-5317 and THK-5351 are presented in Table 1. Figure 1 compares the dynamic SUV and target–to–cerebellar GM ratios averaged across the 10 subjects who underwent both 18F-THK-5351 and 18F-THK-5317 PET scans. SUV was lower for THK-5351 in all regions. THK-5351 had slightly faster clearance after bolus passage for cerebellar GM and faster clearance for cortical WM. WM-to-cerebellum ratios were higher for THK-5351 from 0 to 30 min and peaked at 45–50 min, after which ratios declined, whereas for THK-5317, WM-to-cerebellum ratios were greater than those for THK-5351 after 35 min and increased throughout the entire scan. Target-to-cerebellum ratios for high-binding regions associated with neurofibrillary tau were observed to plateau later than regions with low or negligible binding for both tracers.
Radiosynthesis Results for 18F-THK-5317 and 18F-THK-5351 Displayed as Mean ± SD
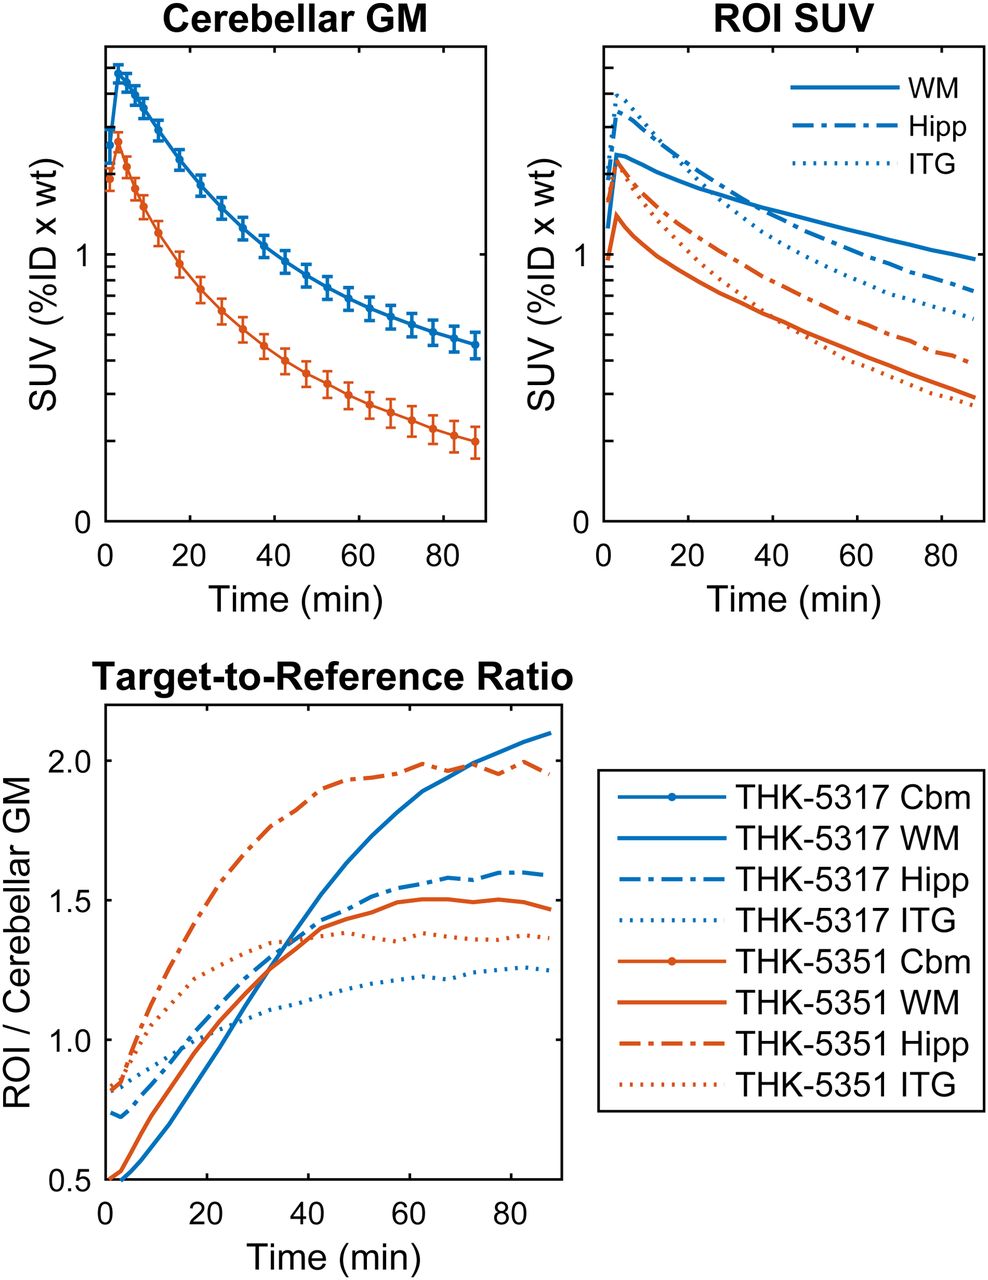
Mean SUVs and target–to–cerebellar GM plots comparing THK-5317 and THK-5351. Error bars represent 95% confidence interval across 10 subjects scanned with both tracers. %ID = percentage injected dose; Cbm = cerebellum; Hipp = hippocampus; ITG = inferior temporal gyrus; wt = weight.
Comparison of DVR Estimation Methods
Supplemental Figures 1–3 summarize the effects of t* on DVR for Logan and MRTM2 and the effect of  for Logan. MRTM2 DVR estimates were stable for a t* of 20 min or greater, though the within-method variability was lowest between a t* of 30 and 40 min. Within-method comparisons of Logan DVRs indicated later stability (t* = 40 min), with DVRs derived from a t* of less than 40 min showing an underestimation associated with the level of binding. Logan DVRs were sensitive to combinations of
  and t* (Supplemental Figs. 1 and 2 comparing
  values 0.05–0.15 min−1). Results were consistent for both THK-5351 and THK-5317. Because
  was not derived from arterial data and reference tissue–based k2’ estimates can be unreliable (20), the Logan
  was removed for further comparisons.
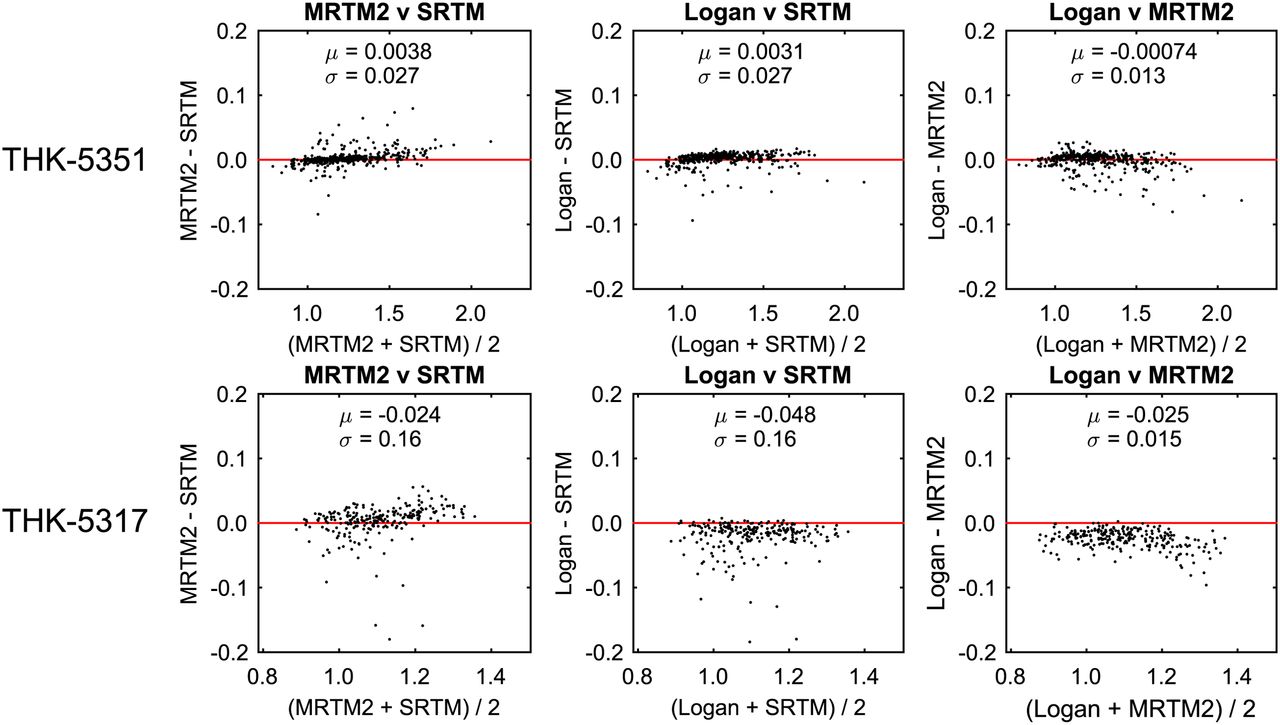
Figure 2 shows the between-method comparison of DVR estimates for Logan (t* = 40 min, no  term), MRTM2 (t* = 30 min), and SRTM. For THK-5351, minimal differences were observed overall between methods, indicated by low mean difference and SD over the range of DVRs. However, for THK-5317 there was less agreement between methods, suggesting Logan underestimated both SRTM and MRTM2. Further, MRTM2 yielded higher values for regions with elevated DVR (>1.2) compared with Logan and SRTM, although MRTM2 and SRTM estimates were otherwise similar. Overall, between-method variability was higher for THK-5317 than THK-5351.

Comparison of DVR estimates for SRTM, MRTM2, and Logan with the mean (μ) and SD (σ) of difference between methods.
Results comparing the effects of scan duration on MRTM2 and Logan methods were similar for both THK tracers and are shown for THK-5351 in Figure 3 and for THK-5317 in Supplemental Figures 4 and 5. MRTM2 estimates using shortened scans were similar to 90-min MRTM2 DVR estimates and did not indicate any trends with increasing DVR, although 50-min scans resulted in noticeably higher variability. Logan estimates underestimated DVR for shorter scan durations (≤60 min), especially at higher DVR values. This underestimation in DVR was still apparent in 70-min scans but was reduced compared with shorter scans. Effects of shortening the PET scan duration for SRTM were similar to Logan (Supplemental Fig. 4).

Comparison of MRTM2 (top) and Logan (bottom) DVR estimates determined with truncated scanning durations compared with full 90-min dataset with t* = 30 min for THK-5351.
Temporal Stability of SUVR
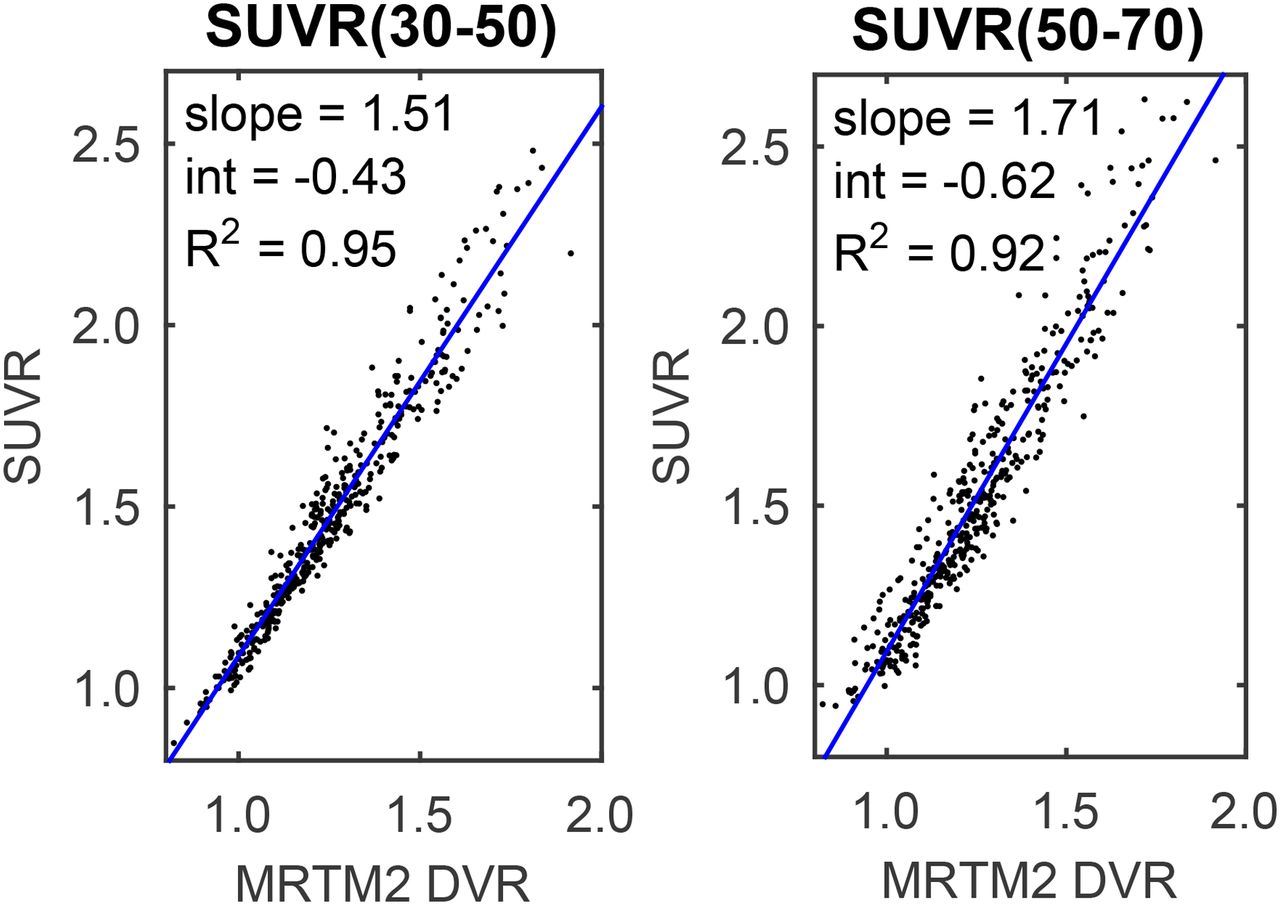
SUVR estimates were temporally stable 50–70 min after injection (Supplemental Figs. 6 and 7). SUVRs for windows earlier than 50–70 min exhibited underestimation in higher binding regions. Regression of SUVR on DVR indicated the best agreement (highest correlation coefficient) for SUVR determined 30–50 min after injection (Fig. 4).

Regression of THK-5351 SUVR on 90-min MRTM2 (t* = 30 min) DVR estimates. DVR SUVR regressions and SUVR stability for other SUVR windows and for THK-5317 are located in Supplemental Figures 6 and 7.
Comparison of Parametric DVR and SUVR Images
Figure 5 illustrates consistency between parametric MRTM2 and Logan DVR images for THK-5351. However, notable differences were observed in WM for THK-5317, with MRTM2 producing higher WM signal. Compared with DVR images, SUVR images (50–70 min) had higher WM signal relative to GM, although for THK-5317, MRTM2 shows greater sensitivity to WM.

Comparison of MRTM2 and Logan DVR and SUVR (50–70 min) parametric images for THK-5351 (top) and THK-5317 (bottom) in 81-y-old man with MCI (Mini–Mental State Examination = 28). THK-5351 (392 MBq) scan was 342 d after THK-5317 (200 MBq).
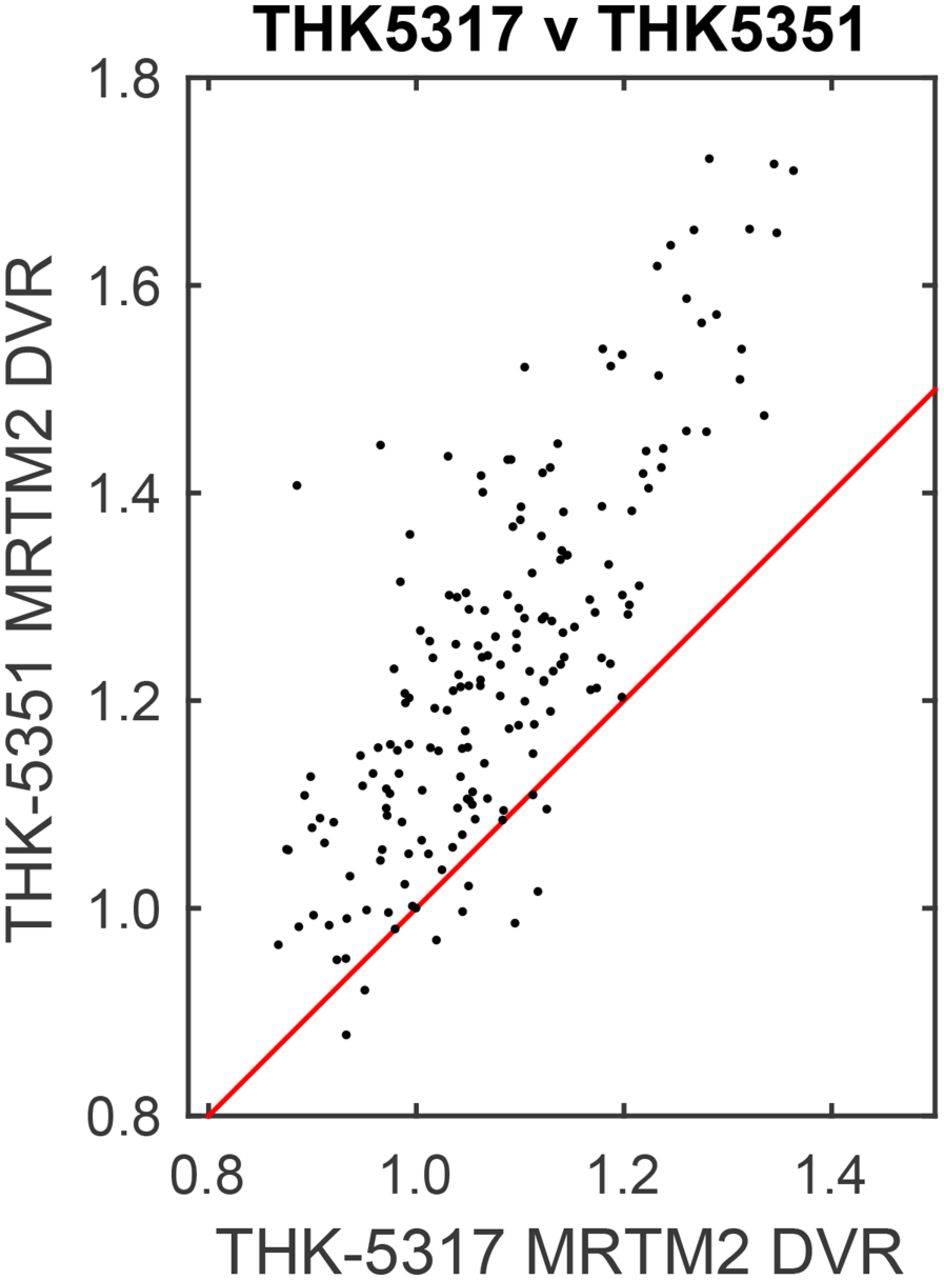
Comparison of THK-5317 and THK-5351 DVR Binding Estimates
General agreement was observed between THK-5317 and THK-5351 in regions associated with tau pathology (Fig. 6; Table 2), with the exception of SRTM, which failed to converge in some ROIs for THK-5317. THK-5351 DVR estimates were higher in GM and lower in WM than were THK-5317 DVR estimates. Adjusting for the time between THK-5351 and THK-5317 scans did not change regression parameters.

Comparison of THK-5317 and THK-5351 DVR estimates using MRTM2 (truncated 60-min data and t* = 30 min).
Summary for Linear Regression of THK-5351 on THK-5317 Binding Estimates
DISCUSSION
The most apparent differences between the THK tracers were associated with whole-brain uptake (blood–brain barrier penetrance), specific GM binding, and nonspecific WM binding. A global reduction in SUV indicates lower brain penetrance for THK-5351, which is consistent with the differences in lipophilicity (logP of THK-5351:THK-5317, 1.5:2.32) (13). WM clearance was faster for THK-5351, in agreement with previously reported results showing slow in vivo WM clearance for THK-5317 (19) and faster in vitro WM dissociation for THK-5351 (13). Higher DVRs for THK-5351 in regions associated with tau pathology is likely attributed to a higher ligand–protein affinity for tau observed with THK-5351 in AD hippocampal homogenates (13,36,42). Though there was a systematic delay between THK-5351 and THK-5317 scans (THK-5351 always occurred after THK-5317), adjusting for time between scans did not change the relationship between tracer binding estimates, and on average THK-5351 GM signal was more than 3-fold higher than the highest annual rate of change reported in a longitudinal study (24). Additionally, significant differences in the injection protocols (THK mass and radioactivity) were observed, but likely did not affect binding quantification based on the apparent KD of the THK compounds. When these differences are considered, THK-5351 provides imaging characteristics superior to THK-5317.
THK-5351 DVR estimates were largely comparable between methods when using the entire 90-min time series. Greater variability was seen for THK-5317, with discrepancies predominantly apparent in WM signal. We speculate that this difference between methods is attributed to the slow clearance in WM relative to the reference region, which could violate assumptions of each method. One of the primary figures of merit for selecting the DVR estimation method is DVR stability with shorter scanning durations, which is desired for aging and cognitively impaired individuals. MRTM2 revealed the least sensitivity to parameter bias and variability for reduced scanning periods of 50, 60, or 70 min, with a marked reduction in variability for 60- and 70-min scans (compared with the 90-min experiment). This suggests that a 60-min scan will be sufficient for THK tracers, although additional investigation may be required for populations with substantial tau pathology. SUVR has also been used with THK compounds to reduce scan duration, with a range of reported timing windows (19,24–26). Our data support the temporal stability of SUVR estimates from 50 to 70 min after injection, although better absolute agreement with DVR is observed for earlier SUVR windows. Earlier SUVR windows are advantageous for THK-5317 because WM–to–cerebellar GM ratios are increasing throughout the 90-min scan. Although 20-min scans appear to be adequate for SUVR analysis and provide the shortest scan duration, variability is lower for DVR methods, making DVR better suited for detecting small changes in longitudinal applications.
Although only a small sample of MCI and AD subjects were included in these analyses, this does not necessarily limit our results to subjects (and ROIs) with low-to-moderate binding. Neuropathology studies have indicated that individuals showing accumulation of tau pathology in Braak regions I–IV represent more than 78% of population aged 51–70 y (3). This age range is similar to individuals in this study, and we anticipated seeing elevated PET signal in these early Braak regions regardless of disease state. In addition, a goal of this study was to determine whether THK tracers would produce target signal consistent with neuropathology in middle- to late-aged individuals who are likely to express early tau pathology. This would support the use of these PET biomarkers for the detection of tau pathology during the suspected presymptomatic phase of AD, which is a central focus of our ongoing longitudinal studies. In this regard, THK-5351 outperforms THK-5317 for detection of early tau based on higher target-to-reference signal, lower WM binding, and higher DVR estimates particularly in early Braak regions.
Though the primary goal of this work was to compare imaging characteristics of THK compounds and methods for specific binding, it is also important to include general observations on patterns of binding in the brain, focusing primarily on THK-5351. General agreement was observed between the spatial distribution of THK-5351 binding and neuropathologic spatial hierarchy of tau, although high hippocampal binding was observed in the absence of elevated entorhinal binding in some subjects. Beyond regions associated with tau pathology, high suspected off-target binding was observed in all subjects (Fig. 5), including cognitively stable individuals in their mid-50s, in the thalamus, striatum, substantia nigra, and periaqueductal GM. This binding is similar to reports of suspected off-target binding for tau PET ligand T807, which has been proposed to bind to monoamine oxidase-A and neuromelanin, albeit with a wide range of reported affinities for these binding sites in the literature (12,14,30,38). Further characterization of tau ligand binding profiles including arterial blood sampling and postmortem correlates is needed to determine the potential limitations to detect AD tau in vivo. However, despite potential off-target binding in subcortical structures, preliminary concordance of THK-5351 binding patterns with neuropathology in neocortical areas observed in this study indicates promise for its use in assessing AD tau pathology in later Braak stages.
CONCLUSION
18F-THK-5351 provides favorable in vivo imaging characteristics for the detection of AD tau pathology across a wide range of age and cognitive status including middle-aged cognitively stable individuals. MRTM2 produced reliable DVR estimates for THK-5351 using 60 min of dynamic PET data. Continued characterization of tau PET ligands including identification of potential off-target binding sites is needed to fully understand the distribution of spatial binding patterns throughout the entire brain as they relate to AD pathology.
DISCLOSURE
Support was provided by National Institutes of Health R01 AG021155, National Institutes of Health R01 AG027161, Alzheimer’s Disease Research Center P50 AG033514, National Institute on Child Health and Human Development P30 HD03352, and the National Cancer Institute of the National Institutes of Health under award no. T32 CA009206. Nobuyuki Okamura and Shozo Furumoto received a grant from GE Healthcare to study tau PET imaging. THK compounds are licensed to GE Healthcare. No other potential conflict of interest relevant to this article was reported.
Acknowledgments
We acknowledge the Waisman Center Brain Imaging and UW Cyclotron groups for providing imaging services and radioisotopes, respectively.
Footnotes
Published online Nov. 10, 2016.
- © 2017 by the Society of Nuclear Medicine and Molecular Imaging.
REFERENCES
- Received for publication August 26, 2016.
- Accepted for publication October 25, 2016.


