


Abstract
Tumor-associated macrophages (TAMs) are increasingly investigated in cancer immunology and are considered a promising target for better and tailored treatment of malignant growth. Although TAMs also have high diagnostic and prognostic value, TAM imaging still remains largely unexplored. Here, we describe the development of reconstituted high-density lipoprotein (rHDL)–facilitated TAM PET imaging in a breast cancer model. Methods: Radiolabeled rHDL nanoparticles incorporating the long-lived positron-emitting nuclide 89Zr were developed using 2 different approaches. The nanoparticles were composed of phospholipids and apolipoprotein A-I (apoA-I) in a 2.5:1 weight ratio. 89Zr was complexed with deferoxamine (also known as desferrioxamine B, desferoxamine B), conjugated either to a phospholipid or to apoA-I to generate 89Zr-PL-HDL and 89Zr-AI-HDL, respectively. In vivo evaluation was performed in an orthotopic mouse model of breast cancer and included pharmacokinetic analysis, biodistribution studies, and PET imaging. Ex vivo histologic analysis of tumor tissues to assess regional distribution of 89Zr radioactivity was also performed. Fluorescent analogs of the radiolabeled agents were used to determine cell-targeting specificity using flow cytometry. Results: The phospholipid- and apoA-I–labeled rHDL were produced at 79% ± 13% (n = 6) and 94% ± 6% (n = 6) radiochemical yield, respectively, with excellent radiochemical purity (>99%). Intravenous administration of both probes resulted in high tumor radioactivity accumulation (16.5 ± 2.8 and 8.6 ± 1.3 percentage injected dose per gram for apoA-I– and phospholipid-labeled rHDL, respectively) at 24 h after injection. Histologic analysis showed good colocalization of radioactivity with TAM-rich areas in tumor sections. Flow cytometry revealed high specificity of rHDL for TAMs, which had the highest uptake per cell (6.8-fold higher than tumor cells for both DiO@Zr-PL-HDL and DiO@Zr-AI-HDL) and accounted for 40.7% and 39.5% of the total cellular DiO@Zr-PL-HDL and DiO@Zr-AI-HDL in tumors, respectively. Conclusion: We have developed 89Zr-labeled TAM imaging agents based on the natural nanoparticle rHDL. In an orthotopic mouse model of breast cancer, we have demonstrated their specificity for macrophages, a result that was corroborated by flow cytometry. Quantitative macrophage PET imaging with our 89Zr-rHDL imaging agents could be valuable for noninvasive monitoring of TAM immunology and targeted treatment.
Tumor-associated macrophage (TAM) immunology has become an active research field in recent years (1,2). Their complex role in carcinogenesis generally leads to disease progression in most cancers (3), which share some similar pathologic mechanisms and, often, high TAM burden has been associated with poor prognosis (4). During cancer progression, circulating monocytes and macrophages are recruited to tumors, where they differentiate under the influence of a milieu of growth factors and cytokines (5). In this process, TAMs themselves become critical modulators of the tumor microenvironment, as they foster tumor growth (6), immune suppression, metastasis (7), and chemoresistance (1) by generating tumor-promoting conditions. TAMs’ significant implication in modulating the immune system response to tumor growth has led to various TAM-targeting therapies (8), some of which are being evaluated in the clinic (2,9,10).
For these reasons, specific and quantifiable TAM imaging agents are critical to evaluate the efficacy of TAM-targeting therapies and to facilitate prognosis of TAM-driven cancers. In fact, imaging of macrophages as key mediators of the inflammatory response is already an active area of research. Several nanoparticulate materials have been studied as such imaging agents (11). Among others, several iron oxide–based MR imaging probes (12,13), as well as 64Cu-labeled/mannose-functionalized liposomes (14), and nanobodies (15) have been applied. Still, despite these efforts, clinical imaging of TAMs remains largely unexplored.
High-density lipoprotein (HDL) is a natural nanoparticle that has been exploited for MR molecular imaging of the atherosclerotic plaque, and its specificity for macrophages has been established (16). Furthermore, in 2 recent studies, we have demonstrated its ability to deliver an antiinflammatory drug to macrophages in atherosclerotic plaques with great specificity (17,18). To enable HDL use for quantitative PET imaging of TAMs, we here present the design and synthesis of 2 different 89Zr-modified reconstituted HDL (rHDL) nanotracers and their in vivo evaluation in an orthotopic mouse model of breast cancer. Specifically, we labeled either its protein component (apolipoprotein A-I [apoA-I]) or its phospholipid load and examined the agent’s TAM targeting using in vivo PET imaging and ex vivo analyses, including immunohistochemistry. Additionally, we prepared 2 fluorescent analogs of our radiolabeled 89Zr-rHDL nanotracers to allow us to gain insight into their cellular targets by flow cytometry.
MATERIALS AND METHODS
A detailed description of the preparation of reconstituted HDL nanoparticles; their radiolabeling; and in vitro, in vivo, and ex vivo experiments can be found in the supplemental data (available at http://jnm.snmjournals.org). All animal experiments were done in accordance with protocols approved by the Institutional Animal Care and Use Committee of Memorial Sloan Kettering Cancer Center and followed National Institutes of Health guidelines for animal welfare.
RESULTS
Preparation of rHDL Nanoparticles and Radiolabeling with 89Zr
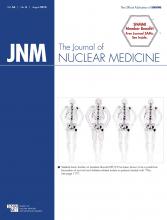
rHDL (Fig. 1A) nanoparticles were prepared by mixing DMPC (dimyristoylphosphatidylcholine) vesicles with apoA-I, resulting in discoidal particles with a mean hydrodynamic diameter of 8.7 ± 0.9 nm (n = 6), as measured by dynamic light scattering. The labeling of rHDL nanoparticles with 89Zr required prior modification of its components with the chelator deferoxamine (DFO; also known as desferrioxamine B, desferoxamine B). Conjugation of DFO to apoA-I was achieved via reaction of its lysine amino groups with DFO-p-NCS on preformed rHDL particles. The resulting DFO-apoA-I@rHDL had a diameter of 8.9 ± 1.1 nm (n = 5). To label the phospholipid cargo, we incorporated the phospholipid chelator 1,2-distearoyl-sn-glycero-3-phosphoethanolamine (DSPE)-DFO in the formulation at the expense of DMPC. Thus, we obtained 1% DSPE-DFO@rHDL with a mean diameter of 8.6 ± 1.3 nm (n = 5). The retention time of the 2 modified nanoparticles on size-exclusion chromatography was identical and the same as unmodified rHDL, which corresponds to a species of estimated molecular weight of 150 kDa. Transmission electron microscopy images showed that both modified rHDL nanoparticles retained the discoidal shape (Fig. 1B). Radiolabeling of both DFO-apoA-I@rHDL and 1% DSPE-DFO@rHDL proceeded in high yield. apoA-I–labeled rHDL (89Zr-AI-HDL, Fig. 1A) was obtained in 94% ± 6% (n = 6) radiochemical yield; for phospholipid-labeled rHDL (89Zr-PL-HDL, Fig. 1A), radiochemical yield was 79% ± 13% (n = 6). The composition, size, and ζ-potential of rHDL and the radiolabeled nanoparticles described in this study are shown in Figure 1C. Radiochemical purity was greater than 99% in both cases (Figs. 2A and 2B). As expected, the incubation of plain, unmodified rHDL particles with 89Zr-oxalate in the same conditions resulted in no detectable radiolabeling.

Structure and composition of rHDL and 89Zr-HDL nanotracers. (A) Schematic of rHDL (left), 89Zr-AI-HDL (middle), and 89Zr-PL-HDL (right). (B) Transmission electron microscopy images of rHDL (left), Zr-AI-HDL (middle), and Zr-PL-HDL (right). (C) Composition (in mol %), size, polydispersity index (PDI), and surface charge of rHDL, 89Zr-AI-HDL, and 89Zr-PL-HDL. Data are presented as mean ± SD (n ≥ 3).

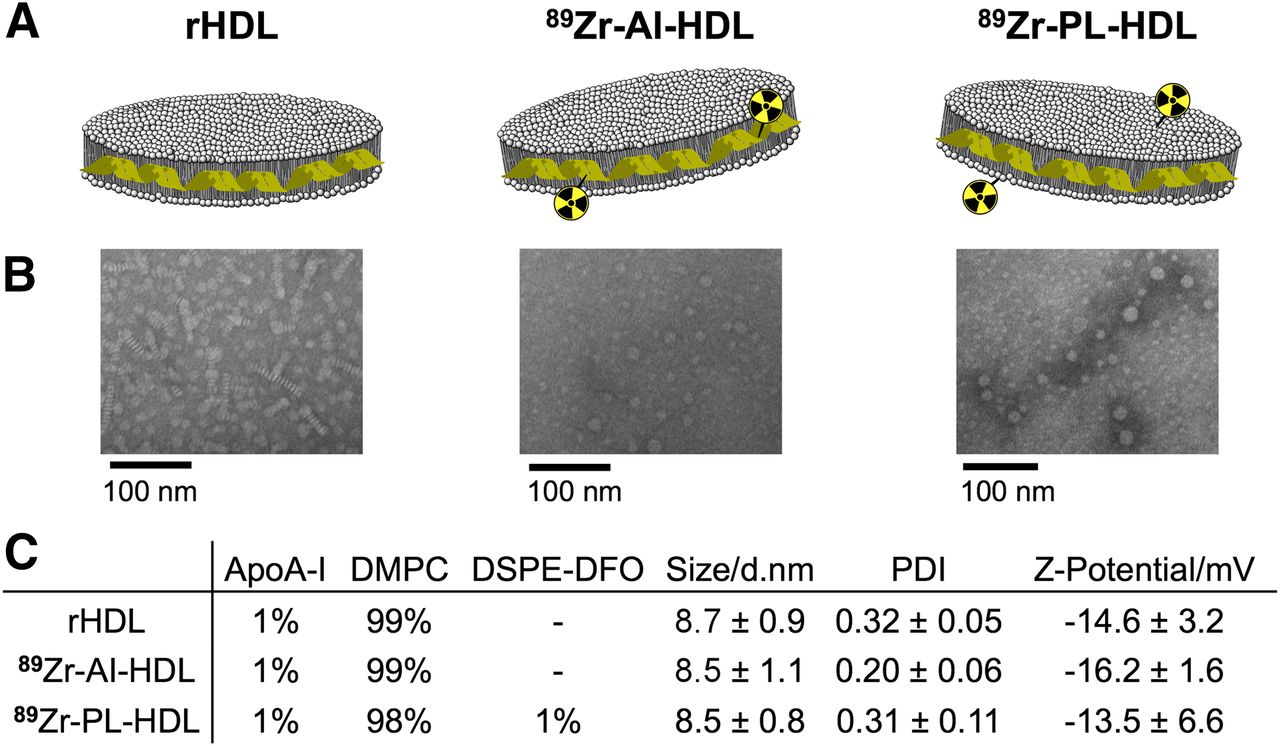
Radiosynthesis and in vitro stability of 89Zr-HDL nanotracers. Size-exclusion chromatograms showing coelution of plain rHDL (black trace), DFO-apoA-I@rHDL (red trace), and 89Zr-AI-HDL (blue, radioactive trace) (A) and coelution of 1% DSPE-DFO@rHDL (black trace) and 89Zr-PL-HDL (green, radioactive trace) (B). (C) In vitro serum stability of 89Zr-HDL nanotracers at 37°C.
In Vitro Serum Stability of 89Zr-Labeled HDL Nanotracers
To study label dynamics in vitro, the radiolabeled nanoparticles were incubated at 37°C in fetal bovine serum. Analysis by size-exclusion chromatography proved the dynamic nature of these nanoparticles. For 89Zr-AI-HDL, a new peak eluting at the same retention time as free apoA-I was detected. The ratio between 89Zr-AI-HDL and this species remained largely constant over time. Another species of molecular weight greater than 300 kDa was observed at all time points. 89Zr-PL-HDL showed a similar dynamic behavior, and a peak corresponding to larger particles of molecular weight greater than 300 kDa was also observed at all time points. Interestingly, activity directly associated with albumin was not detectable until 8 h, and in any case most of it (63.3% ± 1.5%) remained bound to HDL particles (Fig. 1C). The release of small radiolabeled species was detectable after 24 h for 89Zr-AI-HDL (5.5% ± 0.7%, n = 3) and after 2 h for 89Zr-PL-HDL (3.3% ± 0.6%, n = 3, then reached 11.7% ± 6.4%, n = 3, after 24 h). The detection of the small radiolabeled species could be due to release of 89Zr from its DFO complex or a result of the degradation of the thiourea bond in the presence of oxidizing chlorinated species (19) resulting in the detachment of the 89Zr-DFO unit. Collectively, however, these data suggest that both 89Zr-AI-HDL and 89Zr-PL-HDL are sufficiently stable to allow adequate in vivo evaluation.
Pharmacokinetics and Biodistribution of 89Zr-Labeled HDL Nanotracers
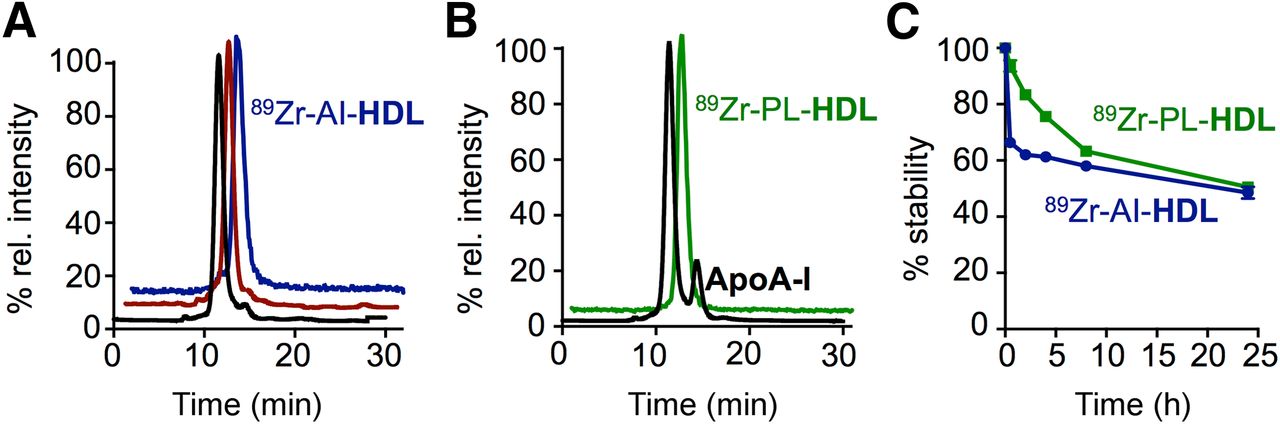
Blood radioactivity clearance was markedly different, depending on whether the radiolabel was attached to apoA-I or the phospholipid of rHDL, indicating that the nanoparticle might be not only passively delivered but also actively distributed, governed by its natural biologic function. The weighted half-life value measured for 89Zr-AI-HDL was 5.7 h, nearly 3 times longer than that shown by 89Zr-PL-HDL, with a half-life of 2.0 h (Fig. 3A). Tissue radioactivity distribution in female B6 mice bearing orthotropic 4T1-induced breast tumors was determined at 2, 24, and 48 h after administration. A selection of tissues is shown in Figure 3B for both formulations, and a complete list of values can be found in the supplemental data (Supplemental Tables 1 and 2). As expected from their blood half-lives, most of the radioactivity remains in blood at 2 h after injection. Significant accumulation was also observed in the kidneys (16.4 ± 2.1 percentage injected dose per gram [%ID/g] [89Zr-AI-HDL] and 13.1 ± 1.6 %ID/g [89Zr-PL-HDL]), liver (significantly higher for 89Zr-PL-HDL [14.1 ± 1.5 %ID/g] than 89Zr-AI-HDL [7.51 ± 2.21 %ID/g]), and, to a lesser extent, spleen (5.0 ± 1.2 and 7.2 ± 0.4 %ID/g, respectively). Tumor uptake at this time point was below 5% for both tracers. At 24 h after injection, blood activity levels had dropped to 5.30 ± 0.94 and 2.19 ± 0.23 %ID/g for 89Zr-AI-HDL and 89Zr-PL-HDL, respectively. A dramatic increase in tumor uptake can be observed for 89Zr-AI-HDL, reaching 16.5 ± 2.8 %ID/g, whereas that of 89Zr-PL-HDL was 8.6 ± 1.3 %ID/g. Kidney uptake was high for both nanotracers, but it was significantly higher for 89Zr-AI-HDL at 21.2 ± 1.9 %ID/g. Whole-bone activity for 89Zr-PL-HDL went up to 15.5 ± 1.9 %ID/g at this time point. Liver and spleen still retained a significant amount of activity. At 48 h after injection, liver, spleen, and kidney uptake was statistically identical for both radiolabeling approaches. Similarly, tumor uptake was 12.3 ± 4.5 %ID/g for 89Zr-AI-HDL and 12.0 ± 4.7 %ID/g for 89Zr-PL-HDL. The biggest discrepancy in biodistribution profiles at 48 h remained bone uptake, which was 17.1 ± 4.8 %ID/g for 89Zr-PL-HDL and remained at 2.70 ± 0.62 %ID/g for 89Zr-AI-HDL. We determined that 3.6% ± 1.1% of this uptake originated from bone marrow, leaving 96.4% ± 1.1% associated with mineral bone, whereas for 89Zr-AI-HDL the fraction originating from bone marrow was 27.8% ± 4.1%.

Pharmacokinetics and biodistribution of 89Zr-HDL nanotracers. (A) Blood time–activity curve for 89Zr-AI-HDL and 89Zr-PL-HDL (n = 3). (B) Radioactivity distribution in selected tissues of 89Zr-AI-HDL (blue) and 89Zr-PL-HDL (green) in mice bearing orthotopic breast cancer tumors, expressed as %ID/g ± SD (n ≥ 3).
In Vivo Imaging of 89Zr-Labeled HDL Nanotracers
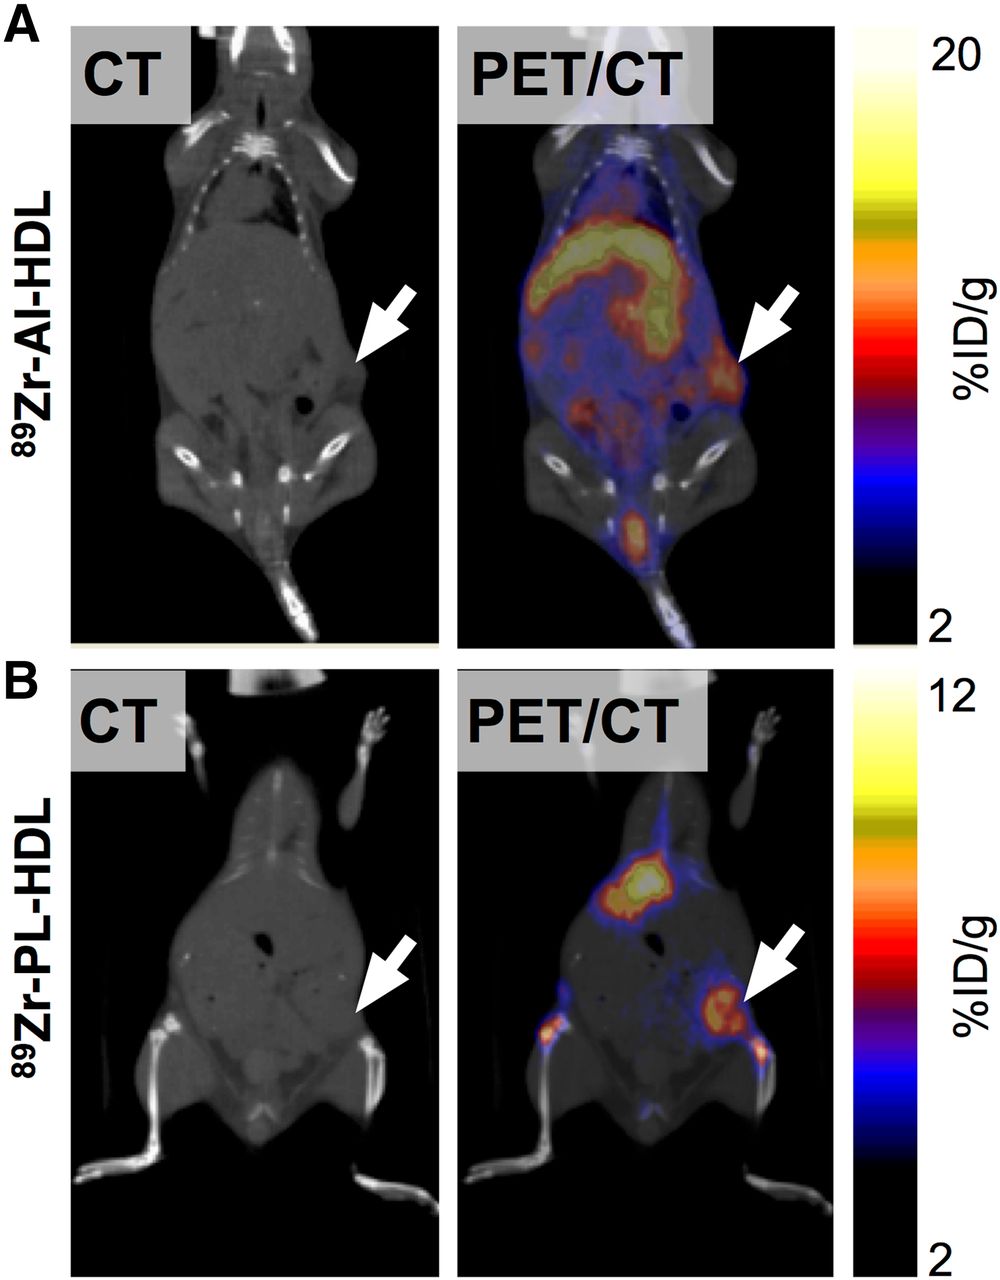
PET imaging corroborated the observations obtained in ex vivo experiments (Fig. 4). The images collected at 24 h after injection show strong liver, kidney, and tumor uptake for both nanotracers. Quantitative PET data (Supplemental Fig. 1) were essentially in agreement with the biodistribution results. When PET was used, tumor uptake values were significantly higher for 89Zr-AI-HDL at 16.7 ± 1.6 %ID/g (n = 4) than for 89Zr-PL-HDL (9.9 ± 0.5 %ID/g, n = 4). PET-quantified liver and kidney uptake was higher for 89Zr-AI-HDL (20.8 ± 2.9 and 29.3 ± 11.5 %ID/g [n = 4], respectively) than for 89Zr-PL-HDL (19.7 ± 2.5 and 13.0 ± 2.3 %ID/g [n = 4]). PET-quantified blood activity concentrations, measured in the cardiac chambers, were significantly higher than those obtained from ex vivo experiments. At this time point, radioactivity in blood was 7.9 ± 1.6 %ID/g (n = 4) for 89Zr-AI-HDL and 4.7 ± 1.5 %ID/g (n = 4) for 89Zr-PL-HDL, and this difference was statistically significant.

Accumulation of 89Zr-HDL nanotracers in tumor tissues can be visualized by in vivo PET imaging. CT (left) and PET/CT fusion (right) images of 89Zr-AI-HDL (A) and 89Zr-PL-HDL (B) obtained at 24 h after injection in mice bearing orthotopic 4T1 tumors (indicated by arrows).
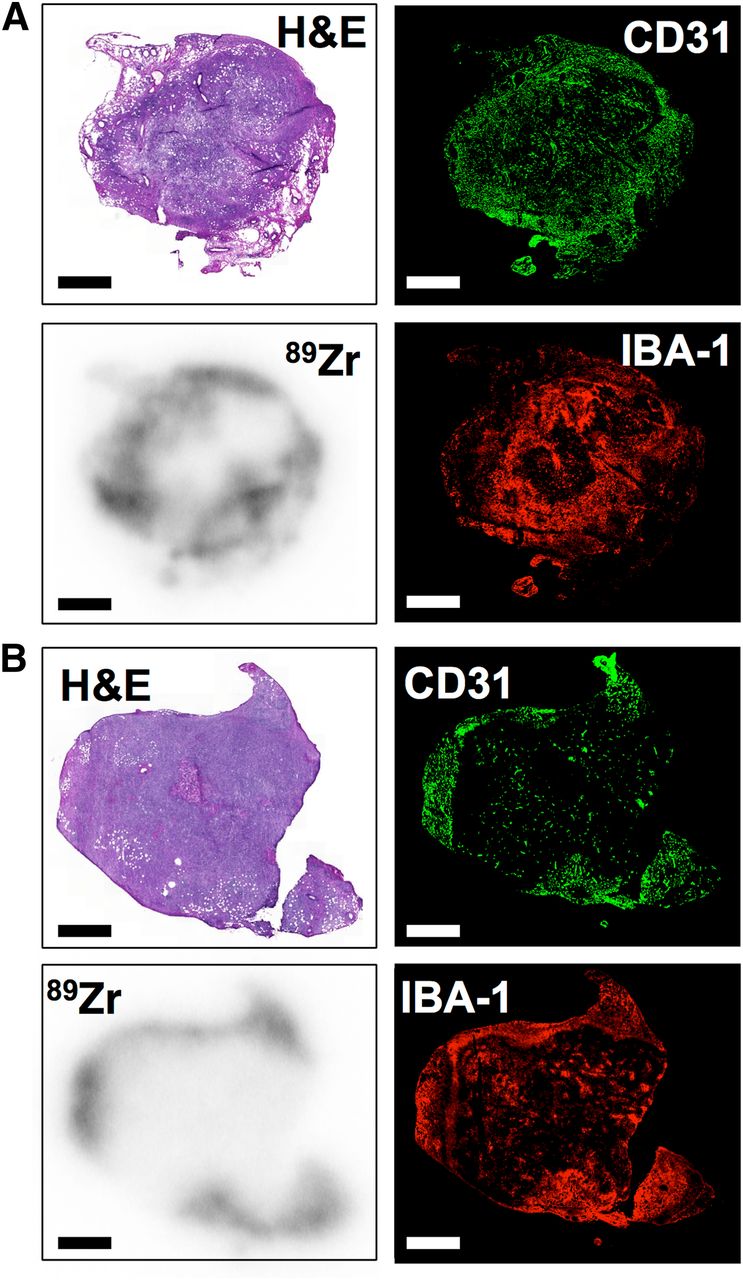
Histologic analysis of tumor sections collected at 24 h after injection allowed us to establish regional distribution of both nanotracers (Fig. 5). Areas with high 89Zr deposition are highly vascularized, as shown by colocalization of CD31 and autoradiography (Figs. 5A and 5B). However, staining for Iba-1 (Figs. 5A and 5B) showed that particularly 89Zr-PL-HDL had also a high degree of colocalization to macrophage-rich areas (Fig. 5B).

89Zr-HDL nanotracers accumulate in TAM-rich areas. Ex vivo histologic analysis of tumor sections at 24 h after administration of HDL nanotracers, showing hematoxylin and eosin (H&E) staining (top left), immunofluorescence for CD31 (top right) and IBA-1 (bottom right), and autoradiography (bottom left) for 89Zr-AI-HDL (A) and 89Zr-PL-HDL (B). Scale bar = 2 mm.
Cellular Distribution of 89Zr-Labeled HDL Nanotracers
The intercellular distribution of the 89Zr-labeled rHDL probes was determined by flow cytometry with their respective nonradioactive analogs Zr-AI-HDL and Zr-PL-HDL. Both were labeled with a fluorescent tag (DiO), using a previously reported procedure (17,18). The labeled nanoparticles DiO@Zr-AI-HDL and DiO@Zr-PL-HDL had the same retention time as their radiolabeled counterparts 89Zr-AI-HDL and 89Zr-PL-HDL and as the unlabeled, plain rHDL using size-exclusion chromatography. We used a robust flow cytometry gating procedure to identify HDL levels in 7 relevant cell types, including TAMs, monocyte-derived cells, monocytes, dendritic cells, T cells, endothelial cells (ECs), and tumor cells (Supplemental Fig. 2). We found the highest HDL uptake by TAMs, with HDL levels 3.5-fold (DiO@Zr-AI-HDL, P < 0.01) and 4.1-fold (DiO@Zr-PL-HDL, P < 0.01) higher than monocyte-derived cells; 19.0-fold (P < 0.01) and 29.1-fold (P < 0.01) higher than monocytes; 5.9-fold (P < 0.001) and 6.5-fold (P < 0.001) higher than dendritic cells (P < 0.05); 124.2-fold (P < 0.01) and 164.8-fold (P < 0.01) higher than T cells; 6.3-fold (P < 0.01) and 4.9-fold (P < 0.001) higher than ECs; and 6.8-fold (P < 0.01) and 6.8-fold (P < 0.001) higher than tumor cells (Fig. 6). In this tumor model, TAMs accounted for 7.0% ± 4.4% of total live cells but made up 40.7% ± 12.9% (DiO@Zr-PL-HDL) and 39.5% ± 4.1% (DiO@Zr-AI-HDL) of total intracellular HDL in all live cells. Using fluorescent, unmodified rHDL (DiO@rHDL), we found a strikingly similar cell targeting pattern to the 2 Zr-labeled fluorescent HDL formulations (Supplemental Fig. 3), suggesting that Zr modification totally preserves the intrinsic TAM-targeting ability of rHDL. These data compellingly show that HDL not only efficiently accumulated in tumors but also specifically targeted TAMs.

Both DiO@Zr-PL-HDL and DiO@Zr-AI-HDL preferentially target tumor-associated macrophages. 4T1 cell–induced orthotopic breast tumors were used to isolate single cells. (A) Representative DiO levels in 5 immune cells, namely TAMs, monocyte-derived cells (Mo-derived cells), monocytes, dendritic cells (DCs), and T cells. (B) Representative DiO levels in ECs and tumor cells (4T1). Cells from a phosphate-buffered saline–injected mouse served as controls (gray histograms to left). (C) Quantification of DiO levels presented as mean fluorescence intensity (MFI). Importantly, no statistical significance was found when comparing DiO levels of same cell type from 2 HDL formulations. Statistics were calculated with 2-tailed Student t test with unequal variance by comparing with TAM from same group. **P < 0.01. ***P < 0.001.
DISCUSSION
The aim of this study was to design a radiolabeled HDL-based nanoparticle to selectively target TAMs, capitalizing on HDL’s biologic function (20) rather than passive accumulation (via the enhanced permeability and retention effect) (11) or hijacking a biomarker for targeted imaging (15). For this, we explored 2 different HDL-labeling approaches: attachment of the radiolabel to apoA-I, the main apolipoprotein component of HDL, and radiolabeling of the phospholipid load of the particle. We chose 89Zr as the radioisotope because its physical half-life (78.4 h) matches the long biologic half-life of HDL.
Both radiolabeling approaches required different DFO-modified building blocks. The first one was synthesized by conjugation of DFO to apoA-I via reaction of the rHDL particles with DFO-p-NCS. The second one, the phospholipid-based chelator DSPE-DFO, was prepared as recently described by us (21). These modifications had no measurable effect on the size, compared with plain rHDL (Fig. 1C). In both cases, the radiolabeling of the modified precursors resulted in the permanent association of the radioisotope to a particle fraction of an estimated molecular weight of 150 kDa. This molecular weight is in concordance with the expected molecular weight of discoidal HDL (22).
Biologic evaluation was performed in mice and provided insight into the nanoparticles’ pharmacokinetics. The blood residence time differences likely reflect the different behavior of both components in natural HDL. The protein-labeled 89Zr-AI-HDL showed a significantly longer blood half-life (5.7 h) as opposed to the 2.0 h half-life observed for 89Zr-PL-HDL. It is well known that phospholipids transported by HDL exchange with other lipoproteins (23) before they are ultimately cleared from circulation when delivered to their targets. On the other hand, the net internalization and catabolic rate of apoA-I are low, thus lengthening its circulation time, compared with the phospholipid-labeled nanoparticle (24). As a result, the 89Zr-AI-HDL–associated radioactivity half-life seems to match the slow turnover of HDL in the organism.
The breast cancer cell line 4T1 was chosen as a relevant breast cancer model to evaluate TAM targeting, because high TAM concentrations in tumors are associated with poor prognosis in this type of cancer (2). Acute radioactivity distribution in tissues in tumor-bearing mice provided blood-clearance profiles similar to the ones observed in blood half-life experiments. By 48 h after injection, less than 1 %ID/g remained in circulation (0.98 ± 0.25 vs. 0.49 ± 0.06 %ID/g for 89Zr-AI-HDL and 89Zr-PL-HDL, respectively). The high accumulation of radioactivity observed in the kidney, especially for 89Zr-AI-HDL, is in agreement with previous animal studies (25,26). Kidneys play an important role in apoA-I catabolism, probably via the proximal renal tubules, where apoA-I is taken up and degraded (27). apoA-I is thus filtered through the glomerular basement membranes, followed by proximal tubule uptake, enabling endocytosis of HDL proteins (28). In fact, a higher glomerular filtration rate is associated with low HDL and apoA-I levels in humans (29).
Tumor uptake was high for both formulations, peaking at 16.5 ± 2.8 %ID/g at 24 h after injection for 89Zr-AI-HDL and 12.0 ± 4.7 %ID/g at 48 h after injection for 89Zr-PL-HDL. High accumulation of radioactivity in the bones of mice injected with 89Zr-PL-HDL was observed. For 89Zr-AI-HDL, whole-bone uptake remained below 4 %ID/g at all time points, but a progressive increase was observed for 89Zr-PL-HDL, reaching 17 %ID/g at 48 h after injection. This radioactivity accumulation in the bone was mainly associated with mineral bone for both probes, as less than 5% and 30% of whole-bone activity was taken up by bone marrow for 89Zr-PL-HDL and 89Zr-AI-HDL, respectively. The high accumulation of activity in the mineral component of the bone has been reported for other long-circulating 89Zr-labeled agents (30,31) and seems to be the result of liberation of 89Zr from its chelator (32). These data were largely in agreement with the respective PET imaging signatures. Intense signals were observed in the kidneys and liver, as well as tumor, at 24 h after injection (Fig. 4). Statistically significant differences were found for blood and tumor PET-derived uptake values between the 2 nanotracers. For 89Zr-PL-HDL, radioisotope uptake was also observed in the skeleton and joints mirroring ex vivo results. Most notably, ex vivo analysis of tumor sections allowed us to evaluate the nanoparticles’ spatial and cell type distributions. Thus, both 89Zr-PL-HDL and 89Zr-AI-HDL seemed to accumulate in macrophage-rich regions, as evidenced by the colocalization of radioactivity to Iba-1–positive areas (Fig. 5).
Because histologic analysis data are inherently qualitative in nature, we decided to further quantitatively elucidate cellular specificity by flow cytometry using fluorescently labeled analogs of the radiolabeled nanotracers modified with nonradioactive zirconium. Flow cytometry analysis of a comprehensive panel of biomarkers allowed us to differentiate the particles’ preference for 7 different cell types: TAMs, ECs, 4T1 tumor cells, monocyte-derived cells, monocytes, dendritic cells, and T cells (Fig. 6). The variations in fluorescence intensities among the different cell types likely reflect how HDL nanoparticles interact with their targets. Similar to histologic analysis, HDL preferentially targeted immune cells, particularly macrophages, followed by monocyte-derived cells and dendritic cells. Monocytes, T cells, ECs, and tumor cells were only marginally targeted (Fig. 6C). Moreover, the targeting pattern of both Zr-labeled fluorescent analogs was similar to that of the unmodified version (Supplemental Fig. 3). These results, in conjunction with those observed on histologic analysis, compellingly indicate that Zr-modified rHDL nanoparticles retain their biologic function and that they target macrophages with high specificity.
CONCLUSION
We have developed 2 high-yielding radiolabeling strategies to generate 89Zr-HDL nanoparticles and compared them in extensive studies. PET imaging allowed noninvasive visualization of the nanotracers’ high accumulation in tumors, and ex vivo histologic and flow cytometry analyses confirmed TAMs as their main target. The development of quantifiable macrophage imaging agents can meet important scientific and clinical needs, including more accurate diagnoses, prognoses, and improved treatment monitoring. We therefore believe that our imaging agents could ultimately be of high value for noninvasive in vivo evaluation of TAM burden, not only in preclinical but also in clinical settings.
DISCLOSURE
The costs of publication of this article were defrayed in part by the payment of page charges. Therefore, and solely to indicate this fact, this article is hereby marked “advertisement” in accordance with 18 USC section 1734. Financial support was provided by the NIH (K25 EB016673, R01 HL118440, R01 HL125703, R01 CA155432, P30 CA008748), the Brain Tumor Center of the Memorial Sloan Kettering Cancer Center, the Nanotechnology Center for Molecular Imaging and Nanotechnology, the CNIC CardioImage program, and NWO Vidi 91713324. No other potential conflict of interest relevant to this article was reported.
Acknowledgments
We thank the Small Animal Imaging Core, the Radiochemistry and Molecular Imaging Probes Core, and the Molecular Cytology Core at Memorial Sloan Kettering Cancer Center as well as the flow cytometry facility of The Tisch Cancer Institute of Icahn School of Medicine at Mount Sinai for support. We also thank the NIH, the Brain Tumor Center of Memorial Sloan-Kettering Cancer as well as the Nanotechnology Center for Molecular Imaging and Nanotechnology for their generous funding, and the CNIC CardioImage program. In addition, thanks to Christopher Irwin for his help with biodistribution experiments.
Footnotes
Published online Jun. 25, 2015.
- © 2015 by the Society of Nuclear Medicine and Molecular Imaging, Inc.
REFERENCES
- Received for publication April 7, 2015.
- Accepted for publication June 4, 2015.


Jump to section
Related Articles
Cited By...
- 89Zr-Labeled High-Density Lipoprotein Nanoparticle PET Imaging Reveals Tumor Uptake in Patients with Esophageal Cancer
- A modular approach toward producing nanotherapeutics targeting the innate immune system
- An 89Zr-HDL PET Tracer Monitors Response to a CSF1R Inhibitor
- Imaging-assisted nanoimmunotherapy for atherosclerosis in multiple species
- An Overview of PET Radiochemistry, Part 2: Radiometals
- Magnetic Resonance Imaging of Tumor-Associated Macrophages: Clinical Translation
- Combined PET/DCE-MRI in a Rabbit Model of Atherosclerosis: Integrated Quantification of Plaque Inflammation, Permeability, and Burden During Treatment With a Leukotriene A4 Hydrolase Inhibitor
- In Vivo Imaging of Pro- and Antitumoral Cellular Components of the Tumor Microenvironment
- Immune cell screening of a nanoparticle library improves atherosclerosis therapy
- In Vivo PET Imaging of HDL in Multiple Atherosclerosis Models