


Abstract
Tumor development and growth, as well as metastatic spread, are strongly influenced by various, mostly innate, immune cells, which are recruited to the tumor site and driven to establish a specific tumor-supportive microenvironment. The contents of this microenvironment, such as myeloid cells, are a major factor in the overall prognosis of malignant disease, addressed by a constantly growing armament of therapeutic interventions targeting tumor-supportive immune cells. Current clinical imaging has long ignored the growing need for diagnostic approaches addressing these microenvironmental contents—approaches enabling a sensitive and specific classification of tumor immune crosstalk and the resulting tumor-associated immune cell activity. In this focus article we review the present status of, and promising developments in, the in vivo molecular imaging of tumor immune components designed to allow for inferences to be made on the cross-talk between tumor cells and the immune system. Current imaging modalities based on the infiltrating cell types are briefly discussed.
The prognosis of cancer is most notably dependent on tumor cell invasion and metastasis, both being promoted by cellular and molecular mechanisms in the primary tumor and at distant premetastatic sites. At early stages of their development, tumors are already infiltrated by mainly innate immune cells and build a characteristic tumor microenvironment (TME). The active recruitment of various immune cells results in tumor-associated inflammation, which is an important condition for tumor growth and expansion and has been described by Hanahan and Weinberg as a new hallmark of cancer (1).
These observations have led to an increasing number of targeted therapeutic approaches in oncology. However, specific in vivo biomarkers for tumor-mediated immune cell activity and monitoring under therapy are still missing.
Therefore, there is a growing need for visualization and measurement of molecular and cellular components of the TME in vivo, to aid development of new therapeutic options and enable their theranostic monitoring, as well as to gain a better understanding of tumor biology.
ANTITUMORAL CELLULAR COMPONENTS OF TME
During cancer development, tumors enforce a shift in the TME from normal tissue homeostasis to promotion of malignant progression. The TME is composed of protumoral immune cells, which enable tumor cell invasion and metastasis and, in part, modify certain inflammatory cell types to render them tumor-promoting rather than suppressive (2). However, especially in early tumor development, antitumoral characteristics exist. Immunosurveillance of cancer is driven mainly by natural killer cells (NKs) and CD8-positive T cells.
Both are known as effector cells of the immune system and are cytotoxic to cancer cells through perforin- and granzyme-mediated apoptosis. CD8-positive T cells are activated by antigen presentation of dendritic cells via the major histocompatibility complex I and induce apoptosis in antigen-presenting cells (3). Additional to their endogenous protective effects, NK cells are also mediators of antitumoral cytokines such as interleukin-2 and interleukin-12 (4). Indirect evidence of the effect of immunosurveillance is provided by a reduced risk of cancer in patients with high levels of NK cells (5). Furthermore, NK cells induce a reinforced T-cell response via interferon γ–mediated activation of dendritic cells (6), increasing the antitumoral immune response in a feedback loop.
PROTUMORAL CELLULAR COMPONENTS OF TME
Various interactions between cellular components of the TME result in the retention of a protumoral setting that enhances tumor progression.
Tumor-associated macrophages (TAMs) constitute the biggest population of protumoral components in the TME (6). TAMs are among the first nonneoplastic cells infiltrating the tumor. They are attracted by chemokines secreted by both malignant and stromal cells, especially via chemokine (C–C motif) ligand 2 (7,8). TAMs share characteristics with M2 macrophages: they promote degradation of the extracellular matrix by releasing proteolytic enzymes, whereas in hypoxic tumor areas, they induce neoangiogenesis through hypoxia-induced factor–dependent release of vascular endothelial growth factor (9).
TAMs aid the expansion of the proinflammatory microenvironment by inflammatory cytokines such as tumor necrosis factor α, resulting in a self-augmenting process (10).
Myeloid-derived suppressor cells (MDSCs) are a heterogeneous population of premature granulocytes, macrophages, dendritic cells, and myeloid precursors that expand during tumor development (11). They are associated with tumor progression and neoangiogenesis (8). Through the production of arginase 1 and inducible nitric oxide, MSDCs are potent suppressors of not only CD4- and CD8-positive T cells but also NK cells (12). MDSCs may also differentiate into TAMs under hypoxic conditions (11), underlining the close connection between TAMs and MSDCs.
Levels of neutrophils are increased in several types of cancer, such as colon, stomach, and lung cancer (8), and have a poor prognosis (2) because they are associated with increased invasion and metastasis (2).
Although T-helper type 1 cells act as tumor opponents, CD4-positive T-helper type 2 cells can steer polarization of tumor-associated immune cells away from antitumoral activity (13). Regulatory T cells have a central role in tumor development by directly suppressing effector T cells and establishing an immunosuppressive environment via, inter alia, secretion of various cytokines such as interleukin-10 and transforming growth factor β (14).
Detailed characteristics of anti- and protumoral cell types are provided in Table 1.
Characteristics of Immune Cells in TME
MOLECULAR IMAGING OF TME
Molecular imaging approaches offer the opportunity to examine tumor immune interaction in vivo and noninvasively. Single cells or molecules as TME components can be visualized sensitively and specifically by either cell-tracking strategies or targeting of effector molecules. Labeling strategies for cell tracking can include the direct labeling of isolated cells and transfection of cells for stable expression of traceable molecules or, less invasively, the administration of a specific tracer for cell-bound target structures in vivo (15).
In principle, all conventional imaging technologies, including optical imaging, radionuclide-driven approaches, and MRI, enable visualization of TME components following either of these strategies.
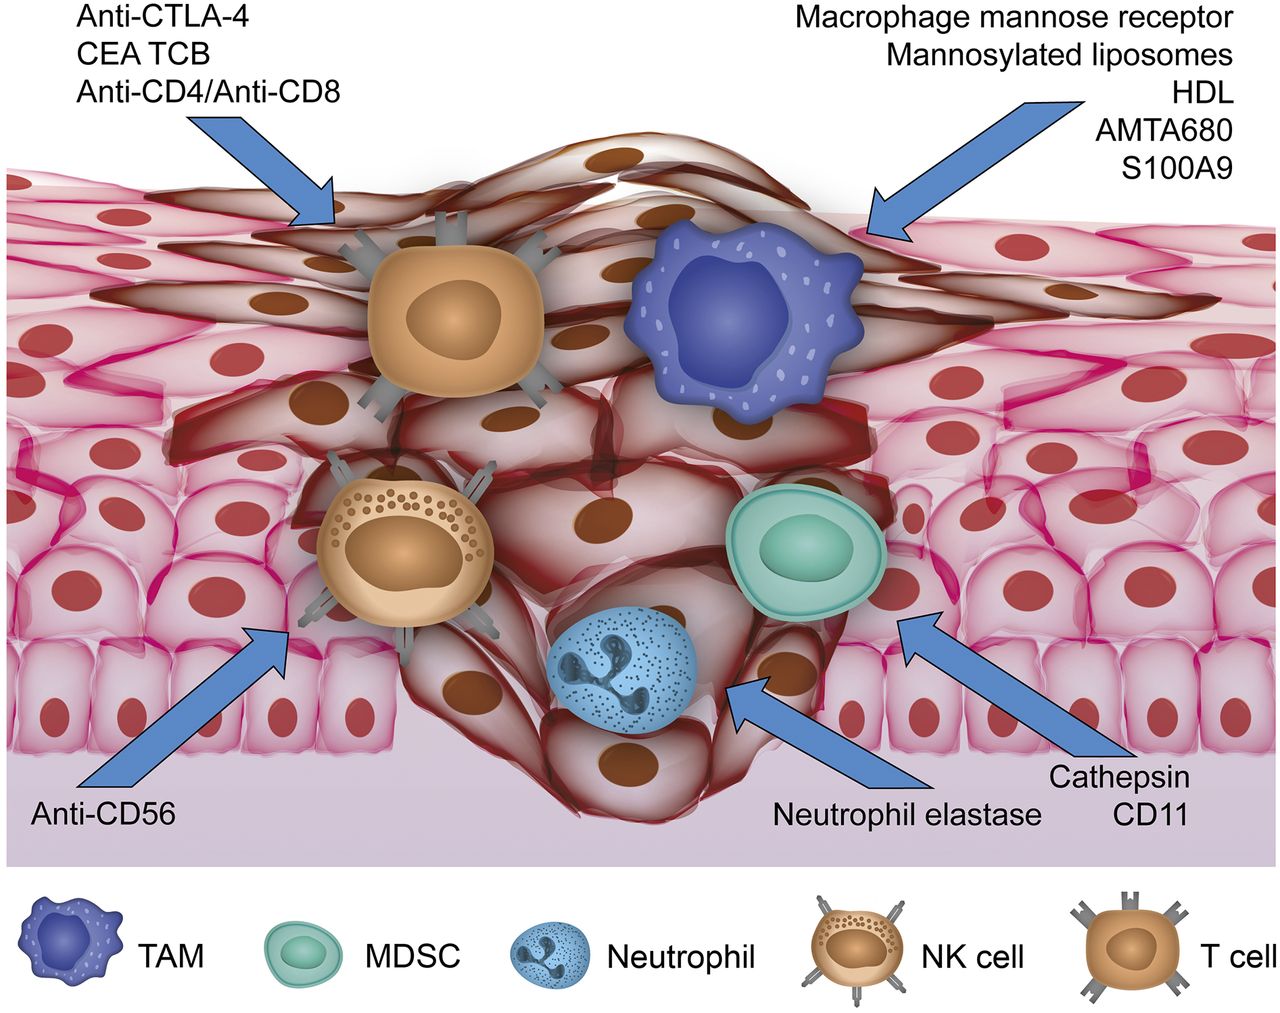
In this article we review examples of imaging the tumor–immune interaction based on the most important tumor-infiltrating immune cells (Fig. 1).

Overview of current imaging approaches targeting cellular compounds of TME. Activity of TAMs, MDSCs, and neutrophils as protumoral immune cells infiltrating primary tumor is reflected by visualizing specific targets for current molecular imaging approaches. Antitumoral NK cells have been addressed by anti-CD56, whereas approaches targeting anti-CTLA-4, anti-CD4/CD8, and carcinoembryonic antigen T-cell–specific antibody (CEA TCB) for T-cell imaging have been reported.
TAMs
Macrophages are the most abundant cells in the TME; their crucial role in tumor development was recognized early.
Their ability to bring about effective phagocytosis renders TAMs ideal for direct labeling using particles of a different sort: mannosylated liposomes loaded with 64Cu and taken up by TAMs were used for PET imaging in a mouse model of pulmonary adenocarcinoma. Integration of a fluorescent dye in the lipid bilayer of liposomes allowed for correlative fluorescence microscopy (16). Although phagocytosis of mannosylated liposomes and macrophage mannose receptor expression is not exclusive to TAMs but has been reported for resident macrophages and other phagocytes, uptake of high-density lipoprotein (HDL) is supposed to be more specific for macrophages (17). 89Zr-modified reconstituted HDL served as a label for PET imaging of TAMs in an orthotopic murine breast cancer model. Because of the biologic function of HDL concerning the cholesterol efflux from macrophages (18), the authors concluded that they were witnessing selective targeting of TAMs rather than passive HDL accumulation. PET imaging allowed noninvasive visualization of labeled HDL at tumor sites, and TAMs could be identified as a main HDL container in ex vivo analyses (17).
For MRI cell tracking, Shih et al. injected superparamagnetic iron oxide nanoparticles (SPIOs) systemically for longitudinal assessment of TAM accumulation during tumor development. Macrophages are known to be the major cell type internalizing SPIOs. MR signal alteration, reflective of local SPIO accumulation, was found near tumor vessels and interpreted as anchor points for tumor expansion. Correlative postmortem analyses provided proof of SPIO-labeled TAMs in tumors (19). Other MRI techniques focus on nanoparticle-based imaging of macrophages and have been reviewed in detail elsewhere (20). Referring to TAMs, a magnetofluorescent nanoparticle (AMTA680) has been presented that addresses a subset of myeloid cells with an M2-like phenotype and showed specific labeling of CD11b-positive myeloid cells. The particle was equipped with 2 reporter tags, a fluorescent dye and a superparamagnetic core, and could, on intravenous injection, be detected in the TMEs by microscopy, MRI, and fluorescence-mediated tomography (21).
Ultra-small SPIOs have a longer circulation than regular SPIOs because they are not as quickly recognized and eliminated by the reticuloendothelial system. The result is a comparatively stronger accumulation in the TME.
Ultra-small SPIO-driven MRI allowed for noninvasive imaging of F4/80-positive phagocytes. In vitro studies showed particle internalization by F4/80-positive TAMs but not by tumor cells. Accordingly, TAM depletion led to a significant inhibition of tumor nanoparticle enhancement (22). With the ultra-small SPIO ferumoxytol being clinically available, a high translational potential for this application is evident.
All these direct labeling approaches suffer from only limited specificity because not only TAMs but also resident macrophages and other phagocytes can in principle accumulate the label/particle and contribute to the image signal. An additional constraint always is the potential influence of the label on cell homeostasis and function.
For more selective in vivo imaging of M2-oriented macrophages, including TAMs, 99mTc-labeled single-domain antibodies, binding the macrophage mannose receptor specifically, were introduced in a preclinical proof-of-concept study (23). This receptor is strongly expressed on proangiogenic TAMs that reside in hypoxic tumor areas. After intravenous injection of 99mTc-labeled antimacrophage mannose receptor single-domain antibodies, TAMs could be detected successfully by SPECT in breast and lung cancer.
Other SPECT and fluorescence imaging–driven approaches targeting the macrophage mannose receptor in murine breast cancer showed high and specific expression in M2 macrophages after sorafenib-induced polarization in tumors. The specific probe IRD-aCD206 could also suppress tumor growth in sorafenib-resistant tumors by light irradiation and consecutive reduction of M2 activity (24).
Intravenous injection of luciferase-expressing murine macrophages enabled in vivo cell tracking in a murine colon cancer model, with mCherry-labeled cancer cells visualized separately (25). The injected cells did have an influence on tumor growth, responsive to dexamethasone. However, the cells were not endogenous, and changes in biologic behavior and cell–cell interaction due to the expression of luciferase remain unclear.
As a marker of monocyte activity in inflammation and a chemokine for TAM and MDSC attraction, the locally released protein heterodimer S100A8/A9 gained attention in immunology and oncology (26). We have introduced an approach for targeted imaging of S100A9 secreted actively by monocytes as well as MDSCs within the TME (27,28). We could visualize monocyte activation beyond sheer abundance in the primary tumor, and we could target metastatic tissue by in vivo optical and radionuclide imaging (Fig. 2) (29).
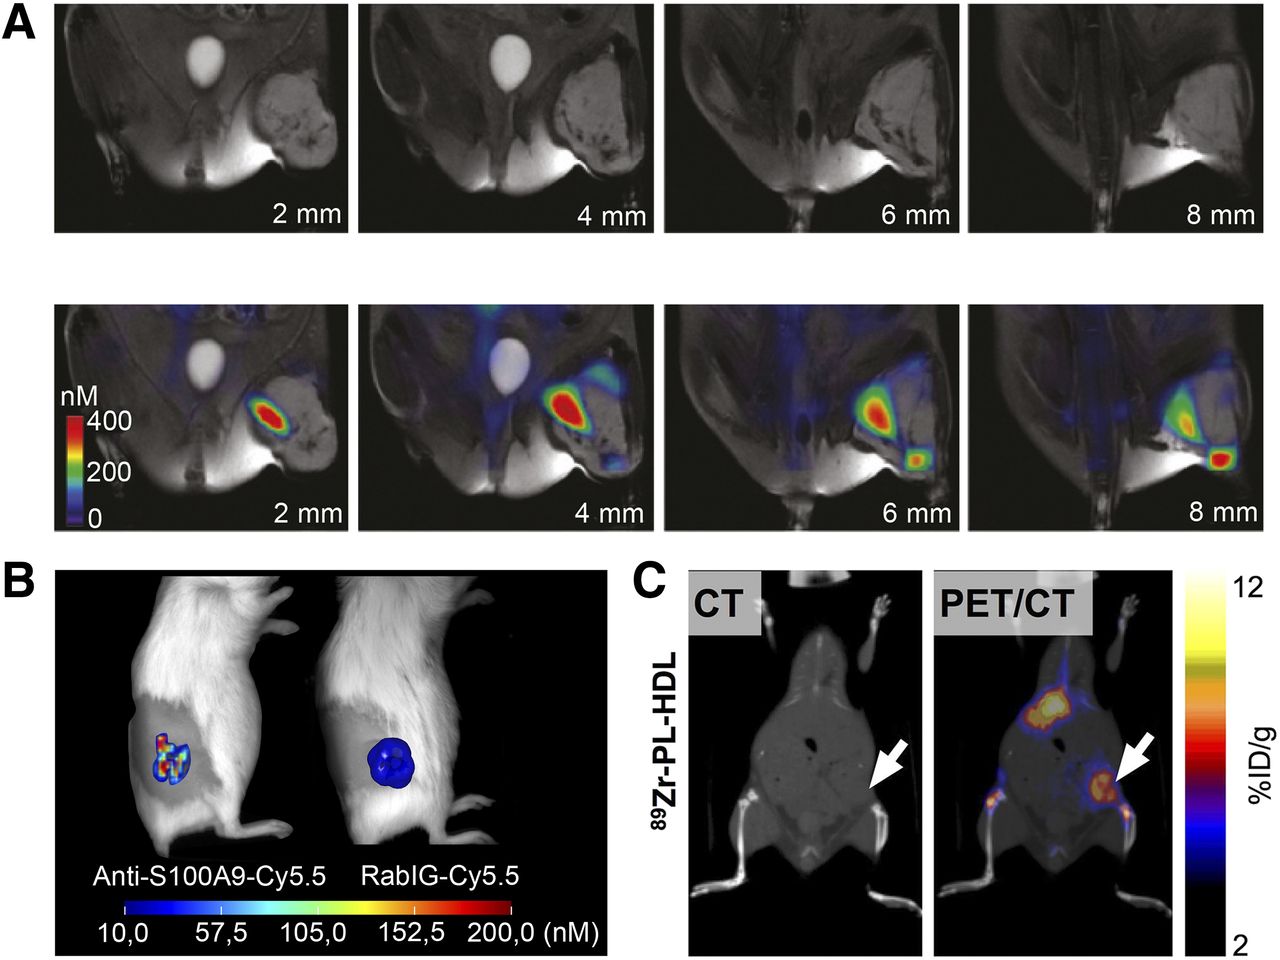
(A) Imaging of TAM distribution in mouse with soft-tissue sarcoma 24 h after intravenous injection of AMTA680, with naïve MR images shown at top and fused fluorescence-mediated tomography and MR images at bottom. (Adapted with permission of (21).) (B) Fluorescence imaging of TAM activity in murine 4T1 breast cancer. The specific tracer anti-S100A9-Cy5.5 shows high accumulation within tumor lesion, whereas homogeneous signal of nonspecifically binding rabIgG-Cy5.5 reflects tumor perfusion. (C) 89Zr-HDL–driven in vivo PET for imaging TAMs in murine 4T1 breast cancer 24 h after tracer injection. CT image is on left and PET/CT image on right. (Adapted with permission of (17).) %ID = percentage injected dose.
MDSCs
TAMs and MSDCs share cathepsin secretion as a means for environmental remodeling. Commercially available optical probes address this protein on secretion, enabling measurement of TAM and MDSC activity. ProSense 680 (PerkinElmer) has been used for visualization of cathepsin B activity in highly vascularized polyps. Genetic ablation of cathepsin B reduced polyposis (30), reflecting the strong influence on tumor development and progression. Colocalization of CD11b and Gr1 staining with ProSense680 signal identified TAMs and MDSCs as main sources of cathepsin.
MDSCs could also be visualized using a 111In-labeled anti-S100A9 antibody in murine breast cancer models with SPECT/CT (29). Imaging 6 h after injection could already identify tumors as small as 3 mm in diameter but also revealed high tracer accumulation in the bone marrow and spleen, which are preferred locations for MSDCs (31).
Because of the phenotypic overlap between TAMs/MDSCs and the heterogeneity within the MDSC population (32), the currently available imaging approaches offer little opportunity to differentiate between the two cell populations in vivo, and further research is needed to resolve how best to define and distinguish the individual actors within the TME.
NEUTROPHILS
For imaging of neutrophil activity, the secreted protease neutrophil elastase has been targeted. The enzyme neutrophil elastase contributes to tumor growth, invasion, and metastasis (33). In vivo optical imaging revealed a highly specific enzyme signal using the neutrophil elastase 680 fluorescent activatable imaging agent in a xenograft model of colon cancer. Accordingly, the neutrophil elastase inhibitor sivelestat could reduce tumor growth and tracer uptake (34).
T CELLS
In recent years, T cells became the target of several therapeutic agents that aim to revert the immune modulation exerted by, for example, regulatory T cells (Fig. 3). The in-part amazing success of these immune checkpoint therapies is hampered by a lack of means for identification and screening of patients who would likely benefit from, for example, an expensive anticytotoxic T-lymphocyte–associated antigen 4 (anti-CTLA-4)–driven therapy. Moreover, adoptive T-cell transfer is a means of therapy in itself, and in vivo monitoring of the course of treatment using cell-tracking techniques became a popular option (35). The numerous approaches to tracking of T cell and imaging of T-cell–driven antitumor immunity have been reviewed elsewhere (36,37).
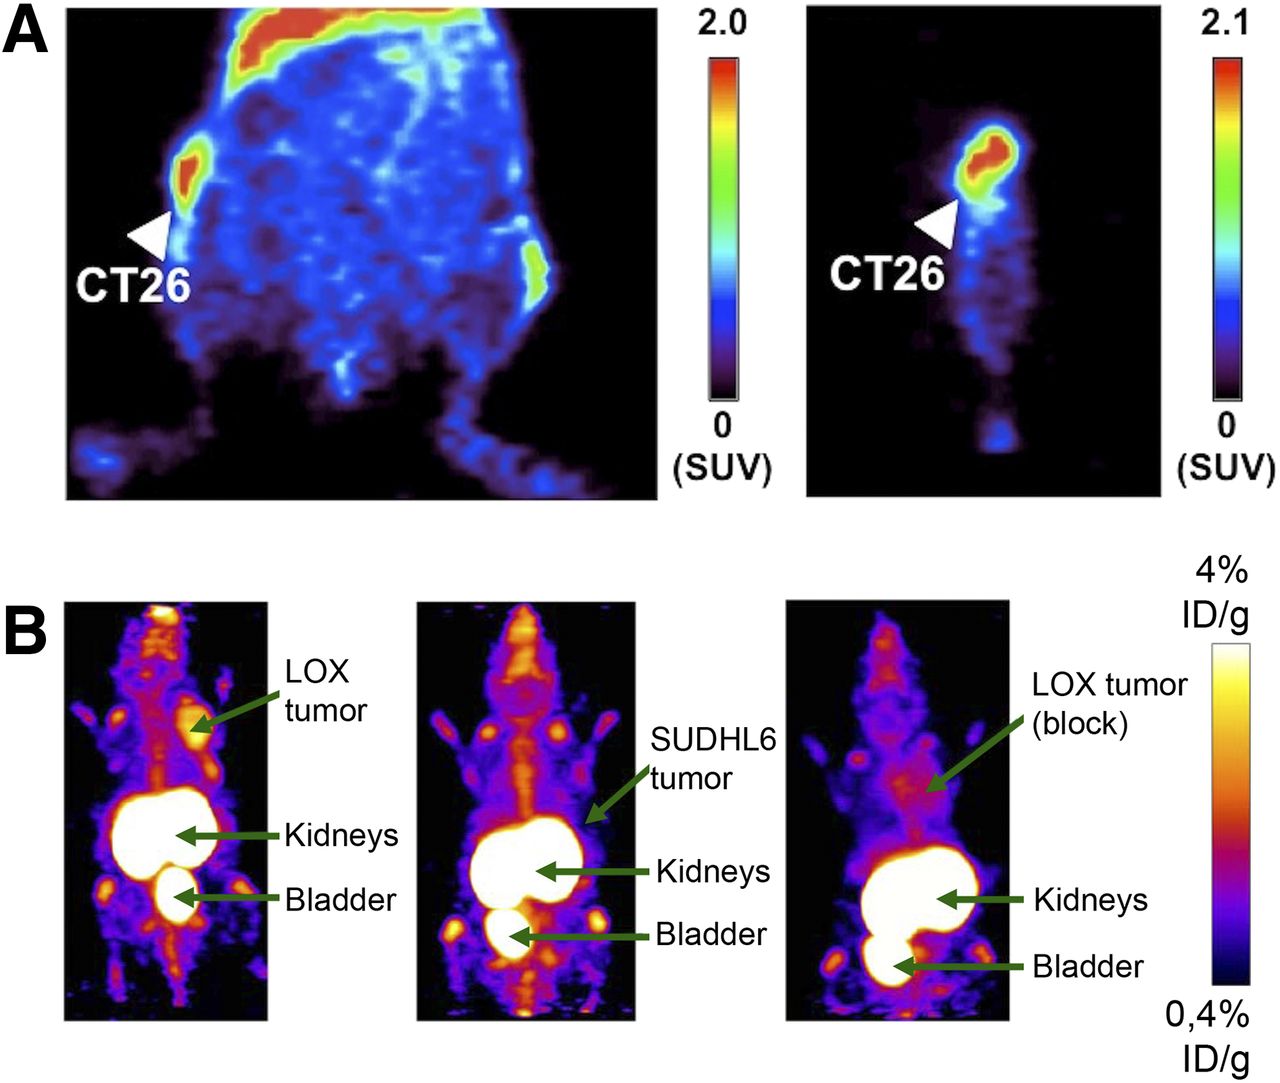
T-cell in vivo imaging within TME. (A) PET imaging using 64Cu-DOTA–labeled anti-CTLA-4 showing specific tracer accumulation in murine CT26 colon carcinoma in representative coronal (left) and sagittal (right) slices. Results suggest promise for evaluating targeted therapy by anti-CTLA-4 monoclonal antibodies. (Adapted with permission of (41).) (B) PET imaging after injection of 18F-labeled anti–PD-L1 Affibody molecule. Tracer allows for imaging of PD-L1 expressing LOX malignant melanoma (left) in comparison with negative controls of nonexpressing lymphoma SUDHL6 (middle) and blocked LOX tumor (right). (Adapted with permission of (48).) %ID = percentage injected dose.
Numerous imaging approaches have been used in the context of adoptive T-cell transfer for monitoring of cell distribution and fate. Aside from those that basically resemble labeling methodology, described earlier, such as iron-loaded particles for MRI and 111In-oxine for SPECT (38), both of which are performed mostly on isolated and purified cell populations ex vivo before transfer, other approaches make use of the specific characteristics of T cells. T cells exert cytolysis through interaction between T-cell receptor and multihistocompatibility complexes, usually representing pathogens. These multihistocompatibility complexes can be modeled and multiplied and, equipped with an imaging label, used for specific visualization of T cells in vivo (39).
Similarly, the CD3 T-cell membrane receptor (bivalent antibodies, for example) binding carcinoembryonic antigen and CD3 can serve as a theranostic agent enabling in vivo (fluorescence) imaging while triggering strong cytotoxic T-cell activation, resulting in killing of tumor cells (40).
CTLA-4 is expressed on T cells and—like PD-1—exerts inhibitory effects on antitumor immunity via multiple signaling pathways. Specific tracers for CTLA-4 have been presented, such as 64Cu-DOTA-anti-CTLA-4 for PET imaging in murine syngeneic colon carcinoma (41).
The programmed death 1 (PD1)–programmed death ligand 1 (PD-L1) signaling axis was one of the first to be addressed successfully for immune checkpoint therapy. Binding T-cell PD1 by tumor cell PD-L1 inhibits cytotoxic antitumor activity and aids tumor immune evasion. Inhibition of PD1 binding on T cells can revert this tumor-mediated immune remodeling and unleash an effective antitumor immune response. Albeit frequently successful, the therapy fails in a significant number of patients, and so far, a means to safely identify those patients who are likely to benefit is lacking. A first attempt was to visualize PD-L1 directly, using the therapeutic agents as tracers for identification of PD-L1–positive tumors (42).
In vivo imaging of the effector cells, endogenous helper CD4-positive cells, and cytotoxic CD8-positive cells has been realized by immuno-PET detecting 89Zr-labeled anti-CD4 and anti-CD8 antibody fragments (43,44).
Because T cells exert many of their effects via membrane-bound receptor interaction, membrane labels can already inhibit cell function and viability at relatively low doses, as has been shown with anti-CD4 diabodies for 89Zr-driven PET (45).
NK CELLS
Several techniques for imaging NK cells in vitro and in vivo, focusing mainly on direct labeling methods, have been introduced and reviewed elsewhere (46).
Imaging of NK cell marker CD56 using a 99mTc-labeled anti-CD56 allowed for estimation of tumor-infiltrating NK cell abundance; in vivo imaging signals correlated with good prognosis (47).
In accordance with T-cell–tracking techniques, trafficking of murine NK cells has been described by radiolabeling of isolated NK cells with 111In-oxine. Although migration was not impaired in exemplary studies, and cell viability and function were allegedly unchanged, the translational potential of NK cell tracking is limited by high background activity, reported for 111In-oxine–driven approaches (47).
CONCLUSION
In recent years, the cellular and molecular composition of the TME, as well as interactions between tumor and TME components, became increasingly relevant for cancer research and tumor therapy. It is well known that various infiltrating immune cells either promote or hamper tumor growth and therefore have a significant influence on cancer prognosis.
Novel treatment strategies—among them, highly expensive regimens—require biomarkers for estimation and continuous measurement of the malignant potential or treatment response. Thus, noninvasive in vivo imaging approaches that allow for visualization of specific components of the TME are essential to gain a further understanding of tumor pathogenesis and tumor–immune interaction. An ideal imaging technology in this context addresses endogenous imaging targets specifically and noninvasively and permits longitudinal measurements after a single dose of a tracer. Rapid tracer elimination reduces nonspecific accumulation in the liver or kidneys and prevents accumulation errors in target tissue in cases of repeated examinations. Several imaging approaches targeting either immune cells directly or soluble factors, reflecting the activity of TME components, have been developed and already have shown promising results. Although the ideal imaging agent for the TME has yet to be developed, the results of current research underline the great potential for clinical translation.
A frequent limitation of current research on cancer imaging is the use of xenograft models for cell-tracking studies to image immune cell infiltration. Animals in this context lack a completely developed immune system and consequently exhibit an altered composition of the TME.
Nevertheless, in vivo imaging represents an excellent tool for real-time visualization of tumor–immune interaction, contributing to a better understanding of tumor biology and—potentially—better estimation and monitoring of therapy effects. However, further research is needed and can help raise personalized cancer diagnostics to the next level.
DISCLOSURE
Anne Helfen is funded by a research grant from the Medical Faculty of the University of Muenster. No other potential conflict of interest relevant to this article was reported.
Footnotes
Published online Dec. 7, 2017.
- © 2018 by the Society of Nuclear Medicine and Molecular Imaging.
REFERENCES
- Received for publication July 7, 2017.
- Accepted for publication November 14, 2017.


Jump to section
Related Articles
Cited By...
- No citing articles found.