


Abstract
As one of the major organs of the excretory pathway, the kidneys represent a frequent source of radiopharmaceutical uptake in both diagnostic and therapeutic nuclear medicine. The unique organization of the functional tissues of the organ ensures transient changes in suborgan localization of renal activity. Current single-region dosimetric models of the kidneys, however, force the assumption of a uniform distribution of radioactivity across the entire organ. The average absorbed dose to the kidneys predicted by such models can misrepresent local regional doses to specific substructures. Methods: To facilitate suborgan dosimetry for the kidneys, 6 new age-dependent multiregion kidney models are presented. The outer dimensions of the models conform to those used currently in single-region kidney models, whereas interior structures are defined for the renal cortex, the medullary pyramids with papillae (2 vertical and 3 horizontal), and the renal pelvis. Absorbed fractions of energy were calculated for both photon and electron sources (10 keV to 4 MeV) located in each source region within the 6 age-dependent models. The absorbed fractions were then used to assemble S values for radionuclides of potential interest in suborgan kidney dosimetry. Results: For the adult, the absorbed dose to the renal cortex for 90Y-labeled compounds retained within that subregion is ∼1.3 times that predicted by the single-region kidney model, whereas the medullary dose is only 26% of that same single-region value. For compounds that are rapidly filtered in the kidneys, the renal cortex dose is approximately one-half of that predicted under the single-region model, whereas the tissues of the medullary pyramids receive an absorbed dose 1.5–1.8 times larger. Conclusion: The multiregion model described here permits estimates of regional kidney dose not previously supported by current single-region models. Full utilization of the new model, however, requires serial imaging of the kidneys with regions of interest assigned to the renal cortex and medulla.
Radiopharmaceuticals used in diagnostic and therapeutic nuclear medicine are generally delivered to the patient via intravenous injection. Because the kidneys serve as the major excretory organ of the body where toxins, metabolic wastes, and excess ions are removed from the bloodstream, radioactivity uptake and local tissue irradiation will consistently be observed in this organ. Other organs, such as the liver or the spleen, concentrate radioactive materials fairly uniformly at the macroscopic level. However, because of its unique physiology, the kidneys are seen to concentrate radioactivity nonuniformly (1–3). For materials that are readily filtered by the kidneys, radioactivity is initially concentrated within the renal cortex, followed by sequential concentration in the outer medulla, inner medulla, papillae, and renal pelvis. After absorption of water in the inner medulla, radioactivity is intensely concentrated within the papillary ends of the medullary pyramids. Other substances, however, may bind to the tissues of the renal tubules, and, thus, persistent concentrations of radioactivity can be seen in the renal cortex.
Kidney toxicity has been observed in both animal studies (4,5) and human clinical trials of radioimmunotherapy agents (6). Consequently, absorbed dose estimates are needed for use in radionuclide therapy treatment planning. Kidney dosimetry is typically conducted using single-region models (7) that require the assumption of a uniform activity concentration and permit only the estimate of the mean absorbed dose to the organ. When 3-dimensional (3D) emission tomography data are available, the MIRD schema can be applied for nonuniform distributions of uptake in the kidneys using voxel-based radionuclide S values (8). In this MIRD pamphlet, a revised multiregion model of the kidney is presented that permits an intermediate level of dosimetry by explicitly delineating the renal cortex, medullary pyramids, medullary papillae, and renal pelvis as potential source or target regions. Absorbed fractions for both photon and electron sources are presented along with S values for radionuclides of interest for both diagnostic and therapeutic imaging and in radionuclide therapy. The pamphlet concludes with a brief discussion of kidney dose-response data, taken primarily from experiences in external beam radiotherapy.
KIDNEY ANATOMY AND PHYSIOLOGY
The kidneys lie between the dorsal body wall and the parietal peritoneum within the superior lumbar region. The lateral surface of each kidney is convex. Its medial surface is concave encompassing a vertical cleft, the renal hilus, which leads to a space interior to the kidney called the renal sinus. Structures such as the ureters, renal blood vessels, lymphatics, and nerves enter and exit the kidney at the hilus and occupy the sinus.
Internally, the kidneys may be divided into 3 distinct anatomic regions as shown in Figure 1 (9). The most superficial region is the renal cortex, which is light in color and has a granular appearance. Deep with respect to the cortex is the darker renal medulla composed of cone-shaped tissue masses called medullary pyramids. The base of each pyramid faces toward the cortex and the apex, or papilla, points internally to the kidney hilus. The pyramids appear striped as they are formed almost entirely by roughly parallel bundles of microscopic urine-collecting ducts. Separating the pyramids are deeper penetrations of the cortex (renal columns). Each medullary pyramid and its adjacent cap of cortical tissue constitute 1 of ∼6–18 lobes of the kidney. Lateral to the hilus within the renal sinus is the renal pelvis: a flat, funnel-shaped tube that is continuous with the ureter as it leaves the hilus. Branching extensions of the pelvis form 2 or 3 major calyces, each of which subdivides to form several minor calyces, cup-shaped areas that enclose the papillae of the pyramids. The calyces collect urine that drains continuously from the papillae and is emptied to the renal pelvis. Urine then flows through the renal pelvis and into the ureter, where it is transported to the urinary bladder.

Anatomic diagram of kidney. (Adapted from Figure 26.3 with permission of (9).)
The microanatomy of the kidneys is dominated by 2 structures: (1) nephrons, which are the functional units that perform blood filtration and urine formation, and (2) the collecting ducts, each of which collects urine from several nephrons and conveys it to the renal pelvis. Each nephron is composed of a glomerulus (cluster of capillaries) encased within a capsule structure and connected to a renal tubule. The glomerular capsules are located within the renal cortex, whereas the renal tubules (carrying the filtrate) begin as the proximal convoluted tubules and then form hairpin loops (Loop of Henle) that penetrate into the adjacent medullary pyramid. These penetrations into the medulla are small for cortical nephrons (constituting ∼85% of all nephrons) but are substantial for juxtamedullary nephrons, whose glomeruli lie just lateral to the cortical-medullary junction. The ascending limbs of the tubules return the filtrate (which now becomes newly formed urine) to within the renal cortex, where they form the distal convoluted tubules. Urine is then sent by the collecting ducts back through the medullary pyramids and into the renal pelvis.
REVIEW OF PUBLISHED DOSIMETRIC MODELS OF KIDNEYS
In 1969, Snyder et al. published MIRD Pamphlet No. 5, the first standardized anthropomorphic computational model of the adult (10). In this model, the kidneys were represented as 2 symmetric ellipsoids cut by a plane with no differentiation of their internal structure. The mass and volume of both kidneys were taken to be 288 g and 288 cm3, respectively, for unit density tissue. This mass is relatively consistent with the 310-g kidney mass of the Reference Man as given in ICRP Publication 23 (11). In MIRD Pamphlet No. 5, absorbed fractions of energy were tabulated for various target organs and a uniformly distributed source of photons in both kidneys.
In the subsequent revision to the MIRD Pamphlet No. 5 adult model (12), the geometry of the kidneys remained the same. A change in the tissue density to 0.98 g cm−3 resulted in a corresponding change of total kidney mass to 284.2 g. In MIRD Pamphlet No. 5 Revised, the kidneys were also considered as a uniform photon source for the tabulation of specific absorbed fractions of energy. These values were also used in tabulating radionuclide S values for the adult anthropomorphic model in MIRD Pamphlet No. 11 (13).
In 1980, Cristy published a series of anthropomorphic computational models representing a newborn, 1 y old, 5 y old, 10 y old, 15 y old (also representing a female), and an adult (14). The geometric representation of the kidneys was taken to be the same as that in the adult MIRD Pamphlet No. 5 Revised model. For the adult, the only change made was an increase in the density of soft tissue to 1.04 g cm−3, giving a revised total kidney mass of 299 g. Kidney volumes for the younger ages were derived on the basis of reference kidney masses published in ICRP Publication 23 (11). In 1987, Cristy and Eckerman published absorbed fractions of energy for monoenergetic photon sources originating from various source organs within these 6 anthropomorphic models (7). In their calculations, the kidneys were considered as both a uniform source and a target region.
The only nonuniform computational model of the kidney was published in 1969 by McAfee (1). To calculate the radiation dose for radionuclides excreted by the kidneys, McAfee represented each kidney as 3 regions: the renal cortex and medulla, represented as 2 concentric elliptic shells, and the renal pelvis, represented as a wedge-shaped hollow structure at the center of each kidney. Individual medullary pyramids were not considered. The volume of each kidney was taken as 151 cm3 for a mass of 151 g. The corresponding dimensions of the cortex, medulla, and pelvis were derived from percentage volume measurements on 1 human kidney, later published in ICRP Publication 23 (11). The volume of the cortex was measured as 70% of the total kidney volume, the medulla as 25%, and the collecting system (pelvis) as 5%. Although the McAfee model was thus available for making nonuniform kidney dose estimates, the model has not been widely adopted in nuclear medicine dose estimates, primarily due to lack of imaging techniques needed to quantify differential kidney uptake in vivo.
DESCRIPTIONS OF REVISED DOSIMETRIC MODELS
The new series of dosimetric kidney models provides suborgan definitions not previously considered in the MIRD Pamphlet No. 5 Revised adult kidney model (12) or in the Oak Ridge National Laboratory (ORNL) kidney series (7,14). In the following section, equations describing each region within the kidney model series are given using the Cartesian coordinate system defined for the full anthropomorphic mathematic models. In this system, the models are assumed to be erect, with the origin taken as the center of the base of the trunk, the positive x-axis directed to the model’s left, the positive y-axis toward the model’s back, and the positive z-axis upward toward the model’s head. Within this coordinate system, the equations for each kidney region are given in their most general form. Definitions for the variables used in these equations are given in Table 1. Furthermore, values of these variables for the different age-specific models are listed within Table 2.
Description of Parameters Used in Mathematic Equations of Kidney Regions
Mathematic Parameters for Regions of Kidney Model for All Ages (cm)
The new model is formed of 12 regions for each kidney: 5 medullary pyramids, 5 papillae, the renal pelvis, and the renal cortex. The number of medullary pyramids in the model is less than that seen in the real anatomy (6–18 pyramids) and represents a compromise between mathematic simplicity needed for Monte Carlo transport calculations and the need for an improved anatomic representation over the concentric ellipsoid-shell model of McAfee (1). Each region is derived from dimensions and volumes given in ICRP Publication 23 (11) for both the newborn and the adult. For the other ages, the volume ratios between the different kidney subregions are assumed to remain constant: ∼70% of the total kidney volume is assumed to be cortex, ∼25% medulla, ∼4% pelvis, and ∼1% papillae. Table 3 gives the volume of each kidney subregion for the 6 different ages considered. The elemental composition of the kidney tissues, given in Table 4, is assumed to be uniform and is taken as soft tissue (as defined in (7)).
Volumes of Regions Defined Within Kidney Models (cm3)
Elemental Composition of Soft Tissue
Outside Shape of Kidney Models
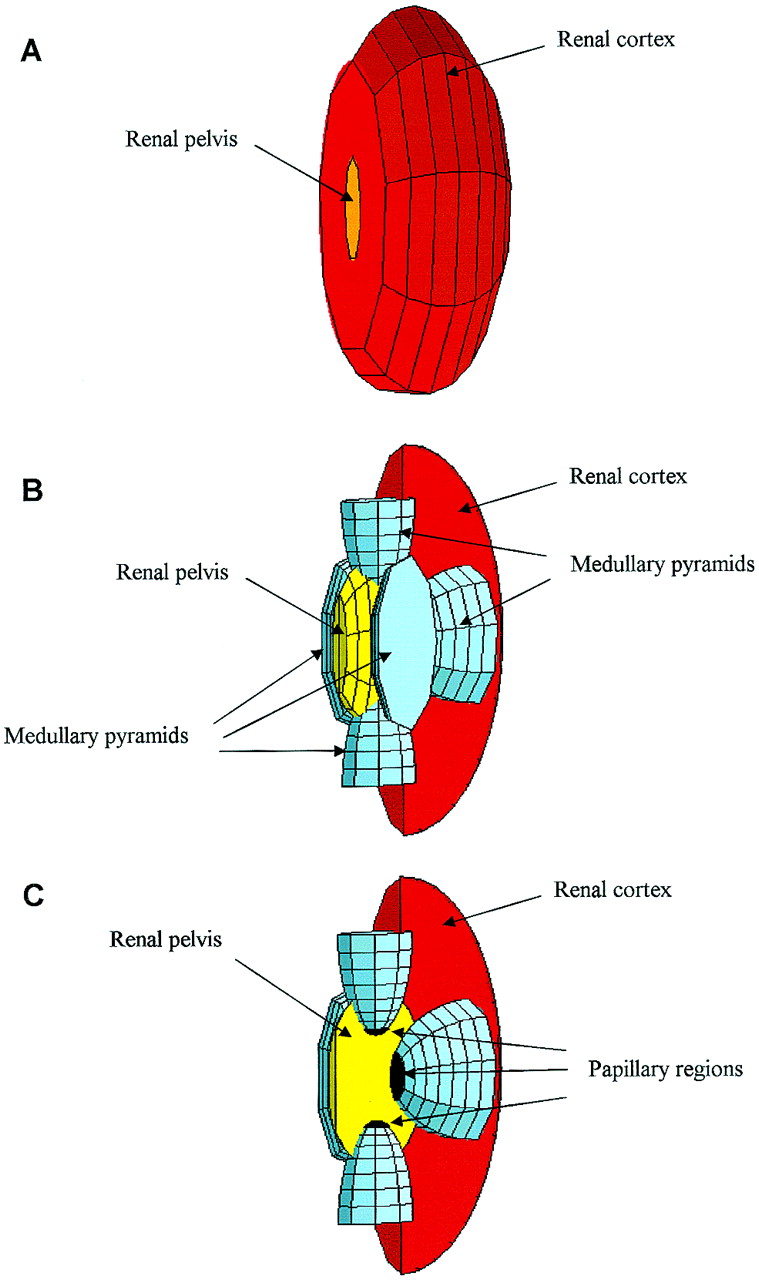
The uniform kidney model included within the ORNL phantom series (7) is used to define the outer shape of the new kidney model series. Each kidney is modeled as an ellipsoid cut by a plane perpendicular to the x-axis. Both kidneys are symmetrically positioned relative to the (y, z) plane. A 3D representation of the kidneys can be seen in Figure 2A. Equation 1 defines the outer dimensions of each kidney. The ± sign is used to indicate either the right (+) or left (−) kidney, respectively:
 Eq. 1
Eq. 1

Three-dimensional representation of computational kidney model. (A) Exterior portion of ellipsoid representing kidney is seen with, at cutting plane, renal pelvis. (B) Cut through kidney reveals 5 medullary pyramids, renal pelvis at organ’s center, and surrounding renal cortex. (C) Cut through pelvis shows medullary pyramids within pelvis. One medullary pyramid is removed to reveal papillae at apex of each pyramid.
Medullary Pyramids and Papillae
The human kidney contains between 8 and 18 medullary pyramids separated by the renal columns of the cortex. To account for the large surface of contact between the medullary pyramids and the renal cortex, as well as the papillae and the renal pelvis, 5 half-ellipsoids are used in the present model for each kidney. Each ellipsoid represents a single medullary pyramid, and at its tip the papilla tissues are defined. Two half-ellipsoids are oriented vertically along the z-axis. The remaining 3 half-ellipsoids are oriented horizontally with 2 along the y-axis and 1 along the x-axis. The thickness of the papillae tissue layer (dPa) at the apex of each medullary pyramid is constant for all 5 ellipsoids and is given in Table 2. Three-dimensional representations of the medullary pyramids and their papillae within the kidney model are shown in Figures 2B and 2C. The defining equations are shown below. The ± sign is used to indicate either the right (+) or left (−) kidney, respectively.
The vertical medullary pyramids are represented by the following 2 expressions:
 Eq. 2 and
 Eq. 3
Eq. 3
In each kidney, the medullary tissues of the vertical pyramids are located between zMe-v1 and (zMe-v1 − cMe-v + dPa) within the superior pyramids and between zMe-v2 and (zMe-v2 + cMe-v − dPa) within the inferior pyramids. Similarly, the papillae are located between (zMe-v1 − cMe-v + dPa) and (zMe-v1 − cMe-v) within the superior pyramids and between (zMe-v2 + cMe-v − dPa) and (zMe-v2 + cMe-v) within the inferior pyramids.
The horizontal medullary pyramids oriented along x-axis are defined by the expression:
 Eq. 4 The medullary tissues of the x-axis-oriented horizontal pyramids are located between ∓xMe-X and (∓xMe-X ± aMe-X ∓ dPa) with the upper and lower signs signifying the right and left kidney, respectively. Similarly, the papilla of these same pyramids are located between (∓xMe-X ± aMe-X ∓ dPa) and (∓xMe-X ± aMe-X).
Finally, the horizontal pyramids oriented along the y-axis are represented by the following 2 equations:
 Eq. 5
Eq. 5
 Eq. 6 The medullary tissues of the y-axis-oriented horizontal pyramids are located between yMe-Y1 and (yMe-Y1 − bMe-Y + dPa) for the posterior pyramids and between yMe-Y2 and (yMe-Y2 + bMe-Y − dPa) for the anterior pyramids. Similarly, the papillae are located between (yMe-Y1 − bMe-Y + dPa) and (yMe-Y1 − bMe-Y) for the posterior pyramids and between (yMe-Y2 + bMe-Y − dPa) and (yMe-Y2 + bMe-Y) for the anterior pyramids.
Renal Pelvis
The renal pelvis is defined as a portion of an ellipsoid within the whole kidney. The center of this ellipsoid is located at the same y- and z-position as the center of the whole kidney. Part of this ellipsoid overlaps the medullary pyramids and their papillae. A 3D representation of the renal pelvis can be seen in Figure 2. The following equations define the renal pelvis.
The defining ellipsoid and cutting planes for the renal pelvis are given as:
 Eq. 7 whereas the expressions that exclude the overlapping volumes of the medullary pyramids with papillae are given as:
 Eq. 8
Eq. 8
 Eq. 9
Eq. 9
 Eq. 10
 Eq. 11
 Eq. 12
Renal Cortex
The renal cortex is defined as the tissues both superficial and interstitial to the medullary pyramids, in which the latter defines the renal columns. Computationally, the renal cortex is defined as the whole kidney less the volumes occupied by the renal pelvis, medullary pyramids, and papillae.
ABSORBED FRACTIONS OF ENERGY
To simulate the transport of photon and electron particles within the present series of kidney models, the Monte Carlo electron-photon transport code EGS4 (15,16) is used. Additionally, the trunk region as defined in the ORNL phantom series is added to the simulation geometry to keep track of the energy escaping the kidneys. The methodology to calculate absorbed fractions of energy with a corresponding SD as described in MIRD Pamphlet No. 15 is used (17).
Absorbed fractions of energy, listed within Appendix A, are calculated for both monoenergetic photon and electron sources by considering 12 energies ranging from 10 keV to 4 MeV. A total of 1,000,000 source particles are simulated for each energy and source combination (10 runs of 100,000 particles). Source regions include uniform distributions within the renal cortex, the renal medulla, the renal pelvis, and the renal papillae. Target regions include these same 4 regions as well as the tissue regions outside the kidneys (trunk region). Footnotes at the bottom of the tables in Appendix A indicate when the coefficients of variation (CVs) on the absorbed fraction exceed 30%.
RADIONUCLIDE S VALUES
The mean absorbed dose to the target region per unit cumulated activity in the source region (S value) is calculated for a variety of radionuclides of interest in nuclear medicine. These results are listed in Appendix B. The list of radionuclides and source regions considered is shown in Table 5. In these calculations, the radionuclide decay data files of Eckerman et al. (18,19) have been used, in which the β-particle and positron energy spectra are finely divided into logarithmic intervals. The absorbed fractions for photon sources are used for all photon radiation components of the decay scheme. The absorbed fractions for electron sources are used for all β-particle and positron radiation components.
Radionuclides Used for Calculation of Radionuclide S Values
DISCUSSION
Values of radionuclide S values given in Appendix B may be used to compare regional kidney doses to values obtained by the standard single-region model. Under the present multiregion model, the mean dose per unit administered activity, A0, to tissues of the renal cortex is given as:
 Eq. 13 where τcort, τmed, and τpel represent the residence times in the renal cortex, medulla, and pelvis, respectively. For the present example, residence times in the small volumes of the medullary papillae are not considered. In addition, values of τcort and τmed correspond to uptake in both the organ’s blood pool as well as the parenchyma. In the single-region kidney model, the mean dose across the whole organ is determined as:
 Eq. 14 where τkidney represents the total resident time in the kidney (τcort + τmed + τpel). Dividing Equation 13 by Equation 14 yields the ratio of renal cortex dose to average kidney dose for a fixed administered activity and total kidney residence time:
 Eq. 15 where fcort, fmed, and fpel represent the fractional residence times within the renal cortex, medulla, and pelvis, respectively. A similar expression can be derived for the renal medulla as a target region.
Table 6 presents values of dose ratios given by Equation 15 for compounds labeled with 90Y as a function of the percentage total residence time assigned to the renal medulla and renal pelvis. The difference in any combination of fractional residence times is assigned to the renal cortex. Consequently, for compounds that are filtered by the glomerular capsules and then concentrated in the tubules of the renal cortex, the cortex dose is shown to be 1.29 times that predicted by the single-region model (fmed and fpel are 0%). Likewise, the dose to the medullary tissues is only 26% of that predicted by D̄kidney-single region. For compounds that are rapidly filtered in the kidneys and then rapidly transported without tubular accumulation, Table 6 shows that the dose to the renal cortex decreases to only 48% of that predicted by the single-region model, whereas the tissues of the medulla may approach a factor of 1.88 times as great.
Ratios of Absorbed Dose from 90Y-Labeled Compounds to Renal Cortex or Renal Medulla, as Determined by Multiregion Kidney Model, to Mean Kidney Dose Assessed in Single-Region Model
Corresponding dose ratios are shown in Table 7 for compounds labeled with 131I. For compounds exhibiting specific renal uptake in proximal or distal tubules, the dose enhancement to the cortex is similar to that for 90Y (dose ratio of 1.27), whereas the dose to the renal medulla is only 10% of the mean kidney dose. For compounds filtered by the glomeruli, the mean dose to the kidneys is representative of the cortex dose only when ∼80% of the kidney residence time is assigned to the renal cortex (fmed + fpel = 20%). The mean kidney dose is representative of the medullary dose only when ∼30% of the total residence time is within the renal medulla.
Ratios of Absorbed Dose from 131I-Labeled Compounds to Renal Cortex or Renal Medulla, as Determined by Multiregion Kidney Model, to Mean Kidney Dose Assessed in Single-Region Model
Source Located in Renal Cortex of Newborn
Source Located in Renal Medulla of Newborn
Source Located in Renal Pelvis of Newborn
Source Located in Renal Papillae of Newborn
Source Located in Renal Cortex of 1 Year Old
Source Located in Renal Medulla of 1 Year Old
Source Located in Renal Pelvis of 1 Year Old
Source Located in Renal Papillae of 1 Year Old
Source Located in Renal Cortex of 5 Year Old
Source Located in Renal Medulla of 5 Year Old
Source Located in Renal Pelvis of 5 Year Old
Source Located in Renal Papillae of 5 Year Old
Source Located in Renal Cortex of 10 Year Old
Source Located in Renal Medulla of 10 Year Old
Source Located in Renal Pelvis of 10 Year Old
Source Located in Renal Papillae of 10 Year Old
Source Located in Renal Cortex of 15 Year Old
Source Located in Renal Medulla of 15 Year Old
Source Located in Renal Pelvis of 15 Year Old
Source Located in Renal Papillae of 15 Year Old
Source Located in Renal Cortex of Adult
Source Located in Renal Medulla of Adult
Source Located in Renal Pelvis of Adult
Source Located in Renal Papillae of Adult
Source Located in Cortex of Newborn
Source Located in Medulla of Newborn
Source Located in Pelvis of Newborn
Source Located in Papilla of Newborn
Source Located in Cortex of 1 Year Old
Source Located in Medulla of 1 Year Old
Source Located in Pelvis of 1 Year Old
Source Located in Papilla of 1 Year Old
Source Located in Cortex of 5 Year Old
Source Located in Medulla of 5 Year Old
Source Located in Pelvis of 5 Year Old
Source Located in Papilla of 5 Year Old
Source Located in Cortex of 10 Year Old
Source Located in Medulla of 10 Year Old
Source Located in Pelvis of 10 Year Old
Source Located in Papilla of 10 Year Old
Source Located in Cortex of 15 Year Old
Source Located in Medulla of 15 Year Old
Source Located in Pelvis of 15 Year Old
Source Located in Papilla of 15 Year Old
Source Located in Cortex of Adult
Source Located in Medulla of Adult
Source Located in Pelvis of Adult
Source Located in Papilla of Adult
Radionuclide S values for the single-region model are 4.87 × 10⁻⁴ and 1.64 × 10⁻⁴ mGy MBq−1 s−1 for 90Y and 131I, respectively. Consequently, for the total kidney residence times of 0.5, 1.0, 2.0, and 3.0 h, the mean kidney dose per unit administered activity is 0.877, 1.75, 3.51, and 5.26 mGy MBq−1, respectively, for 90Y and 0.294, 0.589, 1.18, and 1.77 mGy MBq−1, respectively, for 131I. These values may then be used to assign absorbed doses to the renal cortex and medulla given the relative dose ratios shown in Tables 6 and 7.
Full utilization of the new model requires serial imaging of the kidneys with regions of interest assigned to the renal cortex and medulla. Whereas the inherent radiosensitivity of the kidneys is defined at the cellular level, the multiregion model can also be used to aid in predicting potential biologic response. If the dose-limiting cells of the kidneys are those of the glomeruli, proximal convoluted tubules, or distal convoluted tubules, then the appropriate radiation target in the new model is the renal cortex. If, however, the dose-limiting cells are those of the collecting ducts, the appropriate target region in the revised model is the renal medulla. A more extensive treatment of kidney dose nonuniformity can also be pursued using emission tomography to assess renal activity uptake and retention coupled with tissue volume measurements via CT. Full 3D assessments of kidney tissue dose can then be made through a convolution of voxel-based radionuclide S values with voxel-based measurements of the cumulated activity (8).
KIDNEY DOSE-RESPONSE
The largest source of cellular, animal, and human dose-response data collected over the last century for all nontarget organs resides in the experience of external beam irradiation. Radiobiologic data for kidney tolerance in animals and humans are well established given knowledge of the fractional volume of the particular kidney irradiated, the fractionation scheme, and the dose rate applied (20–32). Emami et al. (20) found that the tolerance dose (TD) was 23 Gy for bilateral whole-kidney external beam irradiation if delivered within 5 wk. This value is widely quoted to yield symptoms of radiation nephritis in 5% of the population within 5 y (TD5/5). Similarly, 28 Gy is quoted to yield symptoms of radiation nephritis in 50% of the population within 5 y (TD50/5). Mohan et al. (33), Burman et al. (34), Lyman (35), Olsen et al. (36), and Yorke et al. (37) found dose-volume histograms useful in the prediction of the probability of normal tissue complications when single kidneys received partial or nonuniform irradiation. Because both kidneys are irradiated in radionuclide therapy, important differences may be noted from the external beam experience.
The applicability of external beam dose-response data to radionuclide therapy agents is still under active investigation (38). Fowler (39), Langmuir et al. (40), and Dale (41) have reviewed the differences in response of tumors and normal tissues to both external beam therapy and radioimmunotherapy. A further review of the biologic considerations of internal emitters, including the use of response models based on external beam data, is given in Chapter 2 of Report 67 of the International Commission on Radiation Units and Measurements (42).
The age-dependent multiregion kidney model series presented here has been developed to provide a computational tool for investigators who wish to anticipate and, thereby, avoid renal toxicity associated with several radionuclide therapy regimens (4,6,43–48). Reasons that prompted the development of this model were the recognition that most radiopharmaceuticals were not uniformly distributed in the kidneys and that the resulting effect of nonuniformity in kidney absorbed dose would likely not be consistent with dose averaged across the entire organ volume. To obtain more accurate dose-response relationships for kidney toxicity, the investigator may need to acquire subregion time-activity data that better resolve cortex and medulla radioactivity. PET or SPECT imaging, and perhaps even serial planar scintillation camera imaging, along with CT data on tissue volumes, will allow the investigator to quantify the radioactivity concentration in various kidney subregions for subsequent use with the present multiregion model. For voxel-based applications of the MIRD schema (8), only PET or SPECT imaging would suffice. The characterization of absorbed dose nonuniformity within the kidneys is perhaps the most direct initial step in the development of predictive models of kidney response. In specific clinical circumstances, several other factors, including administration protocols (time and amounts of radionuclide, chemotherapy, total body irradiation, and marrow rescue), clearance kinetics, dose rate, differential subregion tissue radiosensitivity, and prior drug exposure, may need to be included in models developed to provide a strong correlation with renal toxicity observed in patients. Many investigators (39–41,49,50) have applied a linear quadratic model (51) to evaluate the role of dose rate and tissue radiosensitivity, in addition to absorbed dose, in improving the prediction of biologic response in radionuclide therapy to organs such as the kidneys. Recent studies have focused attention on kidney toxicity in radionuclide therapy (45–47), indicating that a lack of consideration of these factors may lead to an underestimate of the magnitude and timing of the clinical dose-response (48). Use of either the revised multiregion kidney model with serial planar imaging or the 3D voxel-based S values coupled with 3D SPECT or PET imaging will yield improved nonuniform dosimetry data as needed for the development of any predictive radiobiologic model of kidney dose-response.
CONCLUSION
Six new stylized mathematic models of the kidney are presented for use in internal dose assessment for both diagnostic and therapeutic nuclear medicine procedures. These models permit the consideration of both nonuniform distributions of renal uptake and suborgan dose assessment to the renal cortex, medullary pyramids, and renal papillae. In the new model, the renal cortex dose is considered representative of the mean dose to the glomeruli and the proximal or distal collecting tubules. The renal medulla dose is considered representative of the mean dose to the ascending or descending tubules and collecting ducts.
For the adult, the absorbed dose to the renal cortex for 90Y-labeled compounds retained within that subregion is ∼1.29 times that predicted by the single-region kidney model, whereas the medullary dose is only 26% of that same single-region value. For compounds that are rapidly filtered in the kidneys, the renal cortex dose is approximately one-half of that predicted under the single-region model, whereas the tissues of the medullary pyramids receive an absorbed dose 1.5–1.8 times larger.
Acknowledgments
This work was supported in part by the U.S. Department of Energy, Office of Health and Environmental Research, grant DE-FG05-95ER62006, with the University of Florida.
Footnotes
Received Oct. 31, 2002; revision accepted Mar. 21, 2003.
For correspondence or reprints contact: Wesley E. Bolch, PhD, Department of Nuclear and Radiological Engineering, University of Florida, Gainesville, FL 32611-8300.
E-mail: wbolch{at}ufl.edu
↵* In collaboration with the MIRD Committee of the Society of Nuclear Medicine: Evelyn E. Watson (Chair), Wesley E. Bolch (Task Group Leader), A. Bertrand Brill, N. David Charkes, Darrell R. Fisher, Marguerite T. Hays, Ruby Meredith, George Sgouros, Jeffry A. Siegel, Stephen R. Thomas, and Barry W. Wessels
REFERENCES
In this issue


Jump to section
Related Articles
Cited By...
- A Realistic Multiregion Mouse Kidney Dosimetry Model to Support the Preclinical Evaluation of Potential Nephrotoxicity of Radiopharmaceutical Therapy
- In Vitro-to-In Vivo Extrapolation of Transporter-Mediated Renal Clearance: Relative Expression Factor Versus Relative Activity Factor Approach
- Developing and Implementing an Imaging Optimization Study in Pediatric Nuclear Medicine: Experience and Recommendations from an IAEA-Coordinated Research Project
- Development of 64Cu-NOTA-Trastuzumab for HER2 Targeting: A Radiopharmaceutical with Improved Pharmacokinetics for Human Studies
- The Importance of Incorporating OCT2 Plasma Membrane Expression and Membrane Potential in IVIVE of Metformin Renal Secretory Clearance
- Optimizing Image Quantification for 177Lu SPECT/CT Based on a 3D Printed 2-Compartment Kidney Phantom
- Design and Fabrication of Kidney Phantoms for Internal Radiation Dosimetry Using 3D Printing Technology
- MIRD Pamphlet No. 25: MIRDcell V2.0 Software Tool for Dosimetric Analysis of Biologic Response of Multicellular Populations
- Study of the Impact of Tissue Density Heterogeneities on 3-Dimensional Abdominal Dosimetry: Comparison Between Dose Kernel Convolution and Direct Monte Carlo Methods
- 4-Step Renal Dosimetry Dependent on Cortex Geometry Applied to 90Y Peptide Receptor Radiotherapy: Evaluation Using a Fillable Kidney Phantom Imaged by 90Y PET
- MIRD Pamphlet No. 20: The Effect of Model Assumptions on Kidney Dosimetry and Response--Implications for Radionuclide Therapy
- Radiation Dose Distribution in Human Kidneys by Octreotides in Peptide Receptor Radionuclide Therapy
- Dosimetry in Peptide Radionuclide Receptor Therapy: A Review
- Bone Marrow Transplantation Nephropathy after an Intensified Conditioning Regimen with Radioimmunotherapy and Allogeneic Stem Cell Transplantation
- Therapeutic Advantage of Pretargeted Radioimmunotherapy Using a Recombinant Bispecific Antibody in a Human Colon Cancer Xenograft
- Renal Tubulointerstitial Changes after Internal Irradiation with {alpha}-Particle-Emitting Actinium Daughters
- OLINDA/EXM: The Second-Generation Personal Computer Software for Internal Dose Assessment in Nuclear Medicine
- Patient-Specific Dosimetry in Predicting Renal Toxicity with 90Y-DOTATOC: Relevance of Kidney Volume and Dose Rate in Finding a Dose-Effect Relationship
- Practical Dosimetry of Peptide Receptor Radionuclide Therapy with 90Y-Labeled Somatostatin Analogs
- Dosimetry of Internal Emitters
- Pharmacokinetics, Dosimetry, and Toxicity of the Targetable Atomic Generator, 225Ac-HuM195, in Nonhuman Primates