


Visual Abstract

Abstract
Fibroblast activation protein inhibitor (FAPI) is an ideal diagnostic and therapeutic target in malignant tumors. However, the knowledge of kinetic modeling and parametric imaging of 68Ga-FAPI is limited. Purpose: The purpose of this study was to explore the pharmacokinetics of 68Ga-FAPI-04 PET/CT in pancreatic cancer and gastric cancer and to conduct parametric imaging of dynamic total-body data compared with SUV imaging. Methods: Dynamic total-body 68Ga-FAPI-04 PET/CT was performed on 13 patients. The lesion time–activity curves were fitted by 3-compartment models and multigraphical models. The kinetics parameters derived from the 2-tissue reversible compartment model (2T4K) and multigraphical models were analyzed. Parametric  imaging was generated using the 2T4K and Logan models, and their performances were evaluated compared with SUV images. Results: 2T4K had the lowest Akaike information criterion value, and its fitting curves matched excellently with the origin time–activity curves. Visual assessment revealed that the
  (2T4K) images and
  (Logan with spatial constraint [SC]) images both showed less image noise and higher lesion conspicuity compared with SUV images. Objective image quality assessment demonstrated that parametric
  (2T4K) images and parametric
  (Logan with SC) images had a 5.0-fold and 5.0-fold higher average signal-to-noise ratio and 3.6-fold and 4.1-fold higher average contrast-to-noise ratio compared with conventional SUV images, respectively. In addition, no significant differences in signal-to-noise ratio and contrast-to-noise of pathologic lesions were observed between parametric
  (2T4K) images and parametric
  (Logan with SC) images (all P > 0.05). Conclusions: The 2T4K model was the preferred compartment model. Total-body parametric imaging of 68Ga-FAPI-04 PET yielded superior quantification beyond SUV with enhanced lesion contrast, which may serve as a promising imaging method to make an early diagnosis, to better reflect tumor characterization, or to allow evaluation of treatment response.
  (2T4K) images are comparable in image quality and consistent to
  (Logan with SC) images in lesions conspicuity; however,
  (Logan with SC) images presented an appealing alternative to
  (2T4K) images because of their simplicity.
Fibroblast activation protein (FAP), specifically binding on cancer-associated fibroblasts, is overexpressed on stromal fibroblasts in more than 90% of epithelial cancers, which makes the FAP inhibitor (FAPI) an excellent molecular probe for tumor diagnosis (1). 68Ga-FAPI PET/CT significantly improved the imaging sensitivity compared with 18F-FDG PET/CT in many malignant tumors including pancreatic cancer (2) and gastric cancer (3). Although FAPI plays an important role in clinical diagnosis, its therapeutic value in clinical work is more concerning. In the study of Lindner et al., 2 patients with metastasized breast cancer were treated with 90Y-FAPI-04, which improved clinical symptoms without side effects (1). Baum et al. reported that 177Lu-FAP-2286 was performed in 11 patients with diverse advanced adenocarcinomas and showed high uptake and long retention in lesions with no observed side effects (4).
To achieve optimal oncologic diagnostics and satisfactory therapy assessment, we need to explore more about the biologic characteristic of the receptor-binding agents in the human body. Dynamic PET with kinetic modeling was reported to potentially provide superior information compared with static PET acquisitions (5). However, the knowledge of kinetic modeling in 68Ga-FAPI-04 is limited. Geist et al. evaluated the kinetic parameters of 68Ga-FAPI for hepatocellular carcinoma using a reversible 2-tissue compartment model in traditional PET/CT (6). However, the kinetic analysis was restricted to the liver region, and whether this kinetic model was also suitable for other pathologic lesions and normal organs entirely was still unknown.
SUV is commonly used in PET quantification analysis. SUV reflects the total activity concentration including the uptake of specific and nonspecific signals and can be easily affected by many factors (7). In contrast, multiparametric dynamic PET analysis via pharmacokinetic modeling and parametric imaging is a powerful absolute quantitation approach offering excess data, which is the more elaborate and robust method for quantification of tracer uptake (5). Early work regarding kinetic modeling and parametric imaging have made great achievements in enhancing parametric image quality (8–10). However, because of limited temporal resolution, sensitivity, and axial field of view coverage in the traditional PET scan, parametric imaging was not feasible, and the pharmacokinetic analysis was restricted to only 1 or 2 regions (8). Uniquely different from the traditional PET scan, the total-body PET/CT scanner provides an opportunity to simultaneously assess the radiotracer distribution in the entire human body with high sensitivity (11), thus tempo-spatially synchronizing the metabolic process of the radiotracer, which would have great prospect in the field of radiotheranostics (5). Recently, the kinetic metrics and parametric imaging has been acquired by 18F-FDG total-body PET (12). However, parametric imaging has not been conducted in 68Ga-FAPI thus far.
Thus, this study has 2 major goals: to investigate the kinetics of 68Ga-FAPI-04 by PET in normal organs and lesions and to evaluate the feasibility and superiority of parametric imaging compared with conventional SUV imaging in pancreatic cancer and gastric cancer by dynamic total-body 68Ga-FAPI-04 PET. This study performed total-body kinetic modeling and evaluated the clinical significance of parametric imaging in 68Ga-FAPI-04 PET.
MATERIALS AND METHODS
Participants
A total of 13 patients (9 pancreatic cancer patients and 4 gastric cancer patients) who were referred to Renji Hospital for 68Ga-FAPI-04 PET/CT from October 2020 to December 2021 were included. The institutional review board of Renji Hospital approved this study, and all subjects signed written informed consent.
Imaging Data Acquisition and Reconstruction
68Ga-FAPI-04 was synthesized by the Renji Nuclear Medicine Laboratory using a procedure as previously described (1). The injected dose was 96.2–163.5 MBq. A low-dose CT scan was conducted for attenuation correction. Patients then underwent a 60-min dynamic PET scanning on a total-body PET/CT (uEXPLORER; United Imaging Health Care) with a bolus injection of 68Ga-FAPI-04 into a vein near the ankle simultaneously as recommended in the expert consensus (13).
The images were corrected for radioactive decay, scatter, attenuation, and random and were reconstructed with an image matrix of 360 × 360 pixels, 4 iterations, and 20 subsets by list-mode ordered-subset expectation maximization algorithm incorporating time-of-flight and point-spread function modeling. The PET data were reconstructed into a total of 92 dynamic frames: 30 × 2 s, 12 × 5 s, 6 × 10 s, 4 × 30 s, 25 × 60 s, and 15 × 120 s (Fig. 1A). The representative maximum intensity projection of the reconstructed PET images is shown in Figure 1B.

Dynamic PET/CT acquisition protocol and schematic representation of compartmental model for 68Ga-FAPI-04. (A) Total-body dynamic 68Ga-FAPI-04 PET/CT acquisition protocol. (B) Reconstructed dynamic total-body PET/CT maximum intensity projection images of 68Ga-FAPI-04 (12 frames). (C) Schematic representation of compartmental model for 68Ga-FAPI-04.
Image Postprocessing
The postprocessing of the dynamic PET images was analyzed using PMOD 4.2 software (version 4.206; PMOD Technologies Ltd.). Two experts (J.L. and R.C.) in PET/CT interpretation assessed the pathologic lesions. Differences of opinion between them were resolved by reaching a consensus. The volume of interest was drawn manually over normal organs and pathologic lesions. Pathologic lesions were classified as primary tumors (PT), lymph node metastases (LNM), and other metastases (OM). The volumes of interest were drawn on at least 7 consecutive slices of dynamic PET images, and the time–activity curves were extracted at each frame. Because the previous study showed that patients could achieve perfect image quality when the acquisition time on the uEXPLORER scanner was 2 or 3 min (11), in our study, 5-min acquisition time (55–60 min after injection) was used to evaluate the image quality of SUV images.
The volume of interest was drawn manually over 4 blood pools using an averaged early PET image (0–2 min), including descending aorta (DA), ascending aorta, left ventricle, and right ventricle. Previous study showed that the FAPI-04 is stable for up to 24 h in the blood (1,14,15), exemplifying that metabolic correction can be neglected. Hence, we did not perform metabolic correction in the present study. DA time–activity curve was used as the image-derived input function (IDIF) for kinetic modeling and parametric imaging because it contains a large blood pool (16), and the partial-volume effect on the IDIF is further minimized by ordered-subset expectation maximization with a point-spread function imaging reconstruction algorithm used in the total-body uEXPLORER of high spatial resolution (17–19).
Kinetic Compartmental Model
Three compartment models were fitted to the time–activity curves: a reversible 1-tissue compartment model (Supplemental Data; supplemental materials are available at http://jnm.snmjournals.org), an irreversible 2-tissue compartment model, and 2-tissue reversible compartment model (2T4K). In the 2-tissue compartment model, the tracer in tissue is attributed to 2 different compartments:  represents unspecific bound and free tracer components in tissue, and
  represents the specifically bound tracer components (Fig. 1C).
  , and
, and  were derived from compartment models. The meaning of
  , and
, and  is provided in the Supplemental Data. The fractional blood volume
  was fitted along with the rate constants. The total distribution volume
 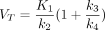 and the net influx rate
  were also calculated.
The Akaike information criterion (AIC) was used as an assessment of the goodness-of-fit; the more appropriate model is the one with the smaller AIC value.
Multigraphical Analysis
In addition to compartment modeling, time–activity curves were analyzed using multigraphical analysis (20). Generally, a Logan plot (21) is applied to reversible tracer kinetics, and a Patlak plot is applied to irreversible tracer kinetics (22). Zhou et al. proposed the relative-equilibrium (RE) plot (23) and the RE plot with the Patlak plot (20) to reduce the bias. The graphic analysis will approach a straight line after sufficient equilibration time; the slope represents the net influx rate  for the Patlak plot and represents the total distribution volume
  for the Logan plot, RE plot, and RE plot with the Patlak plot. Time–activity curves were applied to multigraphical analysis, and
  was derived over all normal organs and lesions. The linear phase
  was fixed at 15 min.
Parametric Imaging
Total-body parametric images of 68Ga-FAPI-04 were generated by 2T4K and the Logan plot using linear regression with the spatial constraint (SC) algorithm with 3-dimensional gaussian filters, with 6- and 9-mm full width at half maximum, respectively. The modified linear least square fitting method incorporated with clustering-based SC was applied (24). DA is used as the input function. The volumes of interest of the liver, muscle, and pathologic lesions were masked over parametric images, and then the voxel-based mean values and SD values were extracted. Those values were used to calculate the signal-to-noise ratio (SNR) and contrast-to-noise ratio (CNR).
The SNR was calculated as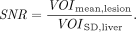
The CNR was calculated as
Statistical Analysis
The statistical evaluation was performed using software R (version 4.2.0; R Core Team 2021). Descriptive data are presented as mean (SD). A Wilcoxon signed-rank test was used to compare the difference between SUV images and parametric images among SNR and CNR. P < 0.05 was considered statistically significant.
RESULTS
Patients’ Characteristics
Thirteen patients were included in this study. A total of 46 lesions (10 PT, 26 LNM, and 10 OM) were included in this study. The PT and LNM were verified by histology and enhanced CT, and OM was confirmed by enhanced CT, MRI, or 18F-FDG PET/CT. The detailed characteristics are shown in Table 1.
Patient Characteristics (n = 13)
Compartment Model Selection
Figure 2 shows representative IDIFs derived from the DA, ascending aorta, left ventricle, and right ventricle. Generally, the IDIF curves are analogous to each other. The right ventricle has a slightly earlier peak than the others; apart from this, it shows good agreement between the trends of the IDIFs.

IDIFs derived from 4 different blood pools. Full IDIFs and peaks of curves are displayed separately. AA = ascending aorta; LV = left ventricle; RV = right ventricle.
The results for evaluating compartment model fitting quality based on the AIC are displayed in Table 2. 2T4K has the lowest mean AIC in most normal organs, except the lung (1-tissue compartment model is the lowest). For pathologic lesions, 2T4K was preferred with the lowest mean AIC. In general, 2T4K provided the best fitting of time–activity curves among the 3-compartment models, and it was the most appropriate model. An example of fitting curves was displayed in Figure 3. The fitted curves generated by 2T4K matched excellently with the origin time–activity curves.
Model Validation Among 3 Compartmental Models Based on AIC for Different ROIs

Time courses and 2-tissue compartmental model fitting of 68Ga-FAPI-04 concentrations in a patient with pancreatic cancer. Lines represent fitted curves, and dots represent origin time–activity curves.
Pharmacokinetics Analyses in Normal Organs and Pathologic Lesions
The kinetic parameters  , and
, and  from 2T4K, the parameter
  from the Patlak plot, and parameter
  from the Logan plot and RE plot are presented in Table 3. Supplemental Figure 1 is the Logan plot, Patlak plot, and RE plot fitting of 68Ga-FAPI-04 concentrations in the lesions of patients with pancreatic cancer.
Kinetic Parameters of 68Ga-FAPI-04 Using 2T4K and Multigraphical Analysis Based on 60-Minute Acquisition
The kinetic parameters varied among organs and lesions. All 3 types of pathologic lesions showed comparable mean  values, with the highest in LNM (0.328 mL/cm3/min), followed by PT (0.285 mL/cm3/min) and OM (0.203 mL/cm3/min). The highest
  values for normal organs were observed in the spleen (1.488 mL/cm3/min). Among all pathologic lesions, LNM had the greatest
  values (0.900/min) followed by PT (0.325/min), and OM (0.252/min). The kidney demonstrated the highest
  value (3.242/min) among all organs. For
  , PT has the greatest
  value of 0.377/min among all lesions, followed by LNM (0.299/min) and OM (0.133/min). The kidney demonstrated the highest
  value (0.588/min) among all organs. For
  , PT had the greatest
  value of 0.039/min among all lesions, followed by LNM (0.028/min) and OM (0.020/min). The kidney demonstrated the highest
  value (0.280/min) among all organs.
Noticeably, for 2T4K, the  values was significantly higher in pathologic lesions than in all healthy organs, with the highest in PT (10.502 mL/cm3), followed by OM (7.275 mL/cm3) and LNM (6.181 mL/cm3). The highest
  values for normal organs were observed in the normal pancreas (2.282 mL/cm3). Similar results were also observed in
  derived from the Logan plot, RE plot with the Patlak plot, and RE plot.
For parameter  from the Patlak plot, PT had the greatest
  value of 0.0661 mL/cm3/min among all lesions, followed by OM (0.0351 mL/cm3/min) and LNM (0.0310 mL/cm3/min). Muscle demonstrated the highest
  value (0.0038 mL/cm3/min) among all organs.
Parametric Imaging
Figure 4 shows parametric images of the  obtained using 2T4K (2T4K image), the Logan plot with SC (Logan with SC image), and the Logan plot (Logan image), together with the corresponding SUV image (55–60 min) of a representative patient with pancreatic cancer. For visual assessment, the 2T4K images and the Logan plot with SC images showed less image noise and higher lesion conspicuity compared with SUV images. Compared with SUV images and Logan images, 2T4K images and the Logan plot with SC images showed less nonspecific signal in typical background regions, such as the blood pool, liver, and kidney. Furthermore, no significant difference in image noise and lesion conspicuity was observed between 2T4K images and the Logan plot with SC images in visual assessment.

Representative SUV images,  (2T4K) images,
  (Logan plot with SC) images, and
  (Logan plot) images of 58-y-old man with pancreatic cancer. (A) Maximum-intensity projection images of SUV and axial fusion diagram combining
  images and CT. (B)
  (2T4K) images. (C)
  (Logan plot with SC) images. (D)
  (Logan plot) images. SNR and CNR of lesions are illustrated below corresponding image.
To evaluate the objective image quality, the comparisons of SNR and CNR among SUV images, 2T4K images, and the Logan plot with SC images (labeled as Logan) are displayed in Figure 5. Consistent with the visual assessment, no significant differences in SNR and CNR of pathologic lesions were observed (all P > 0.05) between the 2T4K images and Logan images.

Comparison of objective image quality between SUV and parametric  images from 2T4K and Logan methods. Comparison of SNR (A) and CNR (B) between SUV images and parametric
  images in PT, LNM, and OM, respectively.
The  from PT showed a significant 5.0-fold higher value compared with the
  from PT (90.20 vs. 18.11, P < 0.001), and the
  from PT showed a significant 5.0-fold higher value than
  (90.91 vs. 18.11, P < 0.001). The
  and
and  from LNM were significantly 4.1-fold (41.52 vs. 10.07, P < 0.001) and 4.4-fold (44.57 vs. 10.07, P < 0.001) higher than
  , respectively. The
  and
and  from OM were significantly 5.1-fold (78.96 vs. 15.54, P < 0.001) and 5.1-fold (78.56 vs. 15.54, P = 0.001) higher than
  (Fig. 5A).
The  and
and  from PT were significantly 3.6-fold (149.29 vs. 40.94, P = 0.007) and 4.1-fold (169.89 vs. 40.94, P = 0.001) higher than
  , respectively. The
  and
and  from LNM were significantly 3.2-fold (62.28 vs. 19.33, P = 0.008) and 3.9-fold (74.81 vs. 19.33, P < 0.001) higher than
  . The
. The  and
and  from OM were significantly 3.4-fold (100.03 vs. 29.24, P = 0.004) and 3.7-fold (109.54 vs. 29.24, P = 0.003) higher than
  (Fig. 5B).
DISCUSSION
This work describes our initial findings with kinetic modeling and parametric imaging of total-body 68Ga-FAPI-04 images using the uEXPLORER scanner. The long-axial PET systems enable capturing rapid kinetics of all normal organs and pathologic lesions with high temporal resolution. Thus, we were able to evaluate the kinetic parameters both in the 2T4K and Logan models and to find the potential clinical applications of parametric imaging in pancreatic cancer and gastric cancer. This study evaluated total-body kinetic modeling and provided clinical significance for parametric imaging in 68Ga-FAPI-04 PET.
Kinetic modeling in 68Ga-FAPI has been evaluated by Geist et al. in traditional PET/CT (6). They suggested that a reversible 2-tissue compartment model was the preferred model to describe the kinetics of 68Ga-FAPI-04 in liver lesions (6). However, whether this kinetic model was also suitable for other pathologic lesions and normal organs was unknown. In this study, we investigated the kinetic metrics using 3 compartmental models on total-body PET/CT. We found that the 2T4K model showed the best model-fitting curves, and the fitted curves generated by 2T4K matched well with the origin time–activity curves. Furthermore,  /min in both healthy organs and lesions also provided evidence to strengthen the selection of 2T4K. To summarize, the 2T4K could be considered the most appropriate model of the kinetics of 68Ga-FAPI-04 in whole-body normal organs and pathologic lesions. Logan plot is a linear method to estimate the
  . The fitting curve of Logan shows better results than Patlak, which is more evidence to support reversible modeling. Therefore, we further compared the image quality and lesion conspicuity between the 2T4K images, the Logan plot, and the SUV image.
Our study demonstrated that the 2T4K  value was significantly higher in all pathologic lesions compared with normal organs. In addition, PT had the highest
  and
and  among all pathologic lesions, indicating the high receptor binding and internalization rate, as well as total distribution volume. The normal pancreas showed the highest
  compared with other all normal organs, but the
  and
and  values for the normal pancreas were lower than many other normal organs, indicating that the transfer rate of FAP ligand binding to the receptor and the internalization rate in the normal pancreas were lower compared with many other normal organs. The kidney showed the highest
  , and
, and  compared with other all normal organs; the
  value of kidney is second only to that of the spleen; and the
  value of kidney is in the middle of all normal organs. This meant that the kidney not only had a high transfer rate from plasma to the reversible compartment and a high transfer rate of FAP ligand binding to the receptor and internalization rate, but it also had a high reverse transfer rate.
Parametric imaging of 68Ga-FAPI PET/CT has not been performed in previous studies because of limited temporal resolution and low SNR in traditional PET/CT. In this study, we investigated whether parametric imaging could be used as one of the diagnostic methods in clinical routine practice. For visual assessment, the  (2T4K) images and
  (Logan plot with SC) images both showed less image noise and higher lesion conspicuity compared with SUV images. Although some lesions were equivocal in SUV images, the lesion conspicuity and detectability were obviously higher on
  (2T4K) images. The
  (2T4K) images and
  (Logan plot with SC) images both showed less nonspecific signals in typical background regions. The liver, spleen, blood pool, and muscle were typical backgrounds that may interfere with the lesion visualization in SUV images. The
  (2T4K) images and
  (Logan plot with SC) images had greatly weakened the influence of background reference. This is the main reason why the
  (2T4K) images and
  (Logan plot with SC) images both showed less image noise and lesion conspicuity compared with SUV images. Overall, the Logan plot with SC images have somehow higher SNR and CNR values, but no significant differences were detected. The
  (Logan plot with SC) images are vastly superior to the
  (Logan plot) image because of the low noise levels of the spatially smoothed dynamic PET images (24), which illuminates the importance and necessity of spatial constraint in the parametric image. In line with the results of the visual assessment, 2T4K images and Logan plot images had higher SNR and CNR compared with conventional SUV images in pathologic lesions, thus confirming the visual impression that 2T4K images and Logan plot images were both superior to SUV images. No significant differences were observed in visual assessment and objective quality evaluation between 2T4K images and Logan plot images; thus, 2T4K images and Logan plot images were comparable in image quality and lesion conspicuity. Taken together, our results demonstrate that parametric imaging by total-body 68Ga-FAPI PET/CT yielded a substantial increase in sensitivity that makes whole-body parametric imaging feasible and meets the requirements of reading imaging systems in clinical practice. Considering the computational burden of compartmental models, the Logan plot presented an appealing alternative to 2T4K because of its simplicity (21), making it appropriate for parametric imaging.
This study has several limitations. First, DA was used as an input function in our study, which was not equally applicable for all tissue types. For example, in the case of the liver, kinetic analysis best entails the use of both hepatic artery and portal vein input (6). We acknowledge that the total-body motion correction and partial volume correction for small tissue or lesions are still challenging; the accuracy of the estimated model parameters might be reduced by partial volume and motion effects on our measured dynamic PET data, and it is also fully recognized and discussed in a previous FAPI PET study (6). In addition, the sample was small, and it was a retrospective study. Although all primary lesions were confirmed by pathology, several metastases could not be confirmed by pathology because they were difficult to reach anatomically. These lesions may also be combined with inflammation and whether inflammation affects kinetic modeling remain unclear. A prospective study with more samples and histopathologic investigations is needed to confirm our results. Furthermore, although parametric images showed enhanced lesion contrast over SUV images, their influence on patients' clinical diagnosis and treatment decisions should be further elaborated in the future.
CONCLUSION
The 2T4K model is the most appropriate model to describe the dynamic kinetics of 68Ga-FAPI-04 PET. Total-body parametric imaging of 68Ga-FAPI-04 PET yielded superior quantification beyond SUV with enhanced lesion contrast, which may serve as a more accurate imaging method for early diagnosis to better reflect tumor characterization or to allow evaluation of treatment response.  (2T4K) images are comparable to
  (Logan plot with SC) images in image quality; however,
  (Logan plot with SC) images presented an appealing alternative to
  (2T4K) images because of their simplicity.
DISCLOSURE
No potential conflict of interest relevant to this article was reported.
KEY POINTS
QUESTION: Should parametric imaging of dynamic 68Ga-FAPI-04 datasets from total-body PET/CT in pancreatic cancer and gastric cancer be used?
PERTINENT FINDINGS: The 2T4K was the preferred compartment model for 68Ga-FAPI-04.  images (2T4K) of 68Ga-FAPI-04 showed enhanced lesion contrast and less image noise compared with conventional SUV images in visual assessment and objective quantitative analysis.
IMPLICATIONS FOR PATIENT CARE: Total-body parametric imaging of 68Ga-FAPI-04 PET yielded superior quantification beyond SUV with enhanced lesion contrast, which may serve as a promising imaging method for early diagnosis to better reflect tumor characterization or to allow evaluation of treatment response.
ACKNOWLEDGMENTS
This study was supported by the National Key R&D Program of China (Grant 2021YFA0910004), National Natural Science Foundation of China (Grant 82171972), Clinical Research Project of Health Industry of Shanghai Municipal Health Commission (Grant 20214Y0438), and nurture projects for the Youth Medical Talents-Medical Imaging Practitioners Program (Grant SHWRS(2021)_099).
Footnotes
Published online Jan. 5, 2023.
- © 2023 by the Society of Nuclear Medicine and Molecular Imaging.
REFERENCES
- Received for publication October 4, 2022.
- Revision received December 27, 2022.


