


Abstract
Accurate γ-photon attenuation correction (AC) is essential for quantitative PET/MRI as there is no simple relation between MR image intensity and attenuation coefficients. Attenuation maps (μ-maps) can be derived by segmenting MR images and assigning attenuation coefficients to the compartments. Ultrashort-echo-time (UTE) sequences have been used to separate cortical bone and air, and the Dixon technique has enabled differentiation between soft and adipose tissues. Unfortunately, sequential application of these sequences is time-consuming and complicates image registration. Methods: A UTE triple-echo (UTILE) MRI sequence is proposed, combining UTE sampling for bone detection and gradient echoes for Dixon water–fat separation in a radial 3-dimensional acquisition (repetition time, 4.1 ms; echo times, 0.09/1.09/2.09 ms; field strength, 3 T). Air masks are derived mainly from the phase information of the first echo; cortical bone is segmented using a dual-echo technique. Soft-tissue and adipose-tissue decomposition is achieved using a 3-point Dixon-like decomposition. Predefined linear attenuation coefficients are assigned to classified voxels to generate MRI-based μ-maps. The results of 6 patients are obtained by comparing μ-maps, reciprocal sensitivity maps, reconstructed PET images, and brain region PET activities based on either CT AC, two 3-class MRI AC techniques, or the proposed 4-class UTILE AC. Results: Using the UTILE MRI sequence, an acquisition time of 214 s was achieved for the head-and-neck region with 1.75-mm isotropic resolution, compared with 164 s for a single-echo UTE scan. MRI-based reciprocal sensitivity maps show a high correlation with those derived from CT scans (R2 = 0.9920). The same is true for PET activities (R2 = 0.9958). An overall voxel classification accuracy (compared with CT) of 81.1% was reached. Bone segmentation is inaccurate in complex regions such as the paranasal sinuses, but brain region activities in 48 regions across 6 patients show a high correlation after MRI-based and CT-based correction (R2 = 0.9956), with a regression line slope of 0.960. All overall correlations are higher and brain region PET activities more accurate in terms of mean and maximum deviations for the 4-class technique than for 3-class techniques. Conclusion: The UTILE MRI sequence enables the generation of MRI-based 4-class μ-maps without anatomic priors, yielding results more similar to CT-based results than can be obtained with 3-class segmentation only.
Hybrid medical imaging systems—for example, comprising both a PET and a CT imaging device—have evolved into standard diagnostic tools in clinical routine within the last decade (1). Recently, a hybrid system combining a PET device and an MRI system with simultaneous PET/MRI data acquisition has been presented (2,3), and clinical systems are already being marketed. Compared with CT, MRI provides versatile soft-tissue contrast, yielding superior diagnostic accuracy without subjecting the patient to ionizing radiation. Furthermore, MRI not only reveals the essential morphologic information but also provides sophisticated pulse sequences such as diffusion-weighted imaging or MR spectroscopy (4) to visualize tissue function. Finally, the combination of PET and MRI has potential distinct advantages over PET/CT such as the ability to perform motion correction of PET data.
However, practical PET/MRI implementations still suffer from the lack of accurate MRI-based methods for attenuation correction (AC) of the measured PET emission data. Yet, correcting for γ-photon attenuation caused by the patient, the examination table, and the MRI coils is an imperative requirement of quantitative PET data analysis. Although CT-based AC in PET/CT systems can be considered straightforward, as CT measures the attenuation coefficient of tissues at x-ray energies, MRI-based AC is challenging. Because the MRI signal is determined by tissue hydrogen density and relaxation properties, the derivation of 511-keV-photon attenuation coefficients is much more complex than in CT AC.
Different atlas- or classification-based MRI AC techniques have recently been reported (5–10). Current atlas-based approaches cannot entirely cope with interpatient variations and abnormalities such as bone resections or implants; therefore, the focus of this study is on approaches based on automatic tissue classification of MRI data. Concerning the choice of tissue classes, apart from air and soft tissue, Schulz et al. (7) have shown that adipose tissue has to be considered in whole-body imaging if accurate AC is desired. The same has been stated by Martinez-Möller et al. (8), who have proposed a 4-tissue-class segmentation (air, lung, soft tissue, and adipose tissue) using a Dixon method for whole-body MRI. In head datasets, cortical bone has been found to be an important tissue class for accurate AC by Catana et al. (9). Unfortunately, bone is difficult to distinguish from air in conventional MRI sequences because of extremely short T2 relaxation times, resulting in a fast-decaying bone signal (11). Therefore, Keereman et al. have proposed the use of ultrashort-echo-time (UTE) sequences for cortical bone segmentation in the head (10).
The combination of cortical bone segmentation and water–fat separation is a promising approach to integrating all tissue classes relevant for attenuation in head-and-neck PET/MRI. However, the total acquisition time should be used primarily for diagnostic scans, and sequential application of UTE and Dixon MRI sequences constitutes a suboptimal solution. Therefore, we propose a combined MRI sequence for the discrimination of cortical bone, air, adipose tissue, and soft tissue in head-and-neck PET/MRI. For evaluation, we compare the resulting 4-class MRI AC technique with 3-class MRI AC approaches and with CT AC.
MATERIALS AND METHODS
Volunteer and Patient Studies
Experiments on 1 healthy volunteer and 6 patients were performed as approved by the institutional ethics committee. Volunteer and patients had no contraindication to an MRI examination, and they gave written consent to be investigated using the proposed MRI sequence.
All patients included in this study had undergone a head-and-neck 18F-FDG PET/CT examination (Gemini TF 16 PET/CT scanner; Philips) for cancer staging.
MRI Scanner
All measurements were performed on a clinical Achieva 3.0-T TX system using a SENSE NeuroVascular 16-channel receiver coil (Philips) with CLEAR (Constant LEvel AppeaRance). The minimum achievable echo time (TE) for UTE acquisition is ruled by the transmitter and the receiver coils, as the energy stored in the transmit coil must ring down before a safe tuning of the receiver coil can start. Although ringing down typically takes only a few microseconds (12), tuning of the coils can be more time-consuming. A tune-delay parameter of 50 μs was selected via a coil configuration software patch, resulting in a minimum first echo time of TE1 = 90 μs.
MRI Pulse Sequence
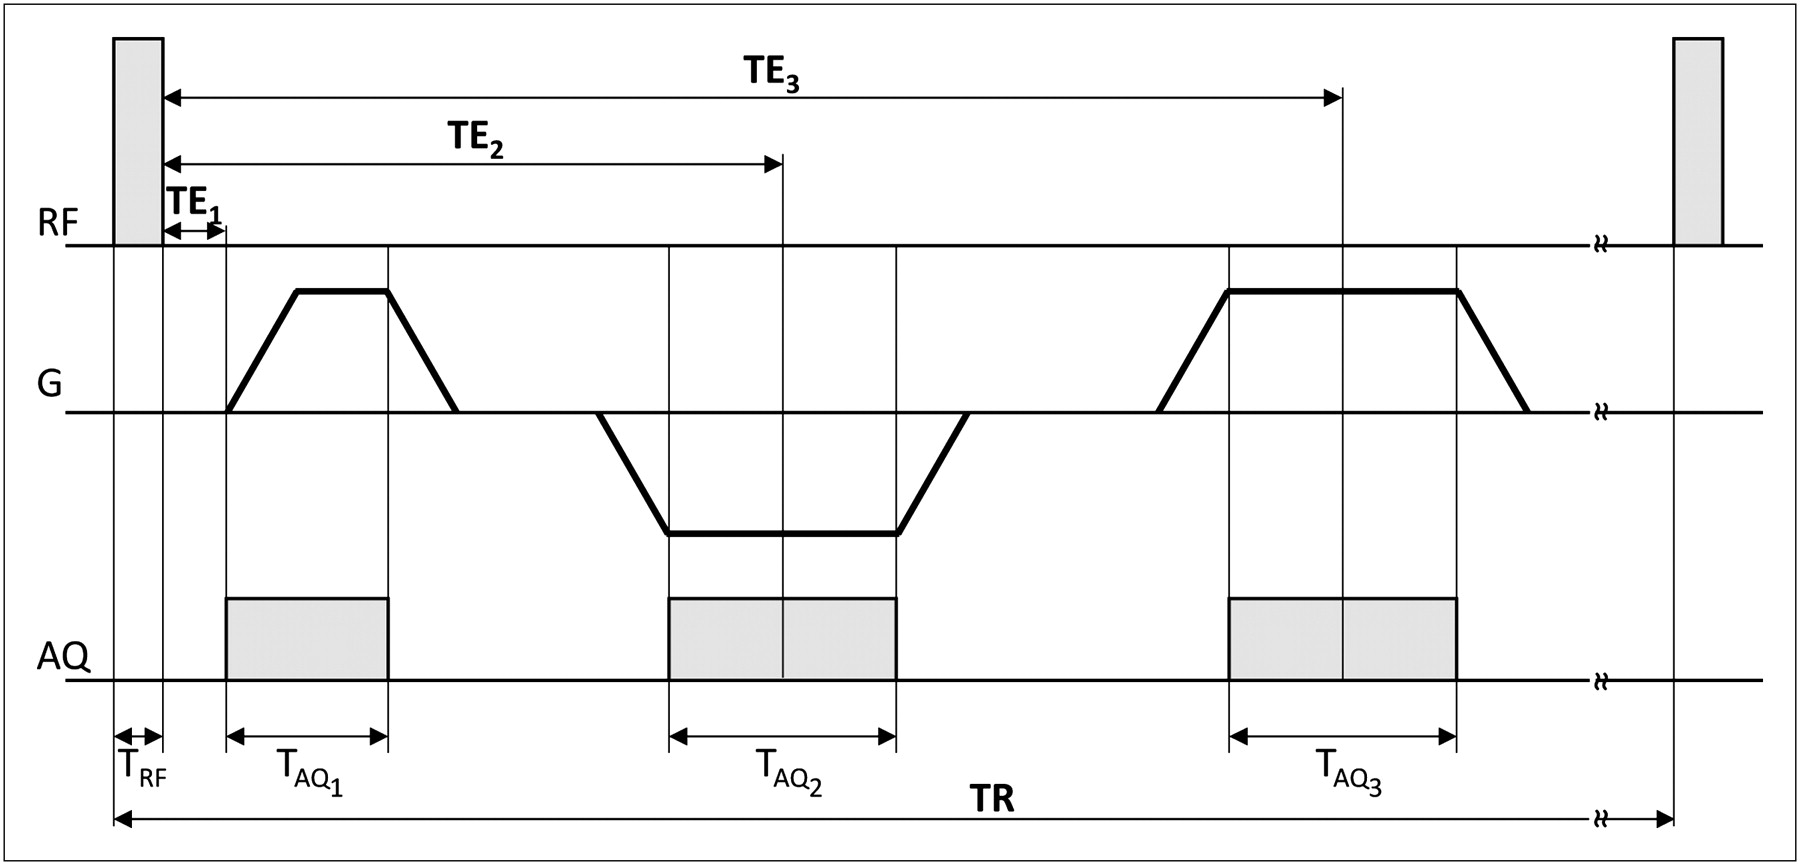
The proposed UTE triple-echo (UTILE) sequence (Fig. 1) combines UTE acquisition for signal reception from fast-decaying tissue types and water–fat signal decomposition following the Dixon scheme. It features a nonselective radiofrequency block-pulse for volumetric excitation (flip angle: 10°, pulse width: 51 μs); the sampling of the UTE signal starts at the same time as the ramp of the readout gradient. Starting from the center, k-space is traversed radially outward, with subsequent readouts covering a sphere in k-space. The acquisition sampling-window duration TAQ1 is 0.31 ms per k-space line. Signal decay during acquisition is not corrected for, so that TAQ1 directly affects resolution and signal level of short-T2 components in the image (12).

Timing diagram of UTILE MRI sequence; RF = radiofrequency excitation; G = readout gradient; AQ = data acquisition.
Echo times of gradient echoes are such that spins associated with water and fat are almost opposite each other (TE2 = 1.09 ms) and in-phase (TE3 = 2.09 ms), respectively; acquisition window durations are TAQ2 = TAQ3 = 0.49 ms. Spins are dephased using a crusher gradient; the repetition time (TR) is 4.1 ms. The field of view of 2803 mm3 covers the complete head-and-neck area (matrix size [acquisition/reconstruction]: 1603/2403; voxel size [acquisition/reconstruction]: 1.753/1.173 mm3); the total acquisition time is 214 s. Reconstructed complex images are denoted
To allow for a quantitative assessment of the proposed water–fat decomposition, an additional 2-dimensional mDixon (Philips) acquisition as integrated in the MRI scanner software was performed for the volunteer (TR/TE1/TE2/TE3 = 11/4.6/5.1/5.6 ms; field of view: 2802 mm2; flip angle: 15°; prepulse: inversion; inversion time: 800 ms; matrix size [acquisition/reconstruction]: 1872/3202; pixel size [acquisition/reconstruction]: 1.52/0.8752 mm2; slice thickness: 4 mm; reconstructed images: water and fat).
MRI Postprocessing
Postprocessing of reconstructed MRI data was performed in MATLAB (R2011a; The MathWorks). The effect of different coil sensitivities in the gradient echoes is accounted for in image reconstruction using a SENSE reference scan; inhomogeneous sensitivities in the UTE echo were compensated for by exploiting the similarity of heavily smoothed M1 and M3, both acquired approximately under in-phase conditions. An air mask, including cavities, was then created using magnitude and phase thresholding of mainly the first echo as well as morphologic filtering and connected-component analysis.
Cortical bone was segmented using a dual-echo technique (13) to detect the MRI signal originating from short-T2 components. Therefore, the relative signal decay between M1 and M3 was computed by
(dUTE = differential UTE signal) and masked by the air mask to yield
The remaining tissue (everything except air and bone) is assigned a relative water–fat fraction, determined through an adapted Dixon decomposition (14,15). For this UTILE-based 3-point Dixon method, signals are described by their magnitude and unwrapped phase; the latter is recovered using a 3-dimensional phase-unwrapping algorithm (16). Each signal intensity In is assumed to be composed of 2 signal fractions, described by their magnitudes Mw (water) and Mf (fat), respectively. Their relative phases are determined by the unknown magnetic field inhomogeneities ΔB0 and the chemical shift of fat of
Using the approximations
Attenuation Map (μ-Map) Generation
Tissue-specific linear attenuation coefficients for 511-keV photons were extracted from the literature (Table 1). While population of the segmented image is straightforward for air and bone segments, the mean attenuation coefficient for each mixed water–fat voxel is calculated from the relative water–fat fraction r using the linear mapping
Linear Attenuation Coefficients and Windows for Generation and Segmentation of μ-Maps*
A low-dose CT (matrix size: 512 × 512; voxel size: 1.17 × 1.17 × 5 mm; effective tube-current–time product: 30 mAs; tube voltage: 120 kVp) was rescaled (7) to provide reference μ-maps denoted μCT. Patient μ-maps derived from MRI were manually coregistered to μCT by rigid transformation and resampled to CT resolution using commercially available software (IMALYTICS Research Workstation Prerelease; Philips Research). To focus on the evaluation of tissue classification performance, μCT was copied to yield an initial μUTILE. Then, the patient's body was segmented and deleted from μUTILE by thresholding and morphologic filtering, and the respective voxels were copied from the coregistered MRI-based μ-map.
For each 4-class μ-map, two 3-class μ-maps were created: skipping the water–fat separation, one obtains
Evaluation of μ-Maps
μCT and μUTILE voxels were classified into 4 tissue classes based on voxel intensities (Table 1). The classification was restricted to a minimum rectangular bounding box of voxels classified as “body” in the MRI data of each patient. Linear attenuation coefficient windows for classification were chosen to take partial-volume effects (CT) and interpolation effects at tissue interfaces (MRI) into account. To quantify misclassifications, the number of voxels in the intersection of tissue classes in μCT and μUTILE was determined. Based on the CT classification, μUTILE and μCT values in each tissue class were compared.
All μx were slicewise Radon-transformed (18) to yield the respective sinograms σx, representing the integrated attenuation coefficient along all in-slice lines of response. Following the Beer–Lambert law, the attenuation along a line of response is
Evaluation Using PET Data
Measured PET emission data were corrected for random and scattered coincidences and attenuation on the basis of the respective μ-maps during list-mode ordered-subset expectation maximization reconstruction (19) (9 iterations; number of subsets used in iterations 1–9: 16, 8, 4, 4, 2, 2, 1, 1, 1; 288 × 288 × 130 voxels; 2 bed positions; voxel size: 2.03753 mm3). Because of undesired movement of 1 patient during PET acquisition, the reconstruction was limited to 1 bed position (288 × 288 × 88 voxels) in this patient. PET image data were scaled to standardized uptake values (SUVs): after extracting a proportionality factor between the PETCT and the PET reconstruction obtained from the PET scanner software for each patient, the same factor was applied to all PET reconstructions (PETCT, PETUTILE, and
The reconstructed PET data were smoothed using a 3-dimensional gaussian low-pass filter (full width at half maximum, 3 voxels), and linear correlation of PETUTILE,
Finally, to evaluate the impact on brain PET examinations, 8 regions of interest of volumes between 2 and 9 mL were manually placed in the brain region of all patients, and the correlation of mean values and SD in these regions of interest was evaluated.
Statistical Analysis
The significance of correlation coefficients (Pearson) was assessed using the Student t test (
RESULTS
Only 1 patient reported peripheral nerve stimulation, which was not experienced as uncomfortable.
μ-Maps
Focusing on water–fat separation, the proposed UTILE-based 3-point Dixon reconstruction yields a water–fat fraction r similar to the one based on an established mDixon acquisition and decomposition (Supplemental Fig. 2). The difference between both r in the head voxels shown is −0.029 ± 0.186 (mean ± SD).
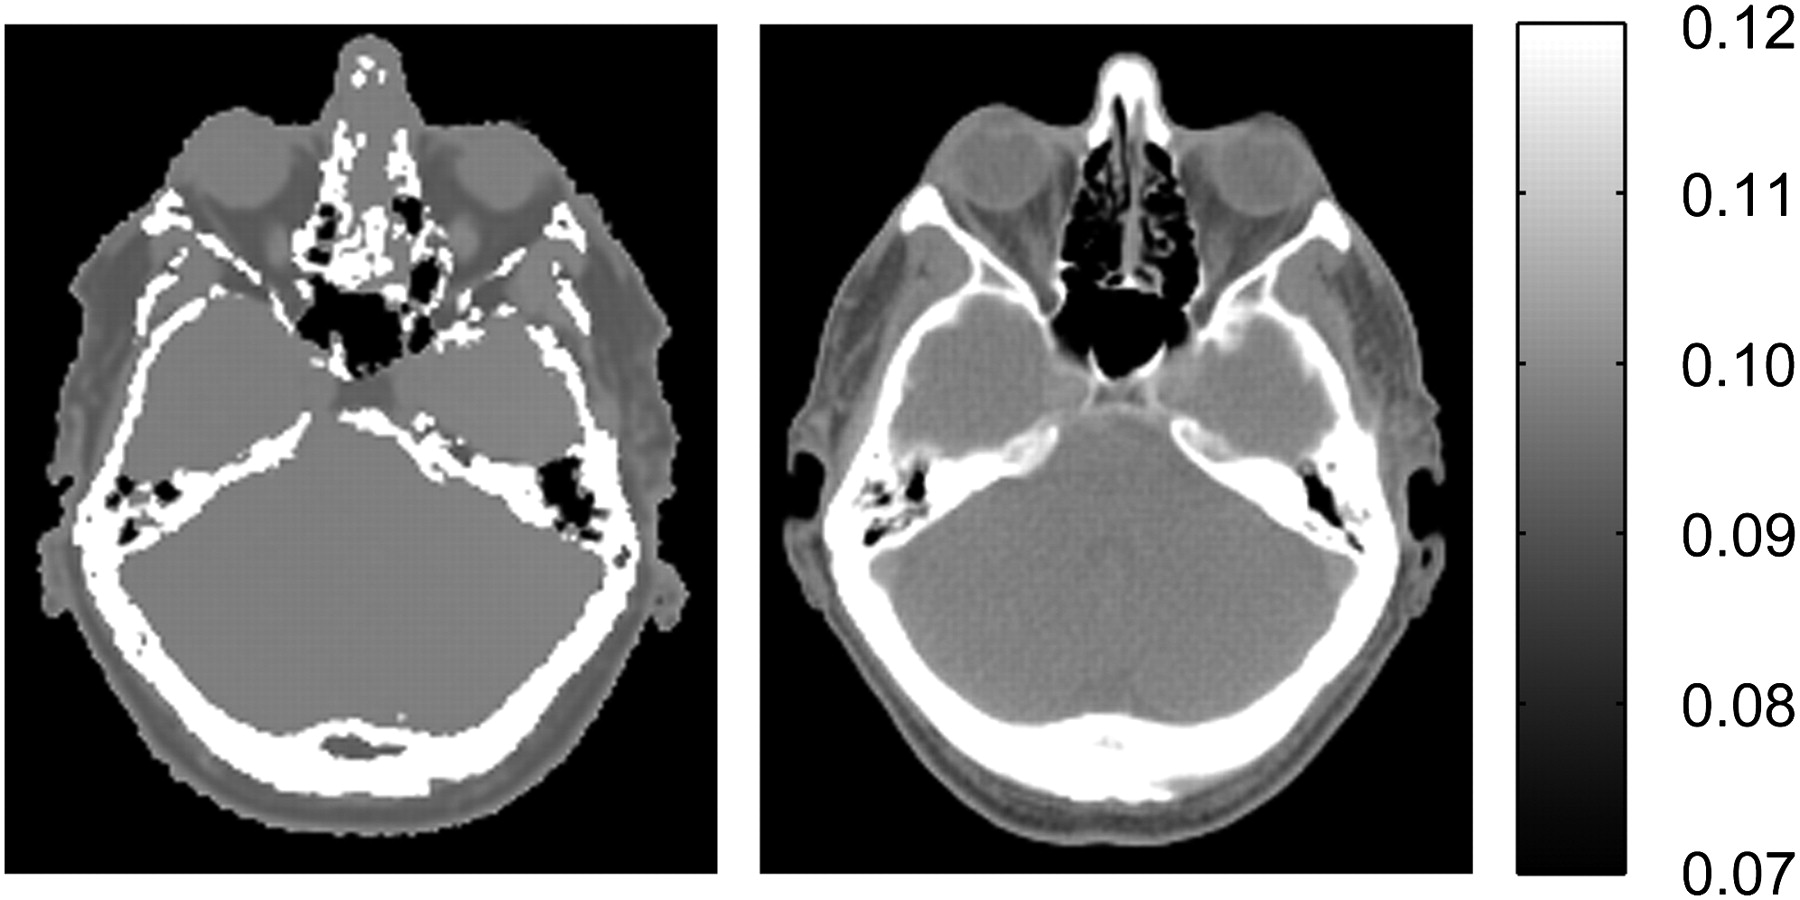
The 4-class μUTILE exhibits a high visual similarity to μCT despite challenging anatomic regions as in the paranasal sinuses (Fig. 2; Supplemental Fig. 3). The fraction of correctly classified voxels was over 80% for all patients, with an aggregated 81.1% (Table 2). Mean μUTILE intensities are found to be pairwise significantly different across tissue classes (all P < 10−6), signifying that μUTILE in a voxel depends on the tissue class of the corresponding CT voxel (Table 3). Differences between mean μCT and μUTILE intensities in the same tissue class are either small (air voxels) or can be explained by partial-volume effects and misregistration, both inducing misclassifications (e.g., between soft-tissue and bone voxels).

Corresponding transverse slices of μUTILE (left) and μCT (right) of patient P2 in cm−1. Supplemental Figure 3 provides additional examples.
Coclassification of Voxels in μCT and μUTILE: Number of Voxels in Intersection of Segmented Tissue Classes Aggregated over All Patients*
Voxel Numbers and μCT and μUTILE Intensities (Mean ± SD) per Region Defined by CT Segmentation (Aggregated over All Patients)
Sensitivity Correction Maps
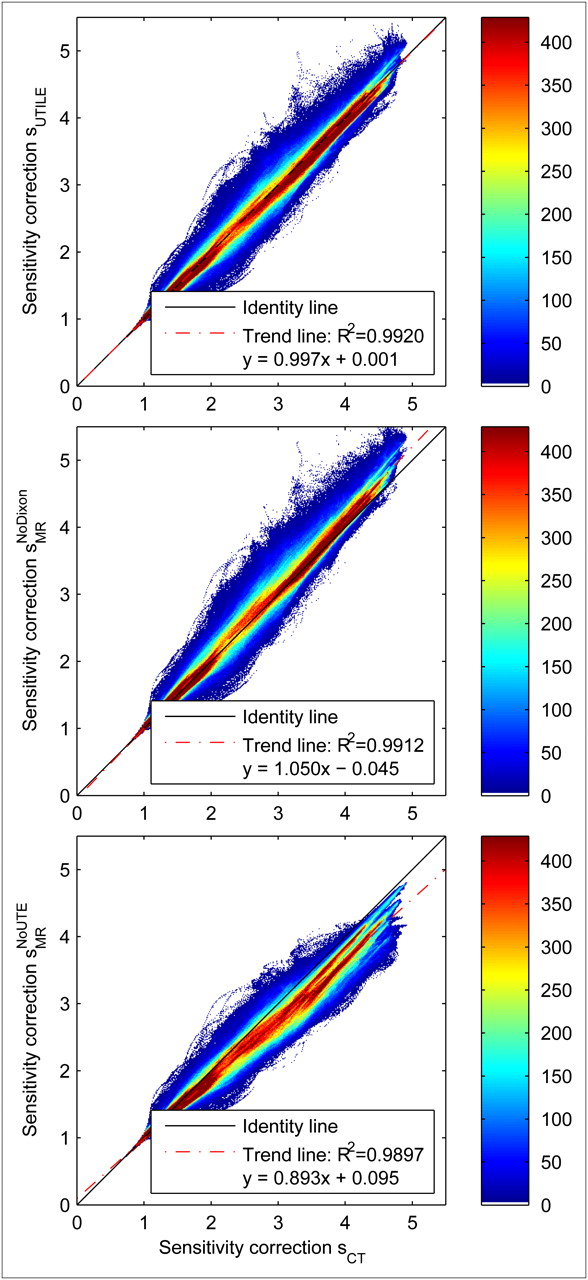
Correlations between sensitivity correction maps (Table 4) are high and slopes of the linear regression lines (Table 5) close to 1; compare Figure 3 for aggregated and Supplemental Figure 4 for individual patient data. sUTILE correlates better with sCT than any sMRI in aggregated data; in individual patients, sUTILE correlation is higher than
Coefficients of Determination (R2) Between CT-Based and MRI-Based Sensitivity Correction Maps*
Regression Lines Between CT-Based and MRI-Based Sensitivity Correction Maps

Joint histograms of sensitivity correction maps sUTILE (top),  (middle), and
  (bottom), all correlated with sCT (aggregated over all patients). Supplemental Figure 3 provides sensitivity correction maps, and Supplemental Figure 4 patient-specific examples.
Similarly, the slope of the regression line is closer to 1 for sUTILE (0.997) than for any sMRI in aggregated data (1.050 for
PET Activities
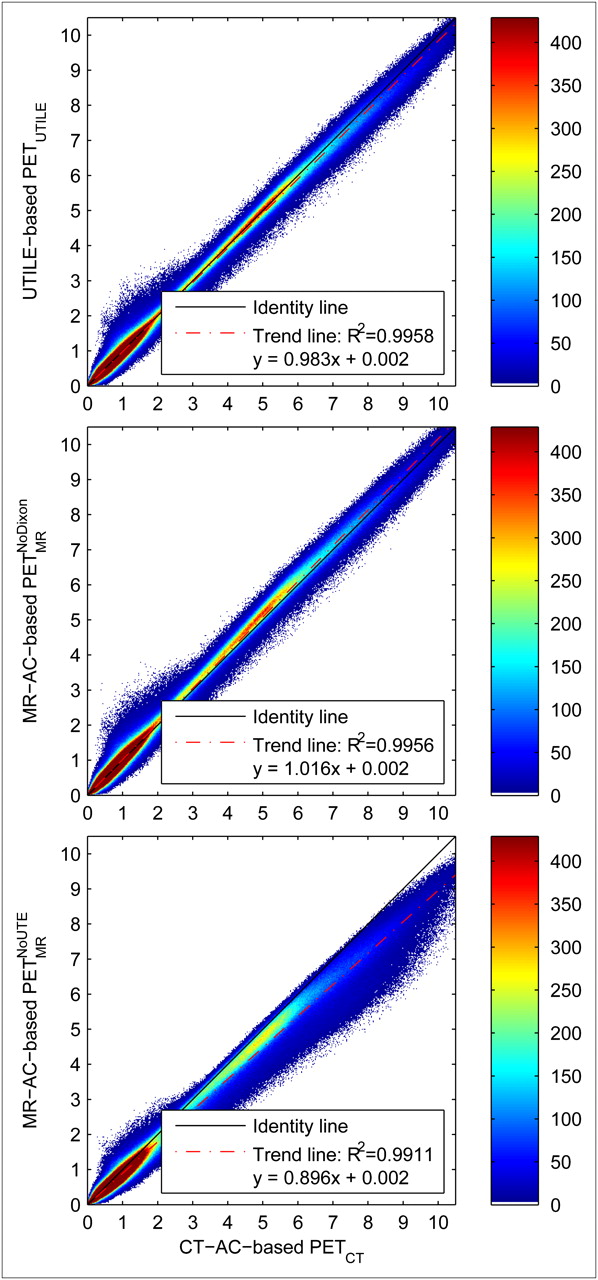
The visual comparison of reconstructed PET data, using different μ-maps for AC, illustrates the performance (Fig. 4; Supplemental Fig. 5). The joint histograms of PET voxel intensities confirm this observation (all patients aggregated: Fig. 5; individual patients: Supplemental Fig. 6), and the improved correlation of PETUTILE with PETCT, compared with both PETMRI, is in line with the aforementioned results of sensitivity corrections (Table 6). Correlation coefficients of PETUTILE are higher than those of
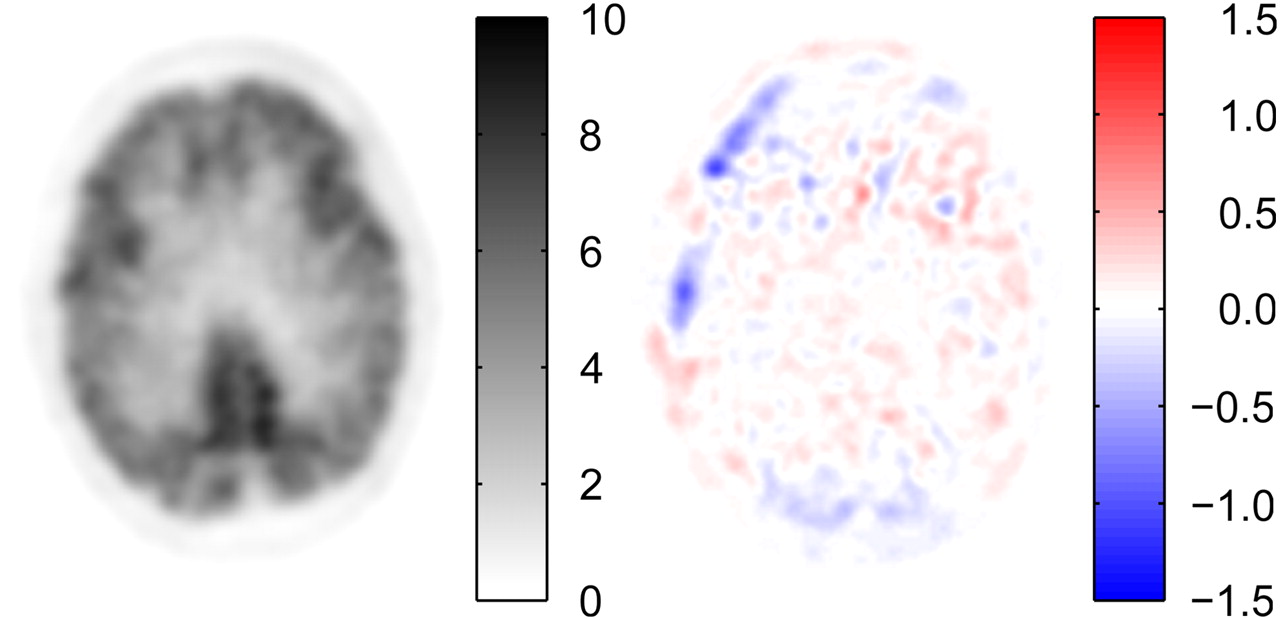
Corresponding transverse slices of PETUTILE (left) and difference image dUTILE (right) of patient P1 in SUV. Supplemental Figure 5 provides more examples.

Joint histograms of PETUTILE (top),  (middle), and
  (bottom), all correlated with PETCT (aggregated over all patients). Supplemental Figure 6 provides patient-specific examples.
Coefficients of Determination (R2) Between PETCT and PET Using Different MRI-Based AC Methods*
The regression line slopes of sensitivity correction maps translate into regression line slopes in PET activities (Table 7) with high correlation as hypothesized above, although the range of PET activity slopes is narrower than the range of sensitivity correction map slopes (regression line between sensitivity correction slopes and PET activity slopes: y = 0.760x + 0.232; R2 = 0.953).
Regression Lines Between PETCT and PET Using Different MRI-Based AC Methods
The average difference between the PETUTILE and the PETCT datasets, aggregated over all patients in all regions where PETCT is greater than 0.2 SUV, is an overestimation of the activity by 0.001 SUV ± 0.058 SUV (mean ± SD); the average absolute difference is 0.010 SUV ± 0.057 SUV. Considerable differences (δmin = −2.3 SUV, δmax = +4.6 SUV) are observed within regions that are challenging with regard to cortical bone segmentation, such as the labyrinth of ethmoid and the pharynx. For comparison,
In the 48 evaluated brain regions (8 regions × 6 patients; compare Supplemental Fig. 7), mean PETUTILE activities show differences between −4.8% and +7.6% (mean ± SD: 0.00 ± 0.15 SUV), compared with up to +11.4% in
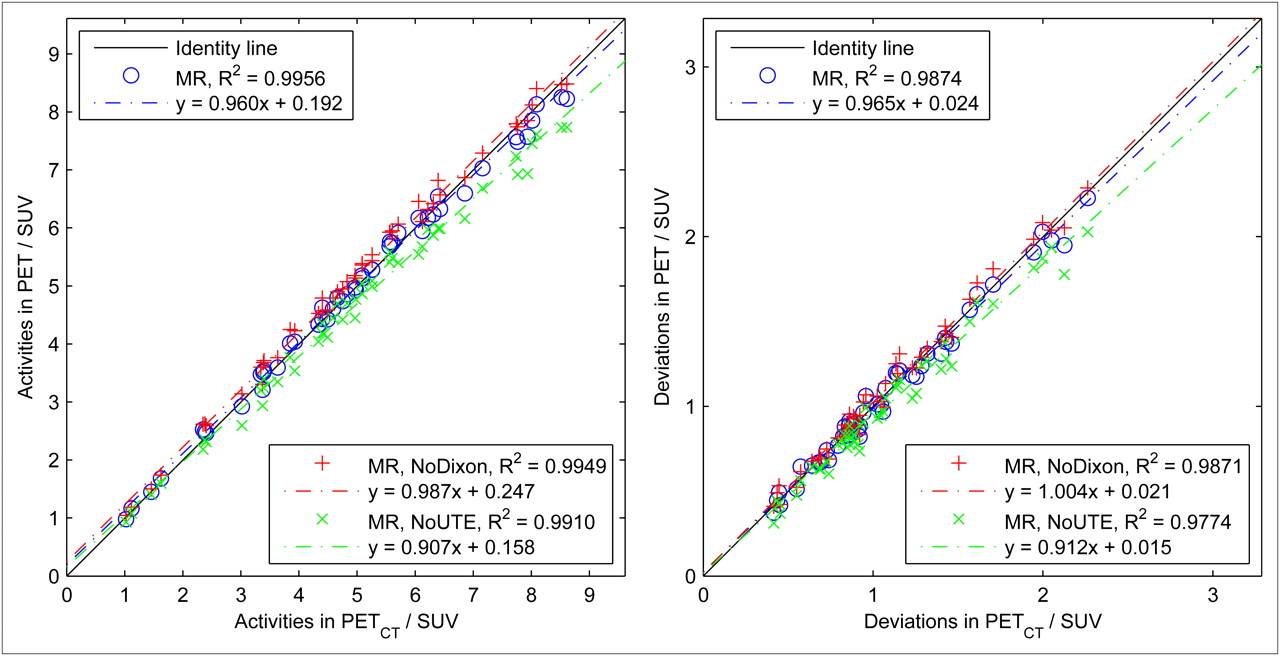
Scatterplot of regional mean values (left) and SD (right) of PETUTILE,  , and
, and  , correlated with PETCT (all patients).
DISCUSSION
The 3-dimensional phase unwrapping method proved adequate for use in the UTILE-based 3-point Dixon decomposition in all investigated patients. The UTILE-based 3-point Dixon method was found comparable to mDixon and even better suited for MRI AC in the cerebrospinal fluid because of the lack of an inversion pulse. The difference image, especially in the areas of the orbits and the optical nerves, shows the good agreement of both methods.
More sophisticated water–fat separation techniques have been described, most notably the “iterative decomposition of water and fat with echo asymmetry and least-squares estimation” (17,20). However, the application of this technique in this work is prevented mainly by 2 constraints: the difference in noise statistics between the UTE echo and the gradient echoes, and the echo times chosen to minimize overall acquisition durations.
Deriving an air mask from the UTE signal results in sufficient discrimination between air and other tissues. The discrimination of cortical bone produces good results but is challenging in areas of complex air–bone interfaces such as the paranasal sinuses (Fig. 2) or the vertebral column, supposedly because of susceptibility and partial-volume effects, combined with global thresholding of
The number of voxels in the tissue class intersections boneCT ∩ softUTILE and softCT ∩ boneUTILE highlights the necessity of bone segmentation improvements. These 2 bins represent, for example, areas of cranial bone and vertebral bodies falsely classified as soft tissue, and the voxels of the nasal sinuses incorrectly assigned to the bone class. In agreement, regions of maximum overestimation in the PETUTILE dataset are found around the nasal sinuses and the pharynx (Supplemental Fig. 5, top row), where a too high attenuation coefficient yields an increase in the reconstructed activity.
Issues such as these, however, are not uncommon in the application of UTE signal acquisition for MRI-based AC and, especially, are not specific to the proposed combination of UTE acquisition and Dixon decomposition. In addition, acquisition times are only 30% longer than acquisition times of a single-echo UTE acquisition with otherwise identical parameters (164 s).
The choice of 4 segmentation classes and appropriate linear attenuation coefficients leads to a high correlation and good linearity between sUTILE and the reference sCT, showing the advantage of 4-class tissue segmentation over 3-class approaches. This translates into similar correlation and linearity findings in PET activities, although slight shifts in regression line slopes are to be observed. These shifts, however, do not have adverse effects on accuracies in brain region activities. As a result, the proposed method can be regarded as a potential alternative to CT AC, especially considering the possibilities of exploiting simultaneous PET/MRI acquisitions for patient motion correction. Two MRI AC–specific particularities, however, will be briefly discussed:
Geometric distortions of the MRI data are not uncommon in the presence of metal or other field inhomogeneities. Although no localized distortions were detected in our study apart from metallic tooth implants, UTE acquisition parameters need to be carefully optimized such that the size of the imaged object is consistent across UTE and gradient echoes. On the used MRI system, the main parameters are trajectory delay and free induction decay image scaling samples. The former delays the start of the UTE sampling on the gradient ramp to compensate for eddy-current–induced gradient waveform delays; the latter influences the size of the image area reconstructed from the UTE signal. Although a calibration of these parameters is valid only for a specific set of sequence parameters, no related long-term drifts were observed in the experiments and a constant set of parameters was used throughout the study.
Furthermore, as can be seen from Figure 3 and Supplemental Figure 4, the choice of any predefined set of linear attenuation coefficients has to be seen as a compromise, as there are interpatient variations especially in bone attenuation coefficients. Some reasons for these interpatient variations include differences in bone mineral density, or the transition from water–fat fractions to mixed soft-tissue–adipose-tissue attenuation coefficients μr. In this study, common values from the literature were used, rather than fitting attenuation coefficients to individual patients’ CT data. Given a reliable segmentation, however, a PET reconstruction technique simultaneously estimating activity as well as attenuation (19) might have the potential of detecting inconsistencies in the attenuation-corrected PET activities and adapting the attenuation coefficients on a per-patient basis.
Finally, acknowledging CT AC as a reference technique, one should note that most comparisons were performed at CT resolution with a slice thickness of 5 mm. It can be hypothesized that MRI AC performs more accurately than presented in this work if the isotropic MRI resolution is fully exploited. However, the current evaluation would not have benefitted from such improvement since the influences of specific MRI AC strengths (higher through-plane resolution, no metal streaking artifacts) or weaknesses (smaller field of view, bone misclassifications) are difficult to separate. Consequently, regions with metallic tooth implants were ignored in the evaluation, since deviations from the artifact-impacted CT AC results are to be expected but do not allow for assessment of MRI AC without gold standard activity measurements. Similarly, repeated interpolation of MRI data (from MRI to CT to PET resolution) was accepted to perform consistent comparisons.
Inclusion of T2 relaxation properties of tissue, currently ignored in the UTILE signal model, could enhance the accuracy of the water–fat decomposition. Also, calibration measurements of phantoms with known fractions of soft tissue to adipose tissue could improve the mapping of the relative water–fat fraction into the linear attenuation coefficient domain.
Several improvements in cortical bone segmentation are conceivable, including a more adequate computation of the phase offset from the complex nuclear magnetic resonance signal, a susceptibility artifact filter, and a nonglobal threshold segmentation of
To apply the proposed method to whole-body imaging, lung tissue as another important tissue class for whole-body AC has to be detected and an attenuation coefficient estimated.
CONCLUSION
This work demonstrates the feasibility of classification-based MRI AC accounting for 4 different tissue classes—cortical bone, air, adipose tissue, and soft tissue—by combining the UTILE MRI sequence with dedicated postprocessing, exploiting the benefits of UTE acquisition as well as Dixon decomposition. The good agreement with the reference CT AC method in patient head-and-neck examinations demonstrates the applicability of the proposed approach. Results were shown to be superior to 3-class postprocessing without UTE or Dixon components. The acquisition time of less than 4 min seems to be acceptable for a high-resolution AC, especially compared with the acquisition duration of single-echo UTE sequences at comparable resolution.
DISCLOSURE STATEMENT
The costs of publication of this article were defrayed in part by the payment of page charges. Therefore, and solely to indicate this fact, this article is hereby marked “advertisement” in accordance with 18 USC section 1734.
Acknowledgments
This research was supported by the European Community Seventh Framework Programme, project number 241711: “SUB nanosecond Leverage In PET/MR ImAging (SUBLIMA).” Volkmar Schulz is a full-time employee of Philips. No other potential conflict of interest relevant to this article was reported.
Footnotes
Published online Apr. 13, 2012.
- © 2012 by the Society of Nuclear Medicine, Inc.
REFERENCES
- Received for publication May 19, 2011.
- Accepted for publication December 16, 2011.


Jump to section
Related Articles
Cited By...
- Enhanced Direct Joint Attenuation and Scatter Correction of Whole-Body PET Images via Context-Aware Deep Networks
- Measurement Repeatability of 18F-FDG PET/CT Versus 18F-FDG PET/MRI in Solid Tumors of the Pelvis
- An Efficient Approach to Perform MR-Assisted PET Data Optimization in Simultaneous PET/MR Neuroimaging Studies
- 4-Dimensional MRI and Attenuation Map Generation in PET/MRI with 4-Dimensional PET-Derived Deformation Matrices: Study of Feasibility for Lung Cancer Applications
- Evaluation of Prostate Cancer with PET/MRI
- Prediction of CT Substitutes from MR Images Based on Local Diffeomorphic Mapping for Brain PET Attenuation Correction
- Multi-Atlas-Based Attenuation Correction for Brain 18F-FDG PET Imaging Using a Time-of-Flight PET/MR Scanner: Comparison with Clinical Single-Atlas- and CT-Based Attenuation Correction
- MRI-Based Attenuation Correction for PET/MRI Using Multiphase Level-Set Method
- Evaluation of Atlas-Based Attenuation Correction for Integrated PET/MR in Human Brain: Application of a Head Atlas and Comparison to True CT-Based Attenuation Correction
- Reconstruction-Incorporated Respiratory Motion Correction in Clinical Simultaneous PET/MR Imaging for Oncology Applications
- Clinical Evaluation of Zero-Echo-Time MR Imaging for the Segmentation of the Skull
- MR-Based Attenuation Correction Using Ultrashort-Echo-Time Pulse Sequences in Dementia Patients
- Hybrid PET/MR Imaging: An Algorithm to Reduce Metal Artifacts from Dental Implants in Dixon-Based Attenuation Map Generation Using a Multiacquisition Variable-Resonance Image Combination Sequence
- PET Attenuation Correction Using Synthetic CT from Ultrashort Echo-Time MR Imaging
- An SPM8-Based Approach for Attenuation Correction Combining Segmentation and Nonrigid Template Formation: Application to Simultaneous PET/MR Brain Imaging
- Segmentation-Based MR Attenuation Correction Including Bones Also Affects Quantitation in Brain Studies: An Initial Result of 18F-FP-CIT PET/MR for Patients with Parkinsonism
- Principles of PET/MR Imaging
- Anatomic Evaluation of 3-Dimensional Ultrashort-Echo-Time Bone Maps for PET/MR Attenuation Correction
- Improvement of Attenuation Correction in Time-of-Flight PET/MR Imaging with a Positron-Emitting Source
- Clinical and research applications of simultaneous positron emission tomography and MRI
- MR-Based Attenuation Correction Methods for Improved PET Quantification in Lesions Within Bone and Susceptibility Artifact Regions
- PET and MR Imaging: The Odd Couple or a Match Made in Heaven?