


Abstract
In this work, we assessed the feasibility of attenuation correction (AC) based on a multi-atlas–based method (m-Atlas) by comparing it with a clinical AC method (single-atlas–based method [s-Atlas]), on a time-of-flight (TOF) PET/MRI scanner. Methods: We enrolled 15 patients. The median patient age was 59 y (age range, 31–80). All patients underwent clinically indicated whole-body 18F-FDG PET/CT for staging, restaging, or follow-up of malignant disease. All patients volunteered for an additional PET/MRI scan of the head (no additional tracer being injected). For each patient, 3 AC maps were generated. Both s-Atlas and m-Atlas AC maps were generated from the same patient-specific LAVA-Flex T1-weighted images being acquired by default on the PET/MRI scanner during the first 18 s of the PET scan. An s-Atlas AC map was extracted by the PET/MRI scanner, and an m-Atlas AC map was created using a Web service tool that automatically generates m-Atlas pseudo-CT images. For comparison, the AC map generated by PET/CT was registered and used as a gold standard. PET images were reconstructed from raw data on the TOF PET/MRI scanner using each AC map. All PET images were normalized to the SPM5 PET template, and 18F-FDG accumulation was quantified in 67 volumes of interest (VOIs; automated anatomic labeling atlas). Relative (%diff) and absolute differences (|%diff|) between images based on each atlas AC and CT-AC were calculated. 18F-FDG uptake in all VOIs and generalized merged VOIs were compared using the paired t test and Bland–Altman test. Results: The range of error on m-Atlas in all 1,005 VOIs was −4.99% to 4.09%. The |%diff| on the m-Atlas was improved by about 20% compared with s-Atlas (s-Atlas vs. m-Atlas: 1.49% ± 1.06% vs. 1.21% ± 0.89%, P < 0.01). In generalized VOIs, %diff on m-Atlas in the temporal lobe and cerebellum was significantly smaller (s-Atlas vs. m-Atlas: temporal lobe, 1.49% ± 1.37% vs. −0.37% ± 1.41%, P < 0.01; cerebellum, 1.55% ± 1.97% vs. −1.15% ± 1.72%, P < 0.01). Conclusion: The errors introduced using either s-Atlas or m-Atlas did not exceed 5% in any brain region investigated. When compared with the clinical s-Atlas, m-Atlas is more accurate, especially in regions close to the skull base.
Commercial PET/MRI systems have recently been implemented in clinical environments and produce promising results for the assessment of brain disease (1). Compared with PET/CT, the combination of PET and MRI not only provides higher soft-tissue contrast, but also can improve PET image quality using partial-volume correction (1,2).
One inherent drawback of PET/MRI systems is the difficulty in obtaining accurate attenuation correction (AC). In addition to foiling the stand-alone claim of PET/MRI, because of the magnetic field of a PET/MRI device, it is difficult to run CT or rotating point sources close to a PET/MRI system. Furthermore, an MR image is basically related to proton density and relaxation properties, yielding a contrast different from γ-ray attenuation.
Several methods have been proposed to overcome these problems (3,4). They can be grouped into 3 families, as well as combinations of these. The first comprises the template-based/atlas-based approaches (5,6). Such methods generate a patient-specific AC map by performing nonrigid registration of patient MR images and one or multiple datasets consisting of CT or AC maps. Segmentation approaches form the second family. Tissue components, for example, air, brain tissue, and bone, are segmented using dedicated MR pulse sequences, such as T1-weighted (T1w) Dixon-type sequences, or ultrashort echo time sequences (7,8). In the third family of methods, AC data are directly generated from the PET emission data, preferably from a system capable of time of flight (TOF) (9).
One of the latest commercial PET/MRI scanners, the SIGNA PET/MRI (GE Healthcare), implements a single-atlas–based method (s-Atlas) (10). One of our previous studies revealed that this method is comparatively accurate in supratentorial regions, although not accurate enough in the infratentorial regions (11), possibly leading to errors in certain clinical brain PET/MRI studies in which cerebellar tracer uptake is used as a reference for the normalization of the whole brain uptake. Therefore, s-Atlas needs to be improved. One alternative method is the multi-atlas–based method (m-Atlas) (6,12). Constructing the attenuation map as a composition of locally optimized image patches, calculated by weighted averaging of a larger atlas database, should reduce the errors from registration and patient variability and improve the overall accuracy of AC (5,6). Currently, there is no published or conference paper to test this hypothesis using clinical TOF PET/MRI data.
The aim of our study was to evaluate the feasibility of implementing m-Atlas using head 18F-FDG TOF PET/MRI data and compare this method with the clinical standard method of the TOF scanner (s-Atlas) and with the gold standard method (CT attenuation-correction method [CT-AC]).
MATERIALS AND METHODS
This study was approved by the institutional review board. All subjects provided signed informed consent before the examinations. All experiments were performed in accordance with relevant guidelines and regulations.
Patients
We enrolled 15 patients (9 men, 6 women). The median patient age was 59 y (age range, 31–80 y). These patients were completely different from those in the previous study (11).
PET/CT and PET/MRI Examination
The PET/CT acquisition followed the standard protocol for a clinical oncology study (Discovery 690 TOF PET/CT; GE Healthcare). The average injected dose of 18F-FDG was 211.6 ± 34.2 MBq (range, 180.7–325.7 MBq) in accordance with clinical guidelines (13). First, a helical whole-body CT scan (120 kV; 15–80 mA with automatic dose modulation; rotation time, 0.5 s; helical thickness, 3.75 mm; pitch, 39.37 mm/rot; matrix size, 512 × 512; slice thickness, 3.3 mm; pixel dimensions, 1.4 × 1.4 mm2) was acquired for AC of PET data and diagnostic purposes (10). Subsequently, a whole-body PET dataset including the head was acquired. Patients were transferred to the integrated TOF PET/MRI scanner (SIGNA PET/MRI; GE Healthcare) immediately after the PET/CT scan, and a brain PET/MRI scan was obtained as part of the study examination. Once positioned for PET/MRI, the head was immobilized using firm foam cushions between the head and coil. In our study, 4 patients underwent a head-only-protocol, 20-min PET acquisition with a standard head coil (8-channnel HD Brain; GE Healthcare), and the others underwent a whole-body-protocol, 4-min PET acquisition with a head-and-neck coil (28-channel GEM Head and Neck Unit; GE Healthcare) because these patients were also part of another clinical study. The PET/MRI scan was acquired at 95.8 ± 27.0 min after tracer injection.
During the PET on PET/MRI, LAVA-Flex (GE Healthcare) T1w images (repetition time, ∼4 ms; echo time, 2.23 ms; flip angle, 5°; slice thickness, 5.2 mm with 2.6 mm overlap; 120 slices; pixel size, 1.95 × 1.95 mm2; acquisition time, 18 s) were acquired for s-Atlas AC. These parameters were identical to the previous study except for the flip angle (5° in the current study, 12° in the previous study) (11). The change of the flip angle used in the default AC acquisition was introduced by the manufacturer soon after the deployment of the first clinical systems. The version finally approved by the Food and Drug Administration uses a 5° flip angle. These patient-specific T1w image data were also used as inputs (but not as atlases) to generate pseudo-CTs using the m-Atlas AC method as described below.
Reconstruction of AC Map
For each patient, 3 AC maps were generated based on each of the s-Atlas, m-Atlas, and CT-AC methods (Fig. 1).

Attenuation Map Based on Single-Atlas Method
The s-Atlas AC map was generated from the LAVA-Flex T1w images using a proprietary process consisting of 4 main steps. First, Hessian bone enhancement from LAVA-Flex T1w images is performed. Second, a pseudo-CT is generated by rigid and nonrigid B-spine–based elastic registration between the enhanced images and a single-head atlas having continuous Hounsfield values. This atlas is provided by the manufacturer. Third, the AC-map is generated from the pseudo-CT using the standard CT lookup tables. Finally, the MR hardware, coil, and bed are added to the AC map. This entire procedure takes less than 30 s and needs no user interaction. A more detailed description of the algorithm is provided by Wollenweber et al. (10).
AC Map Based on Multiple-Atlas Method
The pseudo-CT based on m-Atlas was obtained from the NiftyWeb website (http://cmictig.cs.ucl.ac.uk/niftyweb/program.php?p = PCT). This Web service tool automatically generates an m-Atlas pseudo-CT corresponding to a patient-specific head MR image (6,12). The CT synthesis method relies on a preacquired set of aligned MRI/CT image pairs from multiple subjects. Each MR image from the database is aligned to the target MR image using deformable registration. The CT images in the database are then mapped using the same transformation to target the MR image. Finally, the set of registered CT images is fused to generate the pseudo-CT according to the local morphologic similarity between the target and registered MR images. On average, it took 1 h 45 min to generate the pseudo-CTs with the images we uploaded to the website when the method ran on a single machine; the registrations (high accuracy) were run in series and on 5 threads. The resulting pseudo-CT was converted into an AC map using a Matlab version (The MathWorks) of the same bilinear mapping implemented in the SIGNA PET/MRI. Finally, the MR hardware was added using the s-Atlas data exported from the PET/MRI scanner. The parameters of the LAVA in-phase MR sequence used in this study and the subsequent imaging contrast were similar but not identical to the ones used to create the multi-atlas database. The MR-AC LAVA is a gradient echo sequence with a repetition time of approximately 4 ms, an echo time of 2.23 ms, and a flip angle of 5 °, whereas the multi-atlas dataset was created using a T1w magnetization-prepared rapid gradient-echo sequence with a repetition time of 2,200 ms, an echo time of 2.9 ms, an inversion recovery of 900 ms, and a flip angle of 10° (6,12). Representative LAVA-Flex T1w images are shown in Supplemental Figure 1 (supplemental materials are available at http://jnm.snmjournals.org).
Coregistered Attenuation Map Based on CT Method
The processing steps detailed below were performed using custom Matlab scripts (version 7.11.0) and PMOD 3.6 (PMOD Technologies Ltd.). The coregistered CT-AC map was generated as follows. First, the original CT-AC map was exported from the PET/CT scanner. Second, from this map, the CT table was removed manually. Third, a threshold was set to extract the outside air component from the CT-AC map. None of the images used in this study contained artifacts likely to affect air thresholding. Fourth, a normalized mutual information matching algorithm (PMOD) was used to derive the registration parameters necessary to match CT to LAVA-Flex T1w, and final matching was performed using custom Matlab routines. Finally, the CT-AC map was superimposed on the s-Atlas map, thereby replacing it (11).
Reconstruction of PET Images
Only the list-mode raw PET data from the PET/MRI examination were used. PET images were reconstructed with AC based on each of the 3 AC maps and the following parameters: fully 3-dimensional ordered-subset expectation maximization iterative reconstruction; subsets, 28; iterations, 8; pixel size, 1.17 × 1.17 mm2; point spread function modeling On; transaxial postreconstruction gaussian filter cutoff, 3 mm; axial filter, 1:4:1; and scatter normalization dead time On (14). All images were reconstructed both with and without TOF.
Analysis
All PET images were spatially normalized to a brain template (SPM5; University College London), and 67 automated anatomic labeling (AAL) volumes of interest (VOIs) were applied (Supplemental Fig. 2). In each VOI, 18F-FDG uptake values from CT-AC (PETCT) and each s-/m-Atlas (PETs-/m-Atlas) were measured. The evaluation was performed as follows.
In the 67 AAL VOIs of each of the 15 patients (1,005 VOIs in total), Bland–Altman analysis was performed by calculating relative difference (%diff) of both s-Atlas and m-Atlas. Absolute relative difference (|%diff|) was also calculated. The %diff in each VOI and each patient was defined as: And the average %diff of all 1,005 VOIs was defined as:
 To assess the error distribution in the brain, the 67 AAL VOIs were merged into 7 more generalized VOIs: frontal lobes, occipital lobes, parietal lobes, insula and cingulate gyrus, central structures (caudate nucleus, putamen, pallidum, and thalamus), temporal lobes, and cerebellum (Supplemental Fig. 3). The %diff and |%diff| were calculated in each merged region. All image analyses were performed using PMOD 3.6.
Statistical significance was assessed using a paired t test or Wilcoxon signed-rank test depending on whether its variance had a normal distribution or not, which was assessed using a Kolmogorov–Smirnov test. For the comparison of |%diff|, 1-tailed testing was used to know which one was superior and closer to zero. And for the comparison in each merged region, Bonferroni adjustment was used. A P value of less than 0.05 was deemed statistically significant. All statistical analyses used SPSS Statistics (version 19.0.0; IBM).
RESULTS
All 15 patients successfully underwent PET/CT and PET/MRI examinations.
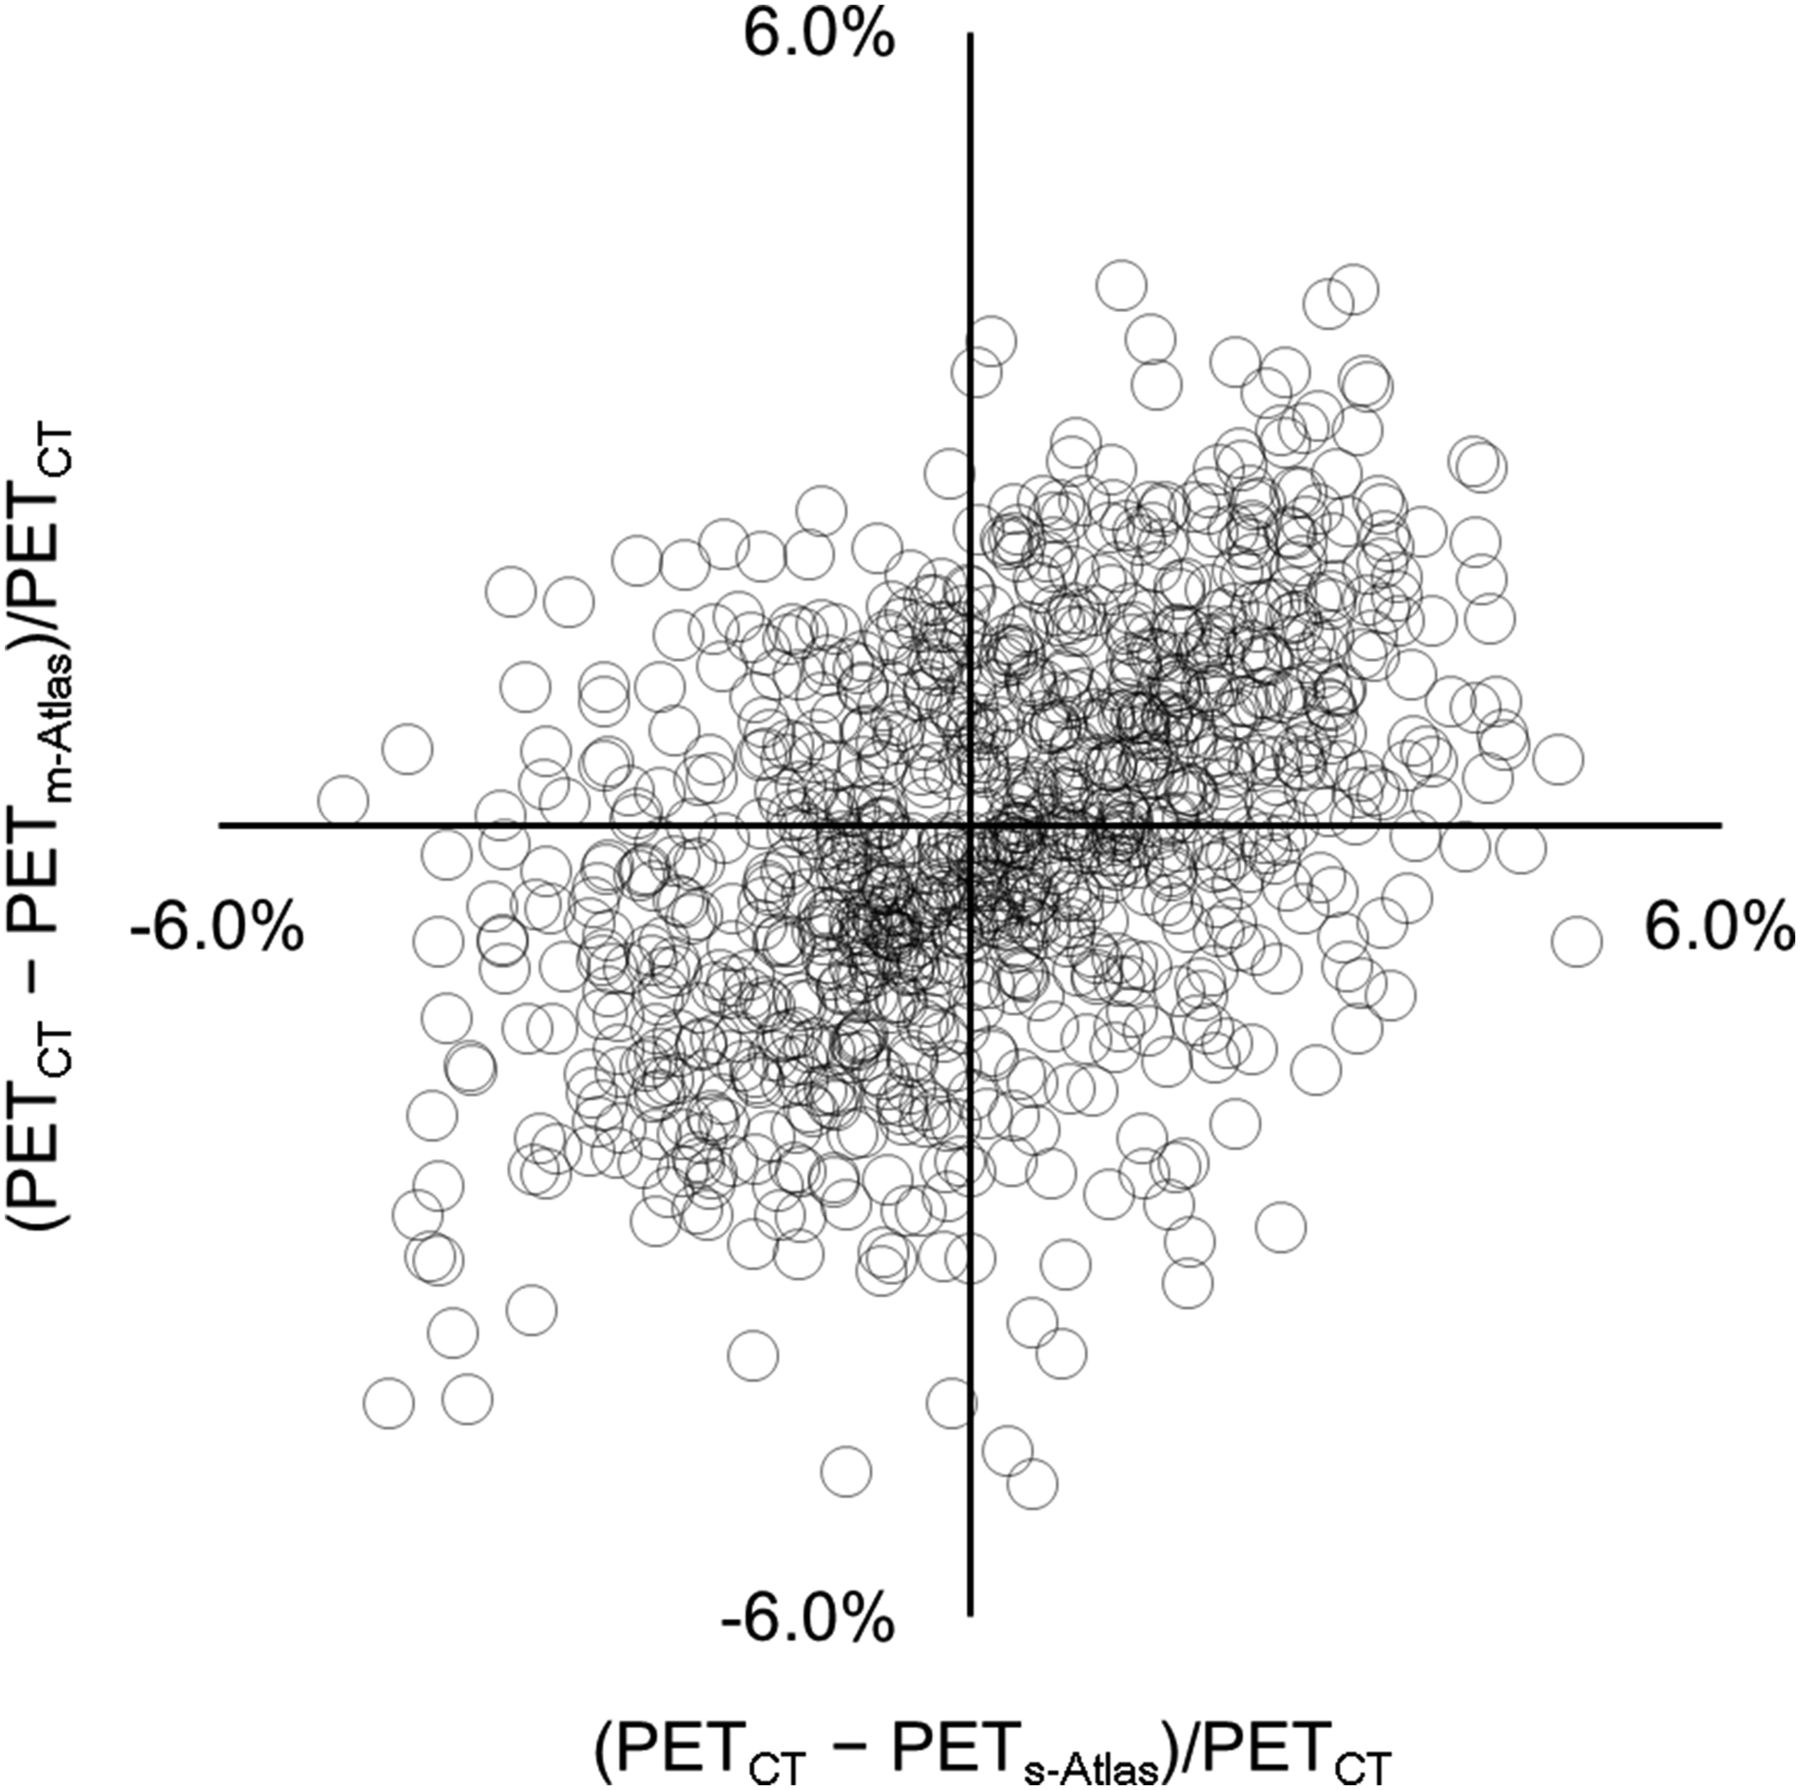
Linear regression showed PETCT and each PETs-/m-Atlas to be highly correlated (R2 > 0.99) to a straight line with a slope of almost 1.00 (Figs. 2A and 2B). The Bland–Altman plot for all 1,005 VOIs proved that m-Atlas had no bias and no underestimation or overestimation (−0.06% ± 1.50%; range, −4.99% to 4.09%). These results are superior to the result of s-Atlas (0.17% ± 1.82%; range, −5.00% to 4.84%) (Figs. 3A and 3B). The scatterplots of each VOI are given in Figure 4. Furthermore, the average |%diff| of the 1,005 VOIs with m-Atlas was significantly smaller than s-Atlas by 20% (s-Atlas vs. m-Atlas, 1.49% ± 1.06% vs. 1.21% ± 0.89%, P < 0.01, Table 1). Without TOF, |%diff| of both s-Atlas and m-Atlas significantly increased compared with TOF (s-Atlas, 1.71% ± 1.28%, P < 0.01; m-Atlas, 1.51% ± 1.19%, P < 0.01; Table 1).
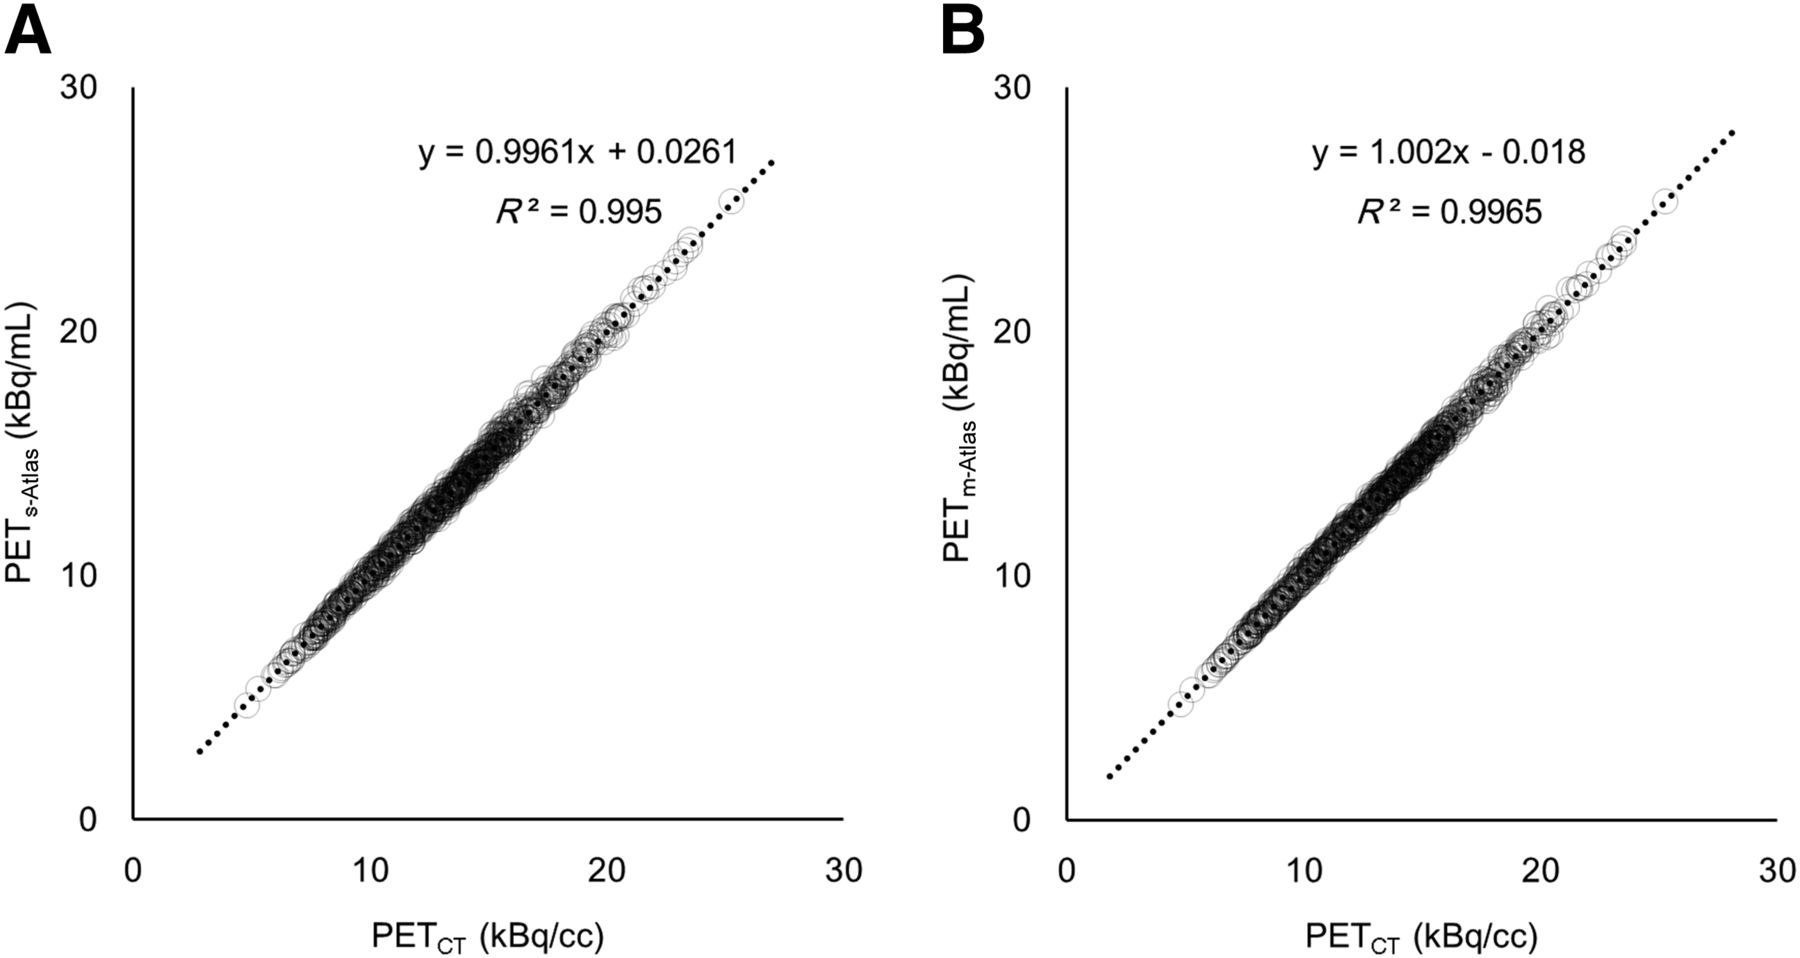
Regression plots between CT-AC and s-Atlas (A) and CT-AC and m-Atlas (B) for 67 VOIs × 15 patients.
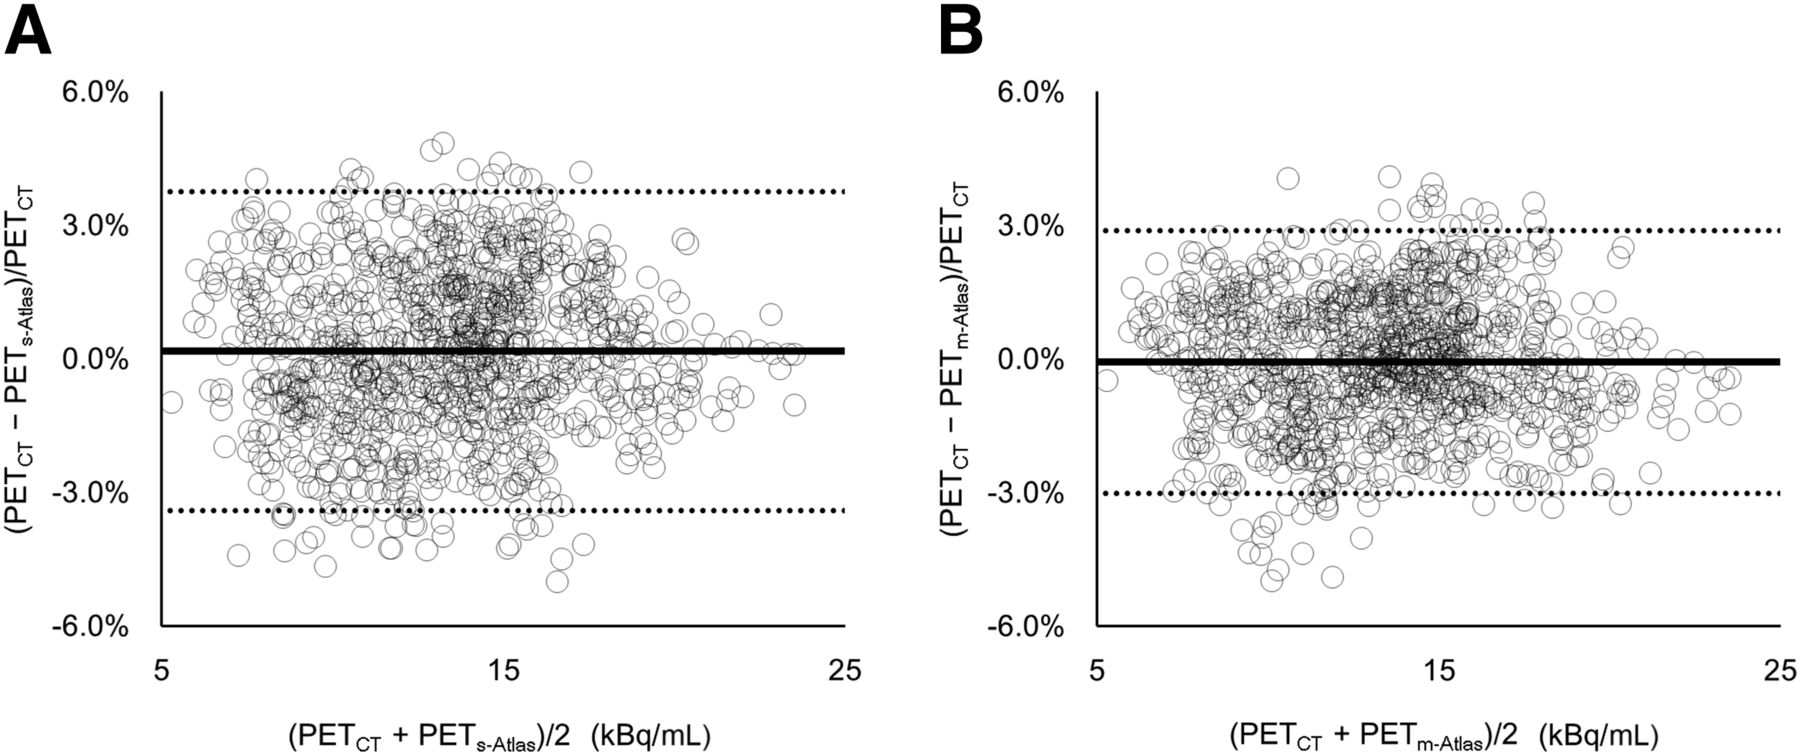
Bland–Altman plots of CT-AC and s-Atlas (A) and CT-AC and m-Atlas (B) for 67 VOIs × 15 patients. Average and SD of %diff are given in Table 1.

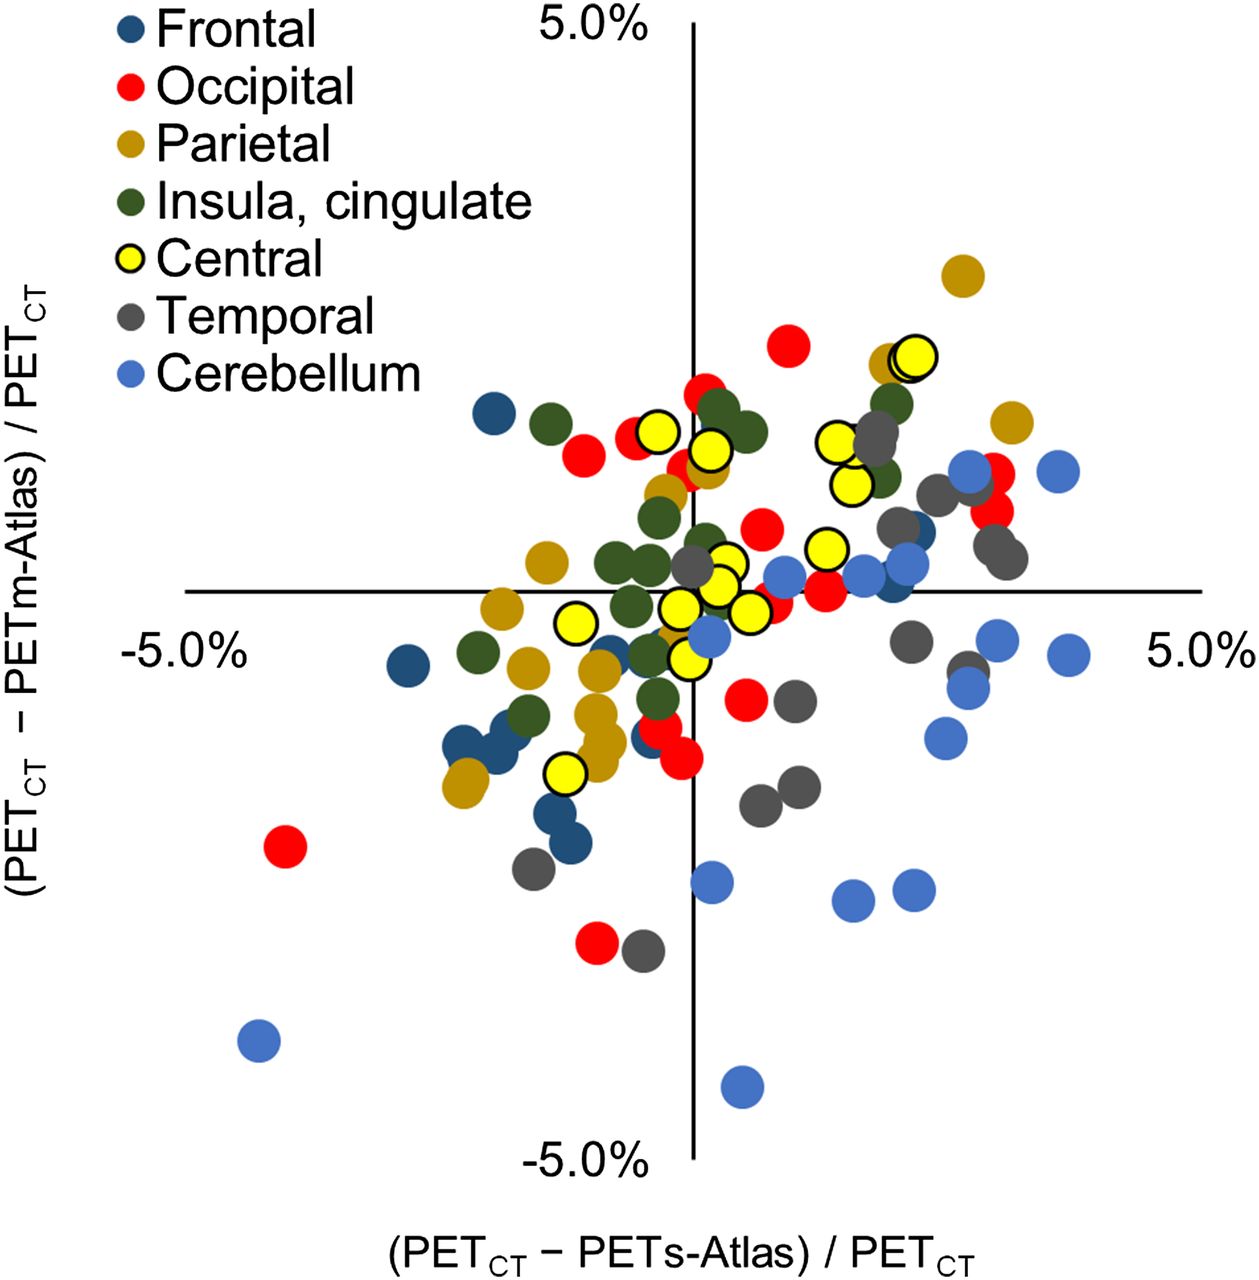
Scatterplot of %diff on s-Atlas and on m-Atlas.
%diff and |%diff| in 18F-FDG Uptake (kBq/mL) Between CT-AC and Each s-/m-Atlas in All Regions (67 × 15 = 1,005 VOIs)
The box plot of each generalized VOI shows that the underestimation with s-Atlas was pronounced in regions close to the skull base, such as the temporal lobes and cerebellum (Fig. 5). Notably, the %diff with m-Atlas in these regions was significantly smaller (s-Atlas vs. m-Atlas: temporal lobes, 1.49% ± 1.37% vs. −0.37% ± 1.41%, P < 0.01; cerebellum, 1.55% ± 1.97% vs. −1.15% ± 1.72%, P < 0.01; Table 2; Supplemental Table 1). In the scatterplot of each generalized VOI, different degrees of positive correlation were found between s-Atlas and m-Atlas results, with a slope of 0.334–0.731 (Fig. 6; Table 3).
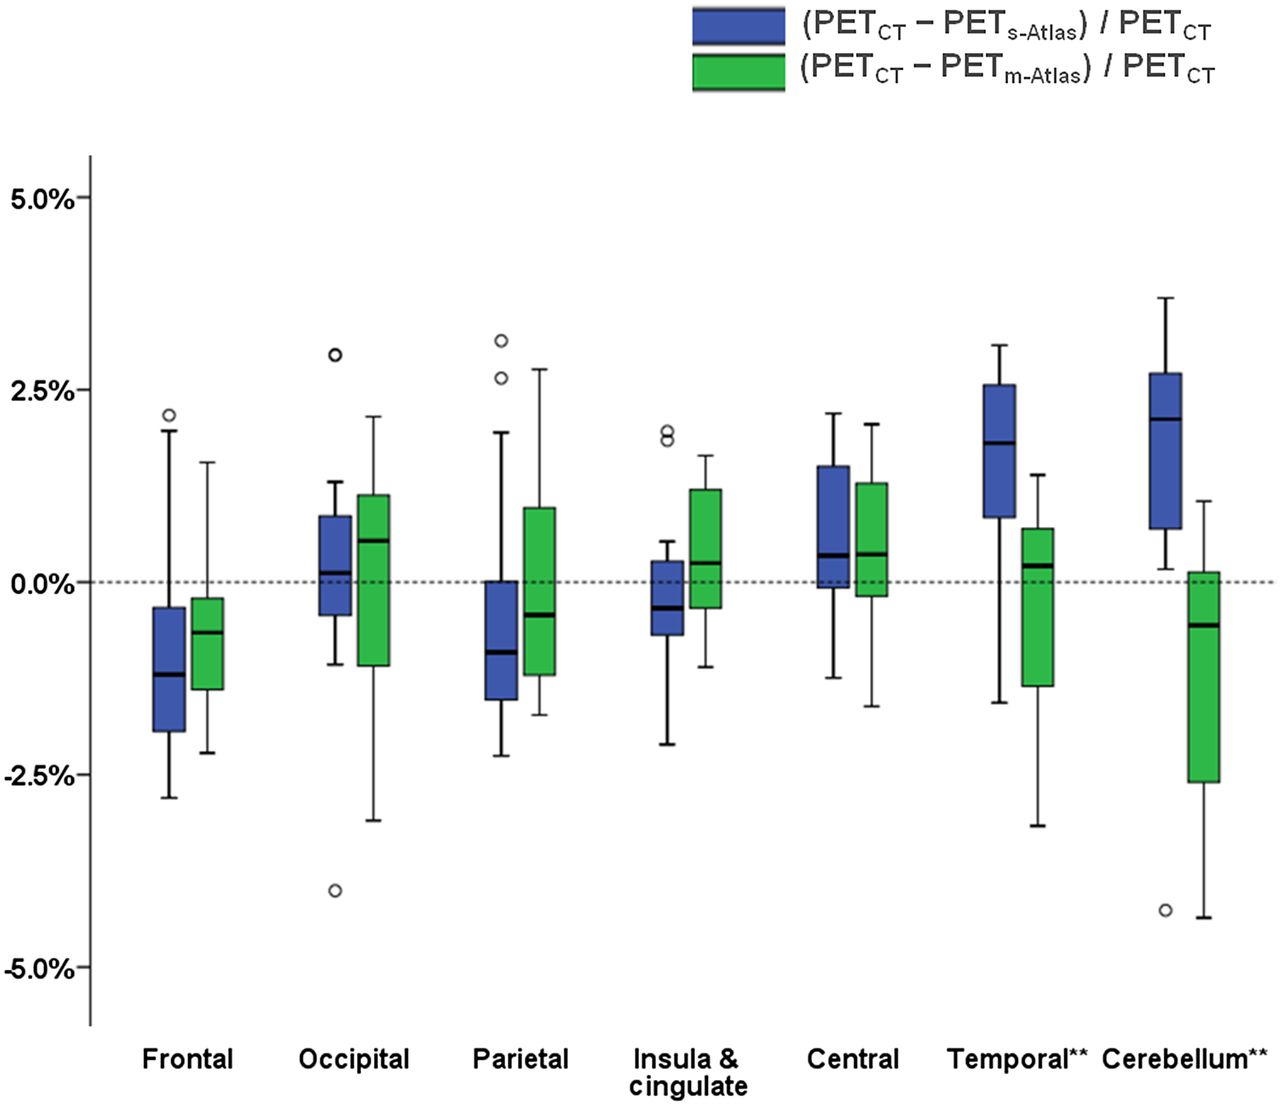
Box plot of each generalized VOI of s-Atlas (blue box) and m-Atlas (green box). In temporal lobe and cerebellum, %diff on m-Atlas is significantly smaller than that on s-Atlas. **P < 0.01 using paired t test with Bonferroni adjustment.
%diff and |%diff| in 18F-FDG Uptake (kBq/mL) Between CT-AC and Each s-/m-Atlas in Each Merged Region

Scatterplot of each generalized VOI of %diff on s-Atlas and on m-Atlas. Dot color corresponds to color of Supplemental Figure 3. R2 and slope of best fit line of each region are given in Table 3.
Correlation Between %diff on s-Atlas and on m-Atlas
Representative cases are given in Figure 7. Generally, the error in the temporal lobes and cerebellum were pronounced on both s-/m-Atlas methods, and the trend of over- or underestimation varied in each patient.

%diff on s-Atlas and on m-Atlas in 3 representative cases, all of which were normalized to a brain template (SPM5). In pt_01, %diff on m-Atlas is much smaller than on m-Atlas, especially in cerebellar and temporal regions. In pt_02, trend of %diff is somewhat different. In cerebellum, s-Atlas underestimated 18F-FDG uptake, whereas m-Atlas overestimated it. Absolute %diff on m-Atlas is smaller than on s-Atlas. Of all 15 patients, pt_03 is only one in whom %diff on m-Atlas was apparently larger than on s-Atlas, especially in cerebellum. Bottom row is respective high-resolution T1w image for %diff map.
DISCUSSION
In this study, we evaluated the clinical feasibility of a multi-atlas–based method by comparing it with a single-atlas–based AC method—which is clinically used in our institution—using data from patients imaged in a clinical TOF PET/MRI scanner. The overall error of m-Atlas was 20% lower than that of s-Atlas. Without TOF, the overall error of both s-Atlas and m-Atlas increased by 10%–20% compared with TOF. With the m-Atlas, significant improvement was found in the temporal lobes and cerebellum in comparison with the s-Atlas.
To our knowledge, this is the first study to evaluate the performance of the chosen m-Atlas using data acquired on a TOF PET/MRI scanner. The features and advantages of this study are as follows.
First, we performed the assessment using the real TOF PET/MRI scanner data, not simulation data, for example, combining PET/CT data with MRI data. State-of-the-art TOF PET/MRI machines using silicon photomultipliers with less than 400 ps temporal resolution allows for TOF acquisition (15). TOF measurement cannot fully compensate for the error of AC map but makes the residual error spread over a much larger area, preventing localized high-error regions (16–18). Therefore, evaluating the clinical feasibility with a new AC method is desirable in this setting.
Second, we compared the m-Atlas with the s-Atlas method, which is currently used in clinical PET/MRI scanners such as those installed in our institution. If only 1 method is compared with the gold standard in a small sample, results may highly depend on the interindividual variability. Hence, for testing the clinical feasibility of a new method, the comparison with current clinical methods on PET/MRI scanners is mandatory.
Third, through the use of a widely available brain template (AAL), our results can be readily applied to another dataset or used in other centers.
The error of the investigated AC methods may be caused not only by the systematic errors due to the atlas model but also by the less systematic ones. A good correlation with constant offset would point toward shortcomings of the atlas model (e.g., temporal bone is so thin that it causes systematic underestimation of activity in the region close to the bone), whereas a bad correlation would suggest less systematic errors, such as those caused by misregistration, which was seen in the occipital/cerebellar region (Fig. 6; Table 3).
In our study, the range of absolute relative error in any VOI did not exceed 5%, and the relative error and absolute relative error of m-Atlas across all 1,005 VOIs were −0.06% ± 1.50% and 1.21% ± 0.89%, respectively, which are generally comparable to other studies (19–22). Previously reported absolute relative percentage errors of PET images range from 1.38% ± 4.52% to 2.55% ± 0.86% (19–22), though care should be taken when comparing these studies and the present study, due to analysis variations. The use of TOF in our study compensates for the AC error and makes the residual error spread (16–18). We assume that this effect minimizes the range of errors for both s-Atlas and m-Atlas.
For clinical s-Atlas, the low-resolution LAVA in-phase images with an 18-s acquisition time were used. The sequence was selected in a clinical PET/MRI scanner for a combination of reasons. It is used in full-body imaging for fat-water separation, as well as for atlas registration in the head. In those cases in which the atlas method is not suitable (e.g., pediatric or postoperative patients), the segmentation-based method used in body imaging can also be extended to the head. Finally, with only an approximately 18-s acquisition time, it helps to maintain a time-efficient PET/MRI workflow. Unlike using relatively low-resolution and low-contrast T1w images as in our study, Burgos et al. combined both T1w images and T2-weighted images to generate a pseudo-CT (12). They reported the relative percentage errors and the absolute relative percentage errors of 18F-FDG uptake to be −0.56% ± 0.98% and 1.71% ± 0.62%, respectively. Our results, −0.06% ± 1.50% and 1.21% ± 0.89% of m-Atlas, were comparable to their result even though we used somewhat inferior MR source images, which may result in worse registration between the patient-specific MR image and atlas database. Thus, our results indicate that this effect is small and the accuracy is maintained even in low-resolution but fast MR images. This suggests that the m-Atlas method could be used in different scanners types and with different clinical protocol settings. Future work is required to validate this claim.
For both the s- and the m-Atlas, the mean and SE in the regions close to the skull base, temporal lobes, and cerebellum were larger than in other regions. This tendency was also observed in other studies (11,19–22). This issue is explained by 2 reasons. First, in the skull base region, the interface between bone and soft tissue is axially aligned, corresponding to the highest sensitivity lines of response. As a result, even small superior/inferior registration errors in the attenuation map can cause high attenuation bias. Second, there is a high interindividual variation of the pneumatization of temporal bone, leading to larger errors in the AC map of this area. Proper differentiation of bone and air is critical for AC because their attenuation properties differ a great deal.
In this study, the s-Atlas performed better than in a previous study (11). This better performance was due to the difference of MRAC LAVA images. In the previous study, the flip angle of LAVA was 12°, compared with 5° in our study, which led to more proton-density-weighted images, more suitable for automated segmentation. This difference may improve the bone detection from LAVA in-phase images, subsequently making the registration better.
One drawback of m-Atlas is the computational effort. On average, it took 1 h 45 min to generate the pseudo-CTs with the images we uploaded to the website. This computational time depends on the quality of the registration wanted, on the number of subjects in the database, and on the way the registrations are run (in series/parallel, 1 core/multiple cores). Though this could be reduced at least by half by optimizing the registration process, it might still be too long for clinical examinations. However, the selective use of either method for a specific clinical aim is feasible. For example, when screening for brain metastases, s-Atlas is enough accurate, whereas for the detailed assessment of the dementia, m-Atlas is recommended. Furthermore, the improvement of hardware and software processing may reduce in the future current resource demands of the investigated m-Atlas method.
A limitation of our study is the small number of patients considered. However, using automated methods and comparing 2 AC methods, s-Atlas and m-Atlas, against a gold standard we aimed to reduce bias. PET acquisition was not ideal for a brain PET scan: for some of the patients, the scan duration was relatively short, 4 min. The shorter acquisition time leads to a decrease in the signal-to-noise ratio of the PET images. However, analysis of AC error on a regional level (AAL VOI) reduced the sensitivity to the noise at the voxel level.
CONCLUSION
Errors introduced using the multi-atlas–based AC method on a TOF PET/MRI scanner did not exceed 5% in any brain region. This error is approximately 20% smaller than that of the clinically used single-atlas–based AC method. The greatest improvement with multi-atlas–based AC was found in brain regions close to the skull base.
DISCLOSURE
The costs of publication of this article were defrayed in part by the payment of page charges. Therefore, and solely to indicate this fact, this article is hereby marked “advertisement” in accordance with 18 USC section 1734. Patients were acquired as part of a GE-sponsored CE-Certification study. Funding was received from the National Institute for Health Research University College London Hospitals Biomedical Research Centre (NIHR BRC UCLH/UCL High Impact Initiative BW.mn.BRC10269) and the EPSRC (EP/K005278/1). Patrick Veit-Haibach received IIS grants from Bayer Healthcare, Roche Pharmaceutical, GE Healthcare, and Siemens Medical Solutions and speaker fees from GE Healthcare. Gaspar Delso is an employee of GE Healthcare. Only non-GE employees had control of inclusion of data and information that might present a conflict of interest for authors who are employees of GE Healthcare. No other potential conflict of interest relevant to this article was reported.
Footnotes
Published online Mar. 24, 2016.
- © 2016 by the Society of Nuclear Medicine and Molecular Imaging, Inc.
REFERENCES
- Received for publication October 30, 2015.
- Accepted for publication February 25, 2016.


Jump to section
Related Articles
Cited By...
- No citing articles found.